Table of Contents
Advertisement
Quick Links
Advertisement
Table of Contents
Troubleshooting

Related Manuals for Snap-On TRITON-D10


Summary of Contents for Snap-On TRITON-D10
- Page 1 User Manual Start...
-
Page 2: Table Of Contents
Data Views (List / Graph) ..............31 Section 2: Companion Applications ............13 Locking PIDs (to always display at top) ..........31 Snap-on Cloud ..................... 13 About the Data Buffer ................32 Authorization Codes ................14 About Cursors ..................33 ShopStream Connect™... - Page 3 Troubleshooter..................... 40 Screen Layout ..................64 Guided Component Tests Control Icons ..........65 Section 5: Vehicle Code Scan ..............41 Operation..................... 65 Using Code Scan ..................42 Component Information................. 66 Total Number of Systems (modules) Analyzed ........43 Tests ..................... 67 List of All the Systems Analyzed with DTCs Totals .......
- Page 4 Add Network Advanced (Connecting to a hidden network) ....... 128 Setting up your Wi-Fi connection ............111 Wi-Fi Testing ..................... 129 Setting up the Snap-on Cloud ............. 112 Wi-Fi Troubleshooting and Status Messages..........129 Sharing a pre and post scan report (Code Scan Report) ....112 Legal Information ..................
-
Page 5: Safety Information
Safety Information READ ALL INSTRUCTIONS Read, understand and follow all safety messages and instructions in this manual, the accompanying Important Safety Instructions manual, and on the test For your own safety, the safety of others, and to prevent damage to the product and equipment. - Page 6 Safety Information Safety Message Conventions Safety Message Conventions Safety messages are provided to help prevent personal injury and equipment damage. Safety messages communicate the hazard, hazard avoidance and possible consequences using three different type styles: Normal type states the hazard. •...
-
Page 7: Customer Support / Links
North Customer Support / Links America Website ® Snap-on Cloud diagnostics.snapon.com altusdrive.com User Manuals / Instructions ® SureTrack Community snapon.com/diagnostics/us/UserManuals Use ShopKeyPro.com, or ProDemand.com Phone SureTrack Login Info: mitchell1.com/micro/stc/ www. 1-800-424-7226 Secure Vehicle Gateway™ E-Mail www.snapon.com/gateway diagnostics_support@snapon.com ® Training Solutions... -
Page 8: Section 1: Introduction / General Information
Introduction / General Information Section 1 Quick Links Serial Number / Software Version Specifications page 1 • The diagnostic tool serial number and software version can be viewed from: Powering On/Off page 2 Home: Tools > System Information (see • System Information on page 123). -
Page 9: Powering On/Off
Introduction / General Information Powering On/Off Powering On/Off Emergency Shutdown Press and release the Power button to turn on the tool. To force an emergency shutdown, press and hold the Power button for five seconds until the tool turns off. Power may be supplied by any one of the following: Emergency shutdown should only be used If the diagnostic tool does not respond to Charged internal battery pack... -
Page 10: Features And Buttons
Introduction / General Information Features and Buttons Features and Buttons NOTE Touch screen controls are used for most operations, however the control buttons may also be used to navigate and select functions. Item Description Power Supply Jack Battery Status Indicator LED Scope Meter Jacks Mini USB Jack Micro secure digital (uSD) Card - contains operating system... -
Page 11: Home Screen And Title Bar
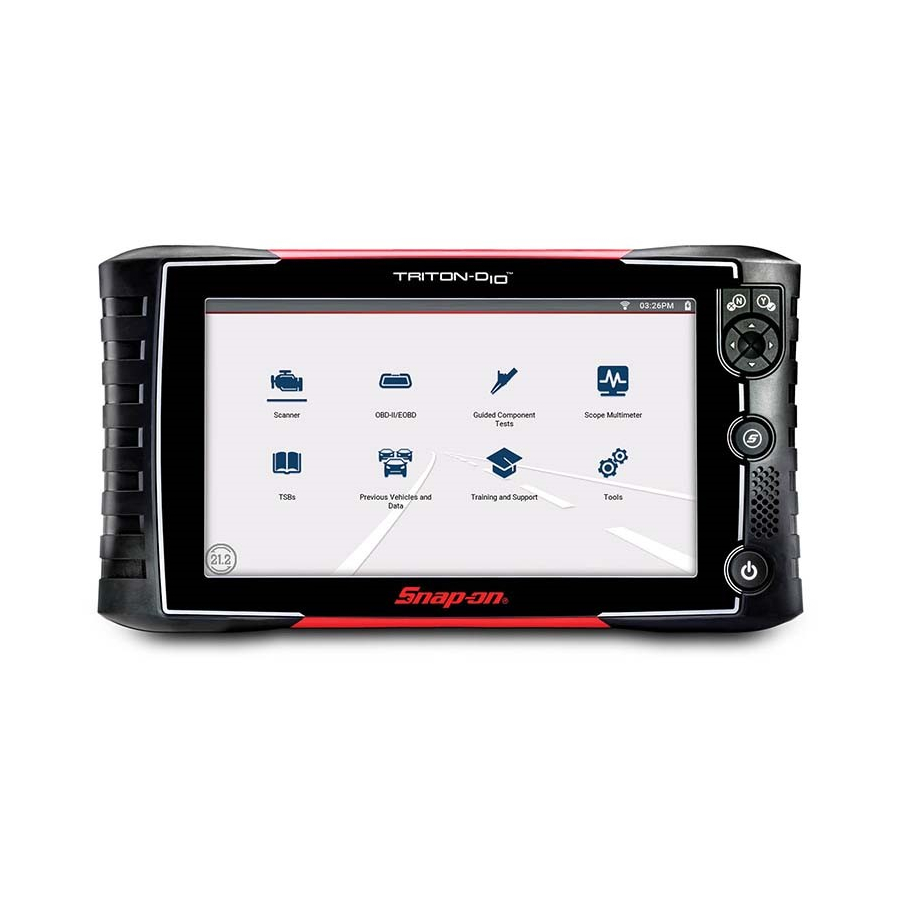
Introduction / General Information Home Screen and Title Bar Home Screen and Title Bar Home Screen Icons (Links) Scanner 13.7 V OBD-II/EOBD 13.7 V Guided Component Tests Scope Multimeter Quick Lookups Previous Vehicles and Data Common Title Bar Indicators Training and Support 1—... -
Page 12: Quick-Access Menu
Use the Quick-Access Menu as a shortcut to “jump” between functions, or to Exit the active vehicle. This menu is available within most functions (after identifying a Use the Snap-on Cloud and ShopStream Connect to print reports, screenshots and vehicle), and is application sensitive, being that it provides only applicable links data from the diagnostic tool. -
Page 13: Icon Reference Table
Introduction / General Information Icon Reference Table 1.11 Icon Reference Table Zoom - Incrementally Lock - Locks PIDs to the increases and decreases the The following table includes only common icons, not all icons are shown. Some top of the list. scale of the data displayed. - Page 14 Introduction / General Information Icon Reference Table Tire and Wheel Service Forward 1 Frame - allows forward movement by one Opens the TPMS test frame. To quickly skip related Scanner menu. forward, select this icon Displays TPMS indicator Options may include, (yellow frame appears reset instructions, to perform view and clear codes,...
-
Page 15: Battery Pack
Introduction / General Information Battery Pack 1.12 Battery Pack Keep the battery pack out of reach of children. • Do not use a battery pack that appears to have suffered abuse or damage. • Charge the battery pack in the appropriate charger only. •... -
Page 16: Charging
Introduction / General Information Battery Pack INSTALLATION (Figure power source, and connected to the diagnostic tool. Use the supplied AC power 1-5) supply to charge the battery pack. 1. Position the battery pack as shown below with the arrows facing up. 2. -
Page 17: Ordering A Replacement
Introduction / General Information Care and Cleaning 1.13 Care and Cleaning 1.12.4 Ordering a Replacement If the battery pack needs to be replaced, contact your sales representative to order a Periodically perform the following tasks to keep your diagnostic tool in proper working new battery pack. -
Page 18: Diagnostic Quick Tips - Video Series
1.15 Diagnostic Quick Tips - Video Series NOTES Snap-on Diagnostic Quick Tips videos are available at no charge on our website and URL links (above) and titles listed (below) are subject to change and may not be available in all markets. -
Page 19: Training Videos (Online)
Introduction / General Information Training Videos (Online) 1.16 Training Videos (Online) Snap-on® Training Solutions® - Diagnostic Quick Tips Videos (examples) Ford Relative Injector Flow Test Speed Up Your Diagnostics (Scanner) Diagnostic tool specific training videos are available on our website (see Website page vii). -
Page 20: Section 2: Companion Applications
/ instructions on the product website (see Customer Support / Links on page vii). Snap-on Cloud For more information on the features and operation of the Snap-on Cloud, see the Snap-on Cloud User’s Guide on the website, and visit ALTUSDRIVE.com Figure 2-1 NOTE Wi-Fi Required - Wi-Fi connection is required to use this application. -
Page 21: Authorization Codes
Customer Support / Links on page vii). NOTE The authorization codes needed to register and use the Snap-on Cloud are located on the Get Connected screen (Figure 2-3). This application requires USB connection of the diagnostic tool to a personal computer with Internet access. - Page 22 Companion Applications ShopStream Connect™ (Connecting to your PC) Figure 2-4 Figure 2-5...
-
Page 23: Suretrack® (On Pc)
Companion Applications SureTrack® (On PC) ® SureTrack (On PC) For more information on SureTrack, see the Suretrack User’s Guide on the product website (see Customer Support / Links on page vii). NOTE This application requires Internet access, via computer or mobile device. Your diagnostic tool may include authorization to access to the online SureTrack Community. -
Page 24: Section 3: Data Cable / Connections
Data Cable / Connections Section 3 About Ethernet Equipped Vehicles Data Cable Connection (OBD-II/EOBD and Data Cables Vehicles) Automotive Ethernet can be thought of, as the physical networking architecture IMPORTANT used to allow multiple vehicle controllers and components to communicate. Ethernet can transport data 100 times faster than CAN and is better suited for the Only use the supplied data cable, and/or original equipment accessory needs of modern safety systems. - Page 25 Data Cable / Connections Data Cable Connection (OBD-II/EOBD Vehicles) The supplied data cable, includes an LED flashlight on the vehicle DLC 2. Connect the 16-pin (J-1962) end of DA-4E cable (Figure 3-3) to the vehicle connector end (Figure 3-2). The LED flashlight is powered by the diagnostic DLC.
-
Page 26: Data Cable Connection (Obd-I Vehicles)
7— Accessory Power Cable (Power port type) Typical - OBD-I Manufacturer Specific Adapter NOTE (e.g. BM-1B shown) European OBD-I Only use original Snap-on data cables and accessories with your diagnostic tool. Total data cable length must not exceed 114.17 inches (2.9 meters). Figure 3-4... -
Page 27: Optional Obd-I Data Cables And Adapters
Data Cable / Connections Data Cable Connection (OBD-I Vehicles) 3.3.1 Optional OBD-I Data Cables and Adapters An optional OBD-I data cable adapter (DA-5) is available, which allows • connection of the supplied DA-4E (OBD-II/EOBD) cable to the DA-5 adapter. The DA-5 adapter connects to the manufacturer specific OBD-I adapter. This may be used instead of the optional OBD-I data cable. -
Page 28: Section 4: Scanner
Scanner Section 4 General Information The Scanner function allows your diagnostic tool to communicate with the electronic control modules (ECMs) of a vehicle. This allows you to perform tests, view diagnostic trouble codes (DTCs), and 4.2.1 Scanner Control Icons data parameters from various vehicle systems such as the engine, transmission, antilock brake system (ABS) and more. -
Page 29: Secured Vehicle Gateway
Scanner General Information 4.2.3 Quick-Access Menu Icon Function Icon Function Diagnose - Opens Fast- Selecting the Home icon opens the Quick-Access menu, depending on your Track® Intelligent Save - Saves the active location in the software. Use this feature as a shortcut to “jump” between functions, Diagnostics for the selected information to memory. -
Page 30: Basic Operations
Scanner Basic Operations Basic Operations 4.3.2 Vehicle Identification NOTE 4.3.1 Scanner Overview Menus, options and procedures vary by vehicle. Not all vehicles support Auto Navigation ID and, or Instant ID. Home Screen: Scanner Depending on the vehicle, the vehicle identification process may require manual entry of the vehicle information, or it may be automated. - Page 31 Scanner Basic Operations Instant ID NOTE Instant ID automatically communicates with the vehicle to start the vehicle Data cable location and connection information may be provided. identification process. Operational Requirements: Vehicle requirements: • Vehicle must support Mode $09 VIN. – - Note: Mode $09 VIN is mandated on 2008 and newer vehicles.
-
Page 32: System And Test Selection
Scanner Basic Operations 4.3.3 System and Test Selection Navigation Navigation Home Screen: [Typical] Scanner (Vehicle Identification) > (Vehicle System Menu) > (Vehicle System Main Menu) Home Screen: [Typical] Scanner (Vehicle Identification) > (Vehicle System Menu) on page 26 for descriptions of typical System Working with Trouble Codes After the vehicle is identified, a menu of available systems and/or test options is Main Menu options. -
Page 33: Working With Trouble Codes
Scanner Working with Trouble Codes Working with Trouble Codes 4.4.3 Display Codes The following sections describe a few trouble code functions found within a typical Navigation System Main Menu. Home Screen: [Typical] Scanner (Vehicle Identification) > (Vehicle System Menu) NOTE >... -
Page 34: Freeze Frame/Failure Records
Scanner Working with Trouble Codes 4.4.4 Freeze Frame/Failure Records 4.4.5 Clear Codes Navigation Navigation Home Screen: [Typical] Scanner (Vehicle Identification) > (Vehicle System Menu) Home Screen: Scanner (Vehicle Identification) > (Vehicle System Menu) > > (Vehicle System Main Menu) > (Codes Menu) > (Display Codes) > (Freeze (Vehicle System Main Menu) >... -
Page 35: Service Resets And Relearns
Scanner Service Resets and Relearns Service Resets and Relearns Navigation Home Screen: [Typical] Scanner (Vehicle Identification) > (Vehicle System Menu) > (Service Resets and Relearns) The Service Resets and Relearns option, saves you time by providing you with a full menu of vehicle specific resets/relearns (functional tests) and related OEM information to help you successfully start and complete these services. -
Page 36: Working With Data (Pids)
Scanner Working with Data (PIDs) Working with Data (PIDs) All System Data - display all available PIDs for that system. As an example • from within an Engine system Data menu, the Engine Data option can be used to display all Engine related PIDs. The following sections describe common data functions. -
Page 37: Pid (Alarm) Indicator
Scanner Working with Data (PIDs) Figure 4-13 Figure 4-15 Figure 4-14 4.6.3 PID (Alarm) Indicator Visual (alarm) indicators can be set for two state PIDs. Two state PIDs include components and circuits that only operate in two modes or “states” (e.g. solenoids, relays, and switches that are either, open/closed, on/off, true/false, etc.). -
Page 38: Data Views (List / Graph)
Scanner Working with Data (PIDs) 4.6.4 Data Views (List / Graph) Bottom - Active minimum and maximum values • Data may be displayed in either list or graph form. shows a four PID graph view (top) and PID list view (bottom). Figure 4-17 To change the data display type, select the View icon. -
Page 39: About The Data Buffer
Scanner Working with Data (PIDs) 4.6.6 About the Data Buffer 6— Maximum Data Buffer Size (Data Buffer Position Counter) - indicates the maximum data buffer size value (e.g. 4000) The diagnostic tool has the capability to collect, store and save PID data utilizing 7—... -
Page 40: About Cursors
Scanner Working with Data (PIDs) 4.6.7 About Cursors 4.6.8 Pausing and Reviewing Active Data Vertical cursors are automatically displayed (in graphical PID views) to mark During normal operation, data from the vehicle is continuously being stored in buffer specific data reference points. memory as it is displayed onscreen. -
Page 41: Saving Data Files
Scanner Working with Data (PIDs) Figure 4-24 4.6.9 Saving Data Files Saving data is useful when trying to isolate an intermittent problem or to Figure 4-23 verify a repair. During normal operation, data from the vehicle is To resume data collection (after pausing), select the Start icon continuously being stored in buffer memory as it is displayed onscreen. -
Page 42: Viewing Data Files
Scanner Working with Data (PIDs) 4.6.10 Viewing Data Files Viewing Data Files on the Tool Navigation Home Screen: Previous Vehicles and Data > Saved Data 1. Select the desired data file (.SCM file extension), see Saved Data on page 121 for additional information. -
Page 43: Using Zoom
Scanner Working with Data (PIDs) 4.6.11 Using Zoom 4.6.12 Using Triggers The zoom function allows you to change the magnification level of the Trigger Description and Features graphed data during data collection and review. Changing magnification levels allows you to compress or expand the displayed data to quickly Setting PID triggers allows you to configure the diagnostic tool to find glitches, or signal losses. - Page 44 Scanner Working with Data (PIDs) Examples of the following trigger states (Armed / Not Activated - upper image) and PID Trigger Status Icons (Activated - lower image) are shown in (Figure 4-27). The icons (below) are used to help you quickly identify the status of individual PID triggers: Icon Description...
- Page 45 Scanner Working with Data (PIDs) If triggers are already set, the menu options are: - Clear Trigger—deletes the highlighted trigger - Disarm Trigger—disarms the highlighted trigger - Clear All Triggers—deletes all set triggers 3. Select Set Trigger. A graph of the highlighted PID and setup icons display (Figure 4-29).
-
Page 46: Functional Tests
Scanner Functional Tests Arming triggers: 1. Select the Trigger icon. 2. Select Arm Triggers. The trigger point lines change color to indicate an armed condition (Figure 4-32). All set PID triggers are armed simultaneously (if more that one is set). Once armed it remains armed until you clear it or the trigger is activated. -
Page 47: Troubleshooter
Scanner Troubleshooter Troubleshooter IMPORTANT Navigation Follow all screen instructions while performing tests. Home Screen: Scanner (Vehicle Identification) > (Vehicle System Menu) > Different toolbar controls are used depending on the functional test. Some tests use (Vehicle System Main Menu) > (Troubleshooter) a Test icon to switch actuators on/off, and some require variable controls selection to increase and decrease a testing value. -
Page 48: Section 5: Vehicle Code Scan
Vehicle Code Scan Section 5 Code Scan allows you to quickly scan all supported vehicle control Page: 1 Date: 04/01/2020 10:16AM modules for codes and monitor readiness. Pre-Scan Vehicle System Report 2016 Nissan Rogue 2.5L VEHICLE INFORMATION JN8AS5MT0FW000000 MAKE Nissan 2016 YEAR MODEL... -
Page 49: Using Code Scan
Code Scan result descriptions are provided in the following sections. After the code scan has competed it is automatically saved as an .XML file on the Figure 5-2 diagnostic tool, and is uploaded to your Snap-on Cloud account. To view the report on the diagnostic tool, see •... -
Page 50: Total Number Of Systems (Modules) Analyzed
Vehicle Code Scan Using Code Scan 5.1.2 List of All the Systems Analyzed with DTCs Totals A categorized system list with DTC totals is displayed in the order they are scanned. Code Scan Icons To view the main menu for a system in the list, select the system or select the System icon (Figure 5-6). -
Page 51: Global Obdii Dtcs
Vehicle Code Scan Using Code Scan Select the expand/collapse icon (Figure 5-7) on the left side of a system category NOTE title to expand or collapse a systems’ DTC list. Some 2005 to 2008 vehicles may not display global OBD-II information in the Code Scan list. -
Page 52: Vehicle System Report
• Readiness monitor test status • 5.2.1 Printing the Vehicle System Report Use the Snap-on Cloud to print the vehicle system report from your PC or mobile device, see Snap-on Cloud on page 13. The vehicle system report can also be customized and printed using ShopStream Connect - See ShopStream Connect™... -
Page 53: Section 6: Fast-Track® Intelligent Diagnostics
® Fast-Track Intelligent Diagnostics Section 6 Introduction Fast-Track® Intelligent Diagnostics saves you time by providing access to code related data, information, and tests, all from one screen. It allows you to quickly find TSB's, smart data PID lists, out-of-range PIDs, functional tests, Sure Track Top Repairs Graph and Real Fixes, and more all at a glance. -
Page 54: Accessing Fast-Track® Intelligent Diagnostics
Fast-Track® Intelligent Diagnostics Accessing Fast-Track® Intelligent Diagnostics Main Menu ® Accessing Fast-Track Intelligent Diagnostics Fast-Track® Intelligent Diagnostics functions are contained in a common multi-card main menu (Figure 6-4). Card functions are described in the following sections. To access Fast-Track® Intelligent Diagnostics, you must: Fast-Track®... -
Page 55: Wi-Fi Status Indicator
Fast-Track® Intelligent Diagnostics Wi-Fi Status Indicator Wi-Fi Status Indicator Top Repairs Graph The cloud icon indicates Wi-Fi connection status (Figure 6-4). This icon is also used The Top Repairs Graph (Figure 6-7) shows the most common verified fixes and to indicate Fast-Track® Intelligent Diagnostics service expiration. The icon will procedures for the selected code. -
Page 56: Technical Bulletins (Oem Information)
Fast-Track® Intelligent Diagnostics Technical Bulletins (OEM Information) Technical Bulletins (OEM Information) The Technical Bulletins card (Figure 6-10) provides a quick link to available OEM Recall, TSB and Campaign information that is code related. A red icon (Figure 6-10) indicates the total number of Recalls, TSBs, and OEM Campaigns that have been found. -
Page 57: Smart Data
Fast-Track® Intelligent Diagnostics Smart Data Smart Data PID Graph View (Figure 6-15). Smart Data automatically configures the data list to only show PIDs related to the selected code. Non-related PIDs are filtered out, to save you time. In addition, it highlights PIDs that are out of expected range. -
Page 58: About Smart Data Pids
Fast-Track® Intelligent Diagnostics Smart Data 6.8.1 About Smart Data PIDs When a trigger is activated: Data collection continues briefly after the trigger point, then pauses as the • Features and operation of Smart Data PIDs: Scanner captures a recording of the data. Data is saved leading up to and just Any PID with a flag displayed has been preset and prearmed. -
Page 59: Functional Tests And Reset Procedures
Fast-Track® Intelligent Diagnostics Functional Tests and Reset Procedures Functional Tests and Reset 6.10 Real Fixes Procedures The Real Fix displayed on the Main Menu (Figure 6-20) is the most common to date. The information is displayed in a Complaint - Cause - Correction format. Functional Tests and Reset Procedures (Figure 6-18) provides access to supported... -
Page 60: Troubleshooter
Fast-Track® Intelligent Diagnostics Troubleshooter Select a Related Tip from the list (Figure 6-25) to view the information (Figure 6-26). Figure 6-25 Figure 6-23 6.11 Troubleshooter Troubleshooter (Figure 6-25) provides a list of available code-related tips gathered from industry professionals. NOTE Troubleshooter Tips may not be available for every vehicle and/or DTC. -
Page 61: Section 7: Quick Lookups
/ Troubleshooting on page 127. — The diagnostic tool is equipped with the ability to connect to a Wi-Fi network, however the connection is solely dedicated to our Snap-on Information Service Network. Before you begin using an integrated Quick Links Information Service you must connect to a wireless network. -
Page 62: Operation
Quick Lookups Oil Specs and Resets 7.1.1 Operation 7.1.2 Fluid Capacity There are two methods to access Oil Specs and Resets: Selecting the Fluid Capacity icon displays OEM recommended engine oil 1. From the Home screen - select the Quick Lookups icon, then select Oil and capacity information (Figure 7-2). -
Page 63: Functional Reset
Quick Lookups Oil Specs and Resets 7.1.3 Functional Reset Selecting the Functional Reset icon opens the service interval reset menu (within the Scanner function) for the selected vehicle, and includes functional resets for the oil service indicator and other supported resets. Instructions may be provided, that are required to be performed before selecting or completing the reset function itself. -
Page 64: Tire And Wheel Service
— The diagnostic tool is equipped with the ability to connect to a Wi-Fi network, however the connection is solely dedicated to our Snap-on Information Service Network. Before you begin using an integrated Information Service you must connect to a wireless network. -
Page 65: Operation
Quick Lookups Tire and Wheel Service 7.2.1 Operation TPMS Indicator Reset There are two methods to access Tire and Wheel Service: Selecting the TPMS Indicator Reset icon displays TPMS indicator 1. From the Home screen - select the Quick Lookups icon, then select Tire reset instructions. - Page 66 Quick Lookups Tire and Wheel Service TPMS Remove & Repair (TPMS Service) Scanner Functions Selecting the Remove & Repair (TPMS Service) icon displays TPMS Selecting the Scanner Function icon opens the TPMS Scanner test service information. menu for the selected vehicle. Typical information may include: Options may include: Removal and installation instructions.
- Page 67 Quick Lookups Tire and Wheel Service Figure 7-9 Figure 7-8 Tire/Wheel Specifications (Fitment) Selecting Tire/Wheel Specifications displays OEM tire and wheel specifications (Figure 7-9). Typical information may include: Tire size and pressure • Wheel hub stud size and lug torque •...
-
Page 68: Section 8: Guided Component Tests
Guided Component Tests Section 8 Training and Classes The Guided Component Tests function provides you with an extensive collection of vehicle specific component tests and Training and Classes is a companion feature to the Guided Component Tests reference information. It is like having access to a complete library function. -
Page 69: Power User Tests
Here is a sample listing of the types and specific tests that may be available within Power User Tests: Navigation Current Probe Tests - provides common tests configured to use the Snap-on • Home Screen: Guided Component Tests > Training and Classes >... -
Page 70: How To
Understanding Oxygen Sensors (includes configured meter test) Home Screen: Guided Component Tests > Training and Classes > How To Snap-on Automotive Theory— provides basic theory information on multiple • topics including: The How To option provides multiple topics and references ranging from •... -
Page 71: Screen Layout And Icons
20-minute Current Ramp Classes—provides an introduction to current ramp • 8.2.1 Screen Layout testing using the Snap-on Low Amp Current Probes. Snap-on Low Amp Current Probe operation information is also provided within the Snap-on Low Amp Probe Reference Manual option. Topics may include: •... -
Page 72: Guided Component Tests Control Icons
Guided Component Tests Operation Operation Main Body The main body of a Guided Component Test screen may display any of the As the information and tests provided within the Guided Component Test function is following: vehicle specific, the vehicle must first be identified in order to retrieve the correct Selectable Menu - Select menu options using the touch screen or control data. -
Page 73: Component Information
Guided Component Tests Operation 8.3.1 Component Information A list of Components (and/or sub systems) is displayed (Figure 8-4). 2. Select a Component to continue. Component Information provides (if available) specific operational information on the selected component, and may also include electrical connector and pin location and function details To view component information: 1. -
Page 74: Tests
Guided Component Tests Operation 8.3.2 Tests Component Information is displayed (Figure 8-6). Tests provides (if available) specific instructions to help you perform tests on components. Selecting a component test opens a preconfigured meter to start the test, and may also provide connection instructions, specifications and testing tips. To select a test: 1. - Page 75 Guided Component Tests Operation The test connection information screen displays (Figure 4. Use the Expand/Collapse icon to toggle through split and full screen views 8-8). and to display the control panel (Figure 8-9). Use the scrollbar to display hidden information. 3.
-
Page 76: Saving And Reviewing Data Files
Guided Component Tests Operation Some tests (e.g. signature integrity tests) may include waveforms examples Channel Settings within the information panel. These waveform examples allow you to compare The test meter is preconfigured, for most of the component tests. However, if the your test results for quick diagnosis (Figure 8-10). -
Page 77: Section 9: Scope Multimeter
Scope Multimeter Section 9 Safety Information The Scope Multimeter function allows you to perform multiple types of circuit and component measurement tests. This chapter includes IMPORTANT general operation procedures, instructions for saving and reviewing test data, optional settings, and general reference Over Voltage Installation Category (CAT) - This Scope Multimeter is rated information. -
Page 78: Overview
Scope Multimeter Overview 9.2.1 Digital Multimeter (DMM) The digital multimeter gives you the ability to quickly make precise common electrical measurements (e.g. DC and AC voltage, resistance and amperage) on circuits and components to verify operation. The meter displays measurements in a Figure 9-1 digital numerical format, and is typically used for measuring signals that are not rapidly changing. -
Page 79: Graphing Multimeter (Gmm)
Scope Multimeter Overview 9.2.2 Graphing Multimeter (GMM) Specifications Unlike the DMM, the graphing multimeter provides two channels for testing and Function Range Accuracy/Comments plots a visual graphing line of the signal instead of displaying digital values. The Each channel input is GMM displays a signal’s measurements over time on a two-dimensional grid. -
Page 80: Lab Scope
Scope Multimeter Overview 9.2.3 Lab Scope Specifications Similar to the GMM, the lab scope (oscilloscope) plots a visual image line of a Function Range Accuracy/Comments signal’s measurements over time on a two-dimensional grid. The visual line that is Each channel input is displayed is commonly called a trace, and the graphical form created by a signal is Signal Ch. -
Page 81: Tests And Capabilities (Quick Reference)
Scope Multimeter Tests and Capabilities (Quick Reference) Tests and Capabilities (Quick Test Function Reference) Measures voltage drop across a diode and continuity The following chart identifies and describes available tests by function. through a diode. Scope supplied DC current is passed through the diode to measure the voltage NOTE Diode/Continuity... -
Page 82: Test Leads And Accessories
Scope Multimeter Test Leads and Accessories 9.4.1 Channel 1 Lead Test Function The shielded yellow lead is used with channel 1, and is color matched with the channel 1 jack on the diagnostic tool. Used to measure pressures for typical systems such 100 PSI Pressure as, fuel, oil, EVAP, hydraulic/transmission fluid etc. -
Page 83: Alligator Clips And Probes
Scope Multimeter Test Leads and Accessories 9.4.3 Alligator Clips and Probes 9.4.5 Low Amp Current Probe (optional) Insulated alligator clips and probes (pointed type) can be attached to the end of the The Low Amp Current Probe is used measure AC or DC current up to 60A. This test leads. -
Page 84: Pressure Transducers And Adapters (Optional)
Scope Multimeter Test Leads and Accessories 9.4.7 Pressure Transducers and Adapters (optional) 9.4.8 Waveform Demonstration Tools (optional) Different pressure transducers and adapters are available for measuring positive To help you sharpen your lab scope and graphing multimeter skills, optional and negative gas and liquid pressures. Depending on the adapter, measurement waveform demonstration tools are available as a training aid. -
Page 85: General Information
Scope Multimeter General Information General Information 9.5.1 Scope Multimeter Screen Layout and Features This section describes the general Scope Multimeter control icon functions, screen layout and optional settings. The screen layout and control icon functions are shared between the digital/graphing multimeters and lab scope. NOTE Scope and Multimeter tests are not vehicle specific, therefore vehicle identification is not required. - Page 86 Scope Multimeter General Information Scope Multimeter Control Icons Icon Function The following control icons are common across most Scope Multimeter functions, however use may vary depending on the active function or test. A yellow frame Save - Saves the data stored in buffer memory to a file. surrounding an icon (highlighted), indicates it is selected.
-
Page 87: Operation And Controls
Scope Multimeter Operation and Controls Operation and Controls 9.6.2 Test Lead / Probe Calibration Certain tests may display a confirmation prompt asking “Do you wish to calibrate This section describes the general operation and controls used to configure the this probe?” before continuing with the test. As general practice, it is important to scope or meter to perform testing. -
Page 88: Control Panel And Settings
Scope Multimeter Operation and Controls 9.6.3 Control Panel and Settings NOTE The control panel is common to all three Scope Multimeter functions, and contains The control panel can be toggled on/off by selecting the Expand/Collapse Icon the channel (or “trace”) settings and controls that are used to monitor and adjust the to switch the screen between full and split test meter views. - Page 89 Scope Multimeter Operation and Controls Scale, Sweep and Probe Settings Scale (Vertical scale adjustment) The vertical scale (Y-axis) represents what is being measured (voltage, amperage, The most common and typically the first adjustments made when performing tests pressure etc.), and the unit of measurement it is being measured in. The vertical are the setup or adjustment of the probes and scales.
- Page 90 Scope Multimeter Operation and Controls Example: Selecting 50 psi displays a 50 psi scale that is divided by 10, therefore each division is incremented by 5 psi. 1— Sweep Scale 2— Sweep Scale Menu 3— Sweep Scale Icon Figure 9-17 Figure 9-16 Example: Selecting 500ms, changes the sweep scale to a 500ms scale.
- Page 91 Scope Multimeter Operation and Controls For probe calibration information, see Probe (Probe type “test” selection) Test Lead / Probe Calibration on page 80. Different types of Probes are available from the probe option menu, depending on Probe “test” Options which type of test you are performing. Changing the probe selection, also changes Menu Option Probe / Device Used the vertical scale to the applicable type of measurement.
- Page 92 Scope Multimeter Operation and Controls Channel Settings The majority of the channel (trace) settings and controls are located in the Control 1— Show/Hide (Channel display 10—Refresh—clears Min, Max and Panel. Each setting is represented by an icon, or a value. Icons are used to make on/off)—turns channel on/off Live values and resets to zero adjustments, and the displayed values represent an individual characteristic.
- Page 93 Scope Multimeter Operation and Controls Show/Hide (Channel display on/off) Peak Detect The Show/Hide icons allow you to turn the channels on and off. Peak Detect Off To turn a channel on and off, select the applicable channel’s Show/Hide icon. When peak detect is off, the scope samples at a high rate but saves just enough sample points to the data buffer memory to plot a waveform across the screen.
- Page 94 Scope Multimeter Operation and Controls Peak Detect On In addition, the filter is also helpful for low amp probe tests, as a low voltage scale is used to measure the output of the probe (due to the conversion factors of the When peak detect is “on”, all sample points are evaluated.
- Page 95 Scope Multimeter Operation and Controls Coupling AC NOTES Coupling AC subtracts the average value of a signal so that small variations can be Triggers can be set on any channel, however only one trigger can be activated displayed in the waveform. This is accomplished by blocking the direct current (DC) (used) at a time.
- Page 96 Scope Multimeter Operation and Controls To set trigger position: Trigger position (also called trigger level) can be adjusted in two ways: Dragging the trigger marker (Figure 9-21) on the touch screen - rough – adjustment Using the trigger position control panel (Figure 9-21) - fine adjustment –...
- Page 97 Scope Multimeter Operation and Controls Trigger Auto/Manual Mode (Optional Setting) Threshold NOTE NOTE The Auto and Manual Trigger modes allow you to set the criteria used to The Threshold function is only available in the Graphing Meter function for display signals on the screen. To change the trigger mode, the trigger must be specific tests.
- Page 98 Scope Multimeter Operation and Controls Refresh Cursors Selecting the Refresh icon (Figure 9-24) clears the digital values (minimum, NOTE maximum and live measurements) displayed and restarts from zero. The Cursors feature is only available in the lab scope and Graphing Meter Use the Refresh feature to: functions.
- Page 99 Scope Multimeter Operation and Controls Cursor Measurements Panel When the cursors are turned on, the Refresh, Min, Live, Max display panel is switched off and replaced by the Cursor Measurements Panel. The cursor measurements panel displays the following signal and cursor measurements: Signal amplitude at two points •...
-
Page 100: Secondary Ignition Testing
Scope Multimeter Operation and Controls Secondary Ignition Adapters available: NOTE • Different secondary ignition coil adapters are available as optional equipment. Frequency is the number of times a signal repeats itself per second and is These adapters attach to either the secondary lead (spark plug lead) or directly measured in hertz (Hz). -
Page 101: Optional Settings
Scope Multimeter Optional Settings Optional Settings Connecting the Secondary Coil Adapter Leads: 1. Connect the black (ground) lead into the diagnostic tool test lead ground jack. Navigation 2. Connect the yellow lead into the diagnostic tool test lead channel 1 jack. 3. -
Page 102: Trace Divisions
Scope Multimeter Optional Settings 9.7.2 Trace Divisions 3— Vertical Scale Menu 4— Vertical Scale Icon Navigation Figure 9-28 Home Screen: Tools > Settings> Configure Scope / Meter > Trace Divisions Trace Full Scale - changes the dropdown vertical scale menu selections to full scale mode, which represents the selected unit of measurement over the entire (full) scale. -
Page 103: Display Settings
Scope Multimeter Optional Settings 9.7.3 Display Settings Trace Per Division - changes the dropdown vertical scale menu selections to ##/div mode, which in turn changes the vertical scale to represent ## by division. Navigation ## - represents (variable) what is being measured (voltage, amperage, pressure etc.) Home Screen: Tools >... -
Page 104: Capturing Data
Scope Multimeter Capturing Data Capturing Data Display Full Scale - displays the value of the entire (full) scale Example (Figure 9-32): If the vertical scale is set to 1V, the value displayed is The primary purpose and advantage of the Lab Scope and Graphing Multimeter, is their ability to capture, store and playback data (test signals). -
Page 105: Capturing Data (Capture Mode)
Scope Multimeter Capturing Data As every testing situation is different, the following is provided only as a guide when capturing data to provide the best flexibility when reviewing the data to find events. In most situations if you start by using a sweep setting that is best suited for viewing the waveform “live”, or at a setting that provides the best detail to the naked eye, this will allow you to either see the event you are looking for “live, or allow you to use the zoom feature (in Review Mode) to zoom out (2, 8, 32X etc.) and then search... -
Page 106: Pausing Data
Scope Multimeter Capturing Data 9.8.3 Pausing Data For control icon descriptions, also see Scope Multimeter Control Icons on page 79. Data continuously stores in buffer memory until the Pause icon is selected. Selecting the Pause icon (Figure 9-35), allows you to temporarily pause the data (input test signal) to review it in detail. - Page 107 Scope Multimeter Capturing Data Using Zoom NOTE For control icon descriptions, see Scope Multimeter Control Icons on page 79. As there is a direct relationship between the length of time the data is captured in, and the resultant level of detail you will have when reviewing it, review the The zoom function is only available in Review Mode, and can be an invaluable tool information in Capturing Data...
- Page 108 Scope Multimeter Capturing Data NOTE To quickly identify a glitch in a pattern, it may be easier to initially view the waveform at a higher magnification level (e.g. 256X or "Max") to display the entire captured waveform, find the area of interest and then lower the zoom level to 8X or 2X to review that area in detail.
-
Page 109: Saving Data Files
Scope Multimeter Saving Data Files 3 - Zoom back in (this example is at 8X) to view more detail (Figure 9-42) in the area Zoom Example where the cursor was placed by the glitch. While monitoring a MAF (Mass Air Flow Sensor) signal, the waveform displays normally. -
Page 110: Saving Screens
Scope Multimeter Saving Screens The toolbar control icons are described in page 61 for additional information. If you have already narrowed down the system Scope Multimeter Control Icons page 79 and and/or component to test, ID the vehicle within the Guided Component Test Icon Reference Table on page 6. -
Page 111: Using Known Good Waveforms
Scope Multimeter General Reference 9.11.2 Using Known Good Waveforms For the initial setup, you may wish to turn other channel settings off (e.g. Peak, Filter, Invert, AC Coupling, Threshold etc.), as these may affect the signal display. In some cases captured waveforms may not provide enough information to Channel Settings on page 85. - Page 112 Examples may not be available for all vehicles or components and are Figure 9-45 SureTrack - Waveform examples supplied from various diagnostic tools. All examples are provided as reference only. For additional waveform reference information, visit the Snap-on Diagnostics forums to ask questions, and share information at: http://productforum.autorepairdata.com...
-
Page 113: Troubleshooting Signals
Use the shortest test leads possible. • Try different test leads, to verify the issue. Use the recommended snap-on • leads or probes available for the diagnostic tool or equivalent. Shielded test leads are recommended. -
Page 114: Units Of Measurement / Conversions
Scope Multimeter General Reference 9.11.4 Units of Measurement / Conversions Pressure Units (Symbol) / Description Equivalents Base Units 1 psi = 6894.757 Pa (Symbol) / Unit Prefix Typical Expressions (psi) pounds per square inch 1 psi = 0.06894757 bar 1 psi = 2.036021 inHg (µ) micro 0.000001 or 10 or 1/1,000,000... - Page 115 Scope Multimeter General Reference Temperature Units (Symbol) / Description Conversions (°C) degree Celsius °C = 0.556 x (°F - 32) (°F) degree Fahrenheit °F = (1.8 x °C) + 32 Time Units (Symbol) / Description Equivalents (µs) microsecond 1 µs = 0.000001 of a second (ms) millisecond 1 ms = 0.001 of a second (s) second...
-
Page 116: Glossary Of Common Terms
Scope Multimeter General Reference 9.11.5 Glossary of Common Terms Term / Abbreviation Description Used to represent a numerical value denoting the actual Term / Abbreviation Description measured air/fuel ratio with respect to the ideal air/fuel ratio at stoichiometry. Lambda equals one (1) when the actual air/fuel Alternating Current - electrical current that switches polarity at Lambda (l) ratio is equal to the theoretical (stoichiometric) air/fuel ratio of... - Page 117 Scope Multimeter General Reference Term / Abbreviation Description How often the captured data is (updated) displayed on the Screen Update Rate screen. Detectable voltage, current, or magnetic field, by which specific Signal information is transmitted in an electronic circuit or system. A square or rectangular waveform (digital) which alternately Square Wave switches high to low (on/off) for specific lengths of time, that has...
-
Page 118: Section 10: Training And Support
For diagnostic tool training videos and information see the product website. See on page vii for website Customer Support / Links links. SETTING UP WI-FI ON YOUR TRITON-D10 10.1 Training and Support Navigation Home Screen: Training and Support The back arrow on the left side of the upper toolbar 10-1), or the “N”... -
Page 119: Setting Up The Snap-On Cloud
Report) Watch a short video tutorial on the basic setup and authorization steps required to get started using the Snap-on Cloud. For additional information see, Snap-on Cloud Watch a short video tutorial on how to share a pre/post scan report using your on page 13. -
Page 120: Section 11: Obd-Ii/Eobd
OBD-II/EOBD Section 11 Start Communication establishes communication with the vehicle, and then The OBD-II/EOBD function allows you to access “generic” displays available OBD-II /EOBD services (Figure 11-1). Menu options are OBD-II/EOBD data, and data for some OBD-II/EOBD vehicles that described in the following sections. are not included in the Scanner function databases. - Page 121 OBD-II/EOBD OBD Direct Readiness Monitors MIL Status Navigation Navigation Home Screen: OBD-II/EOBD > OBD Direct > OBD Diagnose > Home Screen: OBD-II/EOBD > OBD Direct > OBD Diagnose > Start Communication > Readiness Monitors Start Communication > MIL Status The readiness monitoring system is an OBD-II /EOBD control system that runs Mil Status checks the ECM commanded state on/off of the malfunction indicator continuous and periodic integrity tests to check the status of emission-related lamp.
- Page 122 OBD-II/EOBD OBD Direct ($01) Display Current Data ($03) Display Trouble Codes Navigation Navigation Home Screen: OBD-II/EOBD > OBD Direct > OBD Diagnose > Home Screen: OBD-II/EOBD > OBD Direct > OBD Diagnose > Start Communication > ($01) Display Current Data Start Communication >...
- Page 123 OBD-II/EOBD OBD Direct ($04) Clear Emissions Related Data ($07) DTCs Detected During Last Drive Navigation Navigation Home Screen: OBD-II/EOBD >OBD Direct > OBD Diagnose > Home Screen: OBD-II/EOBD > OBD Direct > OBD Diagnose > Start Communication > ($04) Clear Emissions Related Data Start Communication >...
-
Page 124: Connector Information
OBD-II/EOBD OBD Direct 11.1.2 Connector Information ($09) Read Vehicle Identification Navigation Navigation Home Screen: OBD-II/EOBD > OBD Direct > OBD Diagnose > Home Screen: OBD-II/EOBD > OBD Direct > OBD Diagnose > Start Communication > ($09) Read Vehicle Identification Connector Information This service displays vehicle-specific information, such as the vehicle identification This function provides access to vehicle diagnostic connector locations for most number (VIN), the calibration identification, and the calibration verification number... -
Page 125: Obd Training Mode
OBD-II/EOBD OBD Training Mode 11.3 OBD-II Health Check Navigation Home Screen: OBD-II/EOBD > OBD Health Check OBD-II Health Check allows you to quickly check readiness monitors, view emissions-related diagnostic trouble codes (DTCs) and more (Figure 11-6). Figure 11-5 11.2 OBD Training Mode Navigation Figure 11-6 Home Screen:... -
Page 126: Readiness Monitors
OBD-II/EOBD OBD-II Health Check 11.3.3 Readiness Monitors Navigation Home Screen: OBD-II/EOBD > OBD Health Check > Readiness Monitors Readiness Monitors on page 114. 11.3.4 MIL Status Navigation Home Screen: OBD-II/EOBD > OBD Health Check > MIL Status MIL Status on page 114. -
Page 127: Section 12: Previous Vehicles And Data
Previous Vehicles and Data Section 12 The Previous Vehicles and Data function allows you to reactivate previously identified vehicles for retesting, and access saved data files. 12.1 Vehicle History Navigation Home Screen: Previous Vehicles and Data > Vehicle History The last twenty-five vehicles identified are saved and available for retesting . -
Page 128: Saved Data
Exit vehicle communication before opening data files. Select a file to view it. The Transfer the files to ShopStream Connect, or – most recent files are listed first. Print from the Snap-on Cloud (if connected and authorized) – All Saved Data - Lists all saved files (Figure •... -
Page 129: Section 13: Tools
Tools Section 13 13.1 Tools Main Menu The Tools function allows you to configure diagnostic tool settings to your preferences. Navigation Home Screen: Tools Quick Links The main Tools menu includes multiple sub-menus and settings, which are Tools Main Menu page 122 •... -
Page 130: Connect-To-Pc (File Transfer)
Home Screen: Tools > Software Updates Get Connected displays the diagnostic tool serial number, PIN and Code needed for Snap-on Cloud registration. See on page 13 for instructions. Snap-on Cloud Software Updates allows you to directly install software updates for your diagnostic tool. -
Page 131: Settings
Tools Settings 13.7 Settings Night Theme (black screen background) • Navigation High Contrast Toolbar Home Screen: Tools > Settings Navigation Home Screen: Tools > Settings > System Settings > Display > High Contrast Settings provides the following sub-menus: Toolbar • System Settings (Display, Date &... -
Page 132: Configure Scanner
Tools Settings 13.7.2 Configure Scanner (DD_MM_YYYY)—Day, Month, Year • (YYYY_MM_DD)—Year, Month, Day • Navigation Clock Settings Home Screen: Tools > Settings > System Settings > Display > Brightness Navigation Brightness allows you to adjust brightness of the display back lighting. Home Screen: Tools >... -
Page 133: Configure Scope / Meter
Tools Settings 13.7.3 Configure Scope / Meter 13.7.5 Configure Units Navigation Navigation Home Screen: Tools > Settings > Configure Scope / Meter Home Screen: Tools > Settings > Configure Units The available menu options allow you to configure certain characteristics of the Configure Units allows you to display either US customary or metric units of display screen to your preference when using the Scope / Meter, see measure. -
Page 134: Section 14: Wi-Fi Connection / Troubleshooting
129 A Wi-Fi connection is required to use various diagnostic tool features, (e.g. Fast-Track® Intelligent Diagnostics and the Snap-on Cloud). It is No bars - No signal / out of range. recommended that you keep Wi-Fi turned on and connected during operation to ensure you have access to the latest diagnostic information and updates. -
Page 135: Add Network Advanced (Connecting To A Hidden Network)
Wi-Fi performance varies depending on your wireless network equipment and ISP. 3. Enter the required password and press Next, or select Connect to continue. 4. Select OK to connect, or Forget to cancel. The Snap-on Cloud registration information is displayed. For Snap-on Cloud – registration information see Snap-on Cloud on page 13. -
Page 136: Wi-Fi Testing
There may be some situations that require your time for router connection troubleshooting and/or additional consultation and equipment. Snap-on Incorporated is not responsible for any costs incurred for any additional equipment, labor or consultation charges or any other costs that may result from correcting non-connectivity issues with this device. - Page 137 Wi-Fi Connection / Troubleshooting Wi-Fi Troubleshooting and Status Messages Check Router Settings 5. Turn on the diagnostic tool and connect to the desired Wi-Fi network, see Turning Wi-Fi On and Connecting to a Network on page 127. Verify the following router settings BEFORE you begin troubleshooting a non- connectivity or “No Connection”...
- Page 138 Wi-Fi Connection / Troubleshooting Wi-Fi Troubleshooting and Status Messages Connection Tests - Troubleshooting Possible Cause Failed Test (Displayed Tip Corrective Action / Checks Message*) Wi-Fi radio not responding and/or will not turn on Wi-Fi radio not Device Contact Customer Support for assistance. responding and/or will not initialize Missing or corrupt...
-
Page 139: Legal Information
License Agreement may be provided with the diagnostic tool, and is available at: carefully paying extra attention to the safety warnings and precautions. https://eula.snapon.com/diagnostics Patent Information For a listing of Snap-on products that are protected by patents in the United States and elsewhere, visit: https://patents.snapon.com ZEEMS344A Rev.A NA 19/A/21... - Page 140 Legal Information FCC Compliance Statement FCC Compliance Statement This equipment has been tested and found to comply with the limits for a Class B digital device, pursuant to part 15 of the FCC rules. These limits are designed to provide reasonable protection against harmful interference in a residential installation.
Need help?
Do you have a question about the TRITON-D10 and is the answer not in the manual?
Questions and answers