Table of Contents
Advertisement
Advertisement
Table of Contents

Related Manuals for Unico UV-2802


Summary of Contents for Unico UV-2802
-
Page 2: Table Of Contents
Contents Safety … … … .… … … … … … … … … … … … … … … … … … … … … … … … … . G e n e r a l … … … … … … … … … … … … … … … … … … … … … … … … … … … . E l e c t r i c a l …... -
Page 3: Safety
Whenever it is likely that the protection has been impaired, the apparatus shall be made inoperative and be secured against any unintended operation. NEVER touch or handle the power supply on UNICO UV-2802 due to the high voltage. The protection is likely to be impaired if, for example, the apparatus Ÿ... -
Page 4: Performance
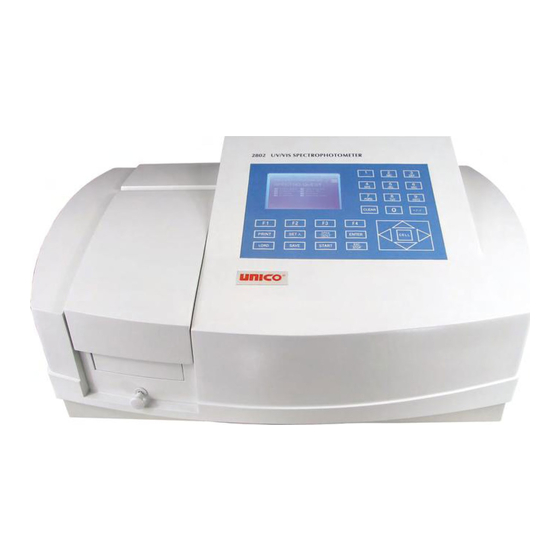
Introduction: The UNICO UV-2802 model spectrophotometer (Fig 1) is a single beam, general purpose instrument designed to meet the needs of the Conventional Laboratory, The UNICO UV-2802 model spectrophotometer is ideal for various... -
Page 5: Working Principle
Fig1 Working Principle: The spectrophotometer consists of five parts: 1) Halogen or deuterium lamps to supply the light; 2) A Monochromator to isolate the wavelength of interest and eliminate the unwanted second order radiation; 3) A sample compartment to accommodate the sample solution; 4) A detector to receive the transmitted light and convert it to an electrical signal;... -
Page 6: Specifications
Packing List Description Quantity Ÿ Spectrophotometer............Ÿ Mains Lead..............Ÿ Cuvettes................Set of 4, glass ..............Set of 2, quartz Ÿ Dust Cover............... Ÿ Manual ................Specifications: Ÿ Wavelength Range: 190-1100nm Ÿ Spectral Bandpass: Ÿ ±0.8nm Wavelength Accuracy: Ÿ Wavelength Repeatability: ±0.05nm Ÿ... -
Page 7: Operation
Operation: Prepare the spectrophotometer Fig 3 is the control panel. User can perform all operations by pressing the keys and all the results and operation information are displayed on the LCD. Fig 3 Description of keys Ÿ 【LOAD】 Load data or curve saved before; 【SAVE】 ... -
Page 8: Turn On Spectrophotometer
character; 【∧】,【∨】 Change “ y” scale; Search peak after scan; Scroll items for selecting; Change capital/small letter last typed in; Browse the items for selection; 【CELL】 Set cell position. Ÿ Turn on spectrophotometer Turn on spectrophotometer by pressing the Power Switch (IO)(see Fig1). The instrument starts to initiate and the steps are as below: 1.The instrument will check memory first (Fig 4), please wait or press any key to skip this step ,after positioning filter, auto-cell changer(if installed) and... -
Page 9: Basic Operation
Search 656.1nm ..√ Check Energy ..√ United Products & Instruments Inc. Fig 6 WL : 656.1nm 16:31: 35 UNICO SPECTROPHOTOMETER Cell SPECTRO-QUEST Basic mode DNA/Protein Multi WL Quantitative WL scan... - Page 10 WL : 656.1nm Energy Low. . . Blanking Cell Max E F1:Unit F2:Mode F Factor Standard Fig 8 NOTE: 1.Blanking is automatic after a wavelength change DO NOT OPEN SAMPLE COMPARTMENT LID DURING BLANKING. 2.The dark current don’ t be taken after power on,if you bypass the calibrating system.
- Page 11 ² Use numeric keypad to input wavelength (Fig 11). WL : 656.1nm 12: 35: 27 0.001 Abs Cell Max E Please input wl: 450 Fig 11 ² Press 【ENTER】 to change the wavelength from 656.1nm to 450.0nm,and then blank; after blanking, the screen displays as Fig WL : 450.0nm 12: 35: 27...
- Page 12 WL : 680.0nm 12: 35: 27 Cell From: 200.0 680.0 Step: 1.0nm XScale YScale 200.0 Wavelength (nm) 680.0 F1:Setup F2:Mode F3:Search Fig 13 WL : 680.0nm 12: 35: 27 Cell From: 200.0 680.0 Step: 1.0nm XScale YScale 200.0 Wavelength (nm) 680.0 F1:Setup F2:Mode F3:Search Fig 14...
- Page 13 Wipe the cuvette with tissue to remove the fingerprints and droplets of liquid. Ÿ Fit the blank cuvette into the 4-cell linear changer and place the cuvette in the slot nearest you. For the UNICO UV-2802, push the changer so that...
-
Page 14: Analyse Sample
the cuvette is in the light path (Push the rod in). Close the lid. Analyze Sample For different user requirements, we have provided different test methods. Basic Mode Push the blank cuvette into the light path. In main menu (Fig7),press【1】 to enter “... - Page 15 1. Abs mode Push the blank cuvette into the light path.Press 【F2】 to select Abs mode ,Press 【0Abs/100%T】 for Blanking , and then Push the sample into lightpath to take reading(Fig 20) 2. T% mode The operation is the same as Abs test mode but pressing【F2】 to select T% mode .
-
Page 16: Quantitative
WL : 656.1nm 12: 35: 27 0.000 mg/ml Cell Max E Please input F factor: 4 Fig 23 WL : 656.1nm 12: 35: 27 0.000 mg/ml Cell F=4.000 Max E F1:Unit F2:Mode F3:F Factor F4:Standard Fig 24 J Print Test Report Press 【PRINT】to print test results (Fig 25). - Page 17 J How to operation 1. Press 【F1】to select unit of concentration (Fig 27). WL : 700.0nm Abs: 12: 35: 27 Quantitative Test Conc. (mg/L) Cell WL(nm) 700.0 Search Scroll C=1.000*A^1 r=1.000 Please select unit: g/L Fig 27 2 Press 【SETλ】 to select correction methods and enter the wavelength.
- Page 18 WL : 700.0nm Abs: 12: 35: 27 Calibration table Conc. (mg/L) Cell WL(nm) 700.0 C=1.000*A^1 r=1.000 Input K1=1.033 Fig 29A The constants to be entered are depending on which fitting method selected.The table below lists the their relation: Fitting Method Fitting Equation constants linear fit through zero K1, r*...
- Page 19 3.3.2 Push the blank cuvette into the light path, press 【0Abs/%100T】 ,the instrument will step to the wavelength and blank. See Fig 32. WL : 700.0nm Abs: B l a n k … . … … . Calibration table Conc. (mg/L) Cell 2.000 WL(nm)
- Page 20 WL : 656.1nm Abs: 12: 35: 27 Cell -1.0 Press (ESC) to return . . . Fig 35 square fit WL : 656.1nm Abs: 12: 35: 27 Cell -1.0 Press (ESC) to return . . . Fig 36 cubic fit WL : 656.1nm Abs:...
-
Page 21: Wl Scan
4.1 Push the blank cuvette into the light path and press 【0Abs/100%T】 for blanking. 4.2 Pull the sample cuvette into the light path, press the key 【START】, the results will be displayed on the screen (Fig 38). WL : 700.0nm Abs: 12: 35: 27 Quantitative Test... - Page 22 J Scan sample 1. Press 【F1】 to setup, input the start wavelength, and end wavelength by pressing the numeric keypad (Fig 42). Note: The UV-2802 scans from high to low wavelength. Browse and select the items of scan step and scan speed by pressing 【∧】or【∨】.
- Page 23 scanning; WL : 520.0nm Scan to 200.0nm Cell From: 200.0 680.0 Step: 1.0nm XScale YScale 200.0 Wavelength (nm) 680.0 Press (ESC) to stop . . . Fig 44 4. Pull the sample cuvette into the light path, press 【START】 to scan the sample(Fig 45) 【ESC/STOP】 to stop scanning.
- Page 24 WL : 680.0nm 12: 35: 27 Cell From: 200.0 680.0 Step: 1.0nm XScale YScale 200.0 Wavelength (nm) 680.0 Min X:300 Fig47 WL : 680.0nm 12: 35: 27 Cell From: 200.0 680.0 Step: 1.0nm XScale YScale 300.0 Wavelength (nm) 500.0 F1:Setup F2:Mode F3:Search Fig 48 Press 【F3】 to search the Abs/%T value of the scan.
- Page 25 WL : 680.0nm 12: 35: 27 Cell From: 200.0 680.0 Step: 1.0nm Point Peak 200.0 Wavelength (nm) 680.0 Please input peak height: 0.100 Fig 50 WL : 452.0nm %T:22.38 12: 35: 27 Cell From: 200.0 680.0 Step: 1.0nm Point Peak 200.0 Wavelength (nm) 680.0...
-
Page 26: Kinetics
Fig 52 Kinetics Press【4】in main menu for “ Kinetics” (Fig 53). 【ESC/STOP】to exit. To load a previous kinetics result, press (LOAD) and select a previously stored result (.kin) - Page 27 Tim : 60s Abs: 12: 35: 27 Cell Total 180s Inteval 1.0s XScale YScale Time(s) F1:Setup F2:Mode F3:Process F4:Search Fig 53 J Test 1. Press 【F1】 to set “ Total Time” , ” Delay Time” , ” Time interval” , and input the value by pressing the numeric keypad (Fig 54).
- Page 28 Tim : 180s Abs: 12: 35: 27 Cell Total 180s Inteval 1.0s XScale YScale Time(s) F1:Setup F2:Mode F3:Process F4:Search Fig 56 5. Press 【F3】to process the data, and e nter “ Begin Time” , ” End Time” and ” Factor” (Fig 57) and the value in I.U. will be calculated and displayed (Fig 58).
-
Page 29: Dna/Protein
J Save Curve Press the key 【SAVE】 to save curve. Note: Load/Save requires the first kinetics display page Fig. 56. Press ESC if in Search to return to the required page. J Print Test Report Press the key 【PRINT】to print the curve you have loaded or scanned (Fig 59). Fig 59 DNA/Protein Press【5】in main menu for “... - Page 30 WL : 900.0nm 12: 35: 27 DNA/Protein measurement Items Result Unit Cell WL(nm) 260.0 280.0 320.0 Search Scroll F1:Coeff F2:Mode F3:Unit F4:Default Fig 60 To load previous DNA results, press (LOAD) and select a previously stored result (.dna) J Test 1.
- Page 31 WL : 900.0nm 12: 35: 27 DNA/Protein measurement Items Result Unit Cell WL(nm) 260.0 280.0 Search Scroll With reference: Fig 63 3. Press 【F3】to select the unit of concentration (Fig 64). WL : 900.0nm 12: 35: 27 DNA/Protein measurement Items Result Unit Cell...
-
Page 32: Multi Wavelength
WL : 900.0nm Abs: 12: 35: 27 DNA/Protein measurement Items Result Unit Cell 2.947 WL(nm) 2.842 260.0 Aref 0.638 280.0 320.0 C-DNA 65.91 mg/mL C-Pro 1672 mg/mL Ratio 1.048 Search Scroll Search sample:3 Fig 66 J Recall the default Press the key【F4】to recall the default of the f1-f4. J Save Data Press the key 【SAVE】 to save data. - Page 33 J Test 1. Press 【F1】 to setup a group of wavelengths for testing by pressing the numeric keypad followed by 【 ENTER】 . (´) or (` ) to modify the inputted data Fig. 69. Press【ESC/STOP】to finish setup and exit. Note: It is recommended to enter the highest wavelength first. WL : 900.0nm Abs:...
-
Page 34: S E T T I N G A N D C A L I B R A T I O
WL : 500.0nm Abs: 12: 35: 27 Multi Wavelength Test WL(nm) Cell 500.0 0.87 3 WL 400.0 0.42 300.0 0.81 Search Scroll F1:WL setup F2:Mode Fig 71 5. If there is more than one sample, repeat step 4 for the next sample. Note: When the test has finished, the wavelength will go to the first 6. - Page 35 WL : 656.1nm 08: 04: 35 UNICO SPECTROPHOTOMETER Cell SPECTRO-QUEST WL Reset Accu Validity Printer Validity Lamp Connect to PC Clock Beeper on/off Dark current Delete entire saved files Restore default United Products & Instruments INC. Fig 73 J WL Reset Press【1】to reset wavelength (Fig74).
- Page 36 WL : 656.1nm 08: 04: 35 UNICO SPECTROPHOTOMETER Cell SPECTRO-QUEST Reset printer Select print port Select printer Print report Select the print port: Fig 76 Press【3】 in Fig 75 to select printer (HP PCL (1 colour cartridge), PCL (black mode), Epson ESC/P or Epson/P2 or above, Fig77).
- Page 37 WL : 656.1nm 08: 04: 35 UNICO SPECTROPHOTOMETER SPECTRO-QUEST Cell Switch D2: Reset D2 lamp usage time Switch W: Reset W lamp usage time Switch point United Products & Instruments INC. Fig 79 1. Press【1】in Fig 79 to switch on/off D2. Fig 80.
- Page 38 WL : 656.1nm 08: 04: 35 UNICO SPECTROPHOTOMETER Cell SPECTRO-QUEST Switch D2: Reset D2 lamp usage time Switch W: Reset W lamp usage time Switch point United Products & Instruments INC. Fig 82 4. Press 【4】in Fig 79 to reset usage of W (Fig 83). Press 【∧】or【∨】...
- Page 39 WL : 656.1nm 08: 04: 35 UNICO SPECTROPHOTOMETER Cell SPECTRO-QUEST Set Time Set Date Show Time mode Show Date mode United Products & Instruments INC. Fig 85 1. Press 【1】in Fig 85 to modify time by pressing the numeric keypad (Fig 86).
- Page 40 WL : 656.1nm Get dark current UNICO SPECTROPHOTOMETER Cell SPECTRO-QUEST WL Reset Accu Validity Validity Printer Lamp Connect to PC Clock Beeper on/off Dark current Delete entire saved files Restore default United Products & Instruments INC. Fig 88 J Accu Validity Press 【4】In Fig73 to do accu validity (Fig 89). 【ESC/STOP】to exit.
- Page 41 WL : 900.0nm 12: 35: 27 Photometric Validity Test WL(nm) %T(Std) Result Cell 440.0 9.28 546.0 0.000 635.0 0.000 Select Input the standard:0 Fig 91 Press 【F2】to select test mode (Abs or %T, Fig 92). WL : 900.0nm 12: 35: 27 Photometric Validity Test WL(nm) %T(Std)
- Page 42 WL : 900.0nm 12: 35: 27 Photometric Validity Test WL(nm) %T(Std) Result Cell 500.0 9.28 9.28 pass 600.0 8.45 8.45 pass 700.0 5.66 Standard Mode Tolerance Fig 94 J WL Validity Press【7】in Fig 73 to WL validity (Fig 95). 【ESC/STOP】to exit. WL : 900.0nm Abs:...
- Page 43 WL : 900.0nm 12: 35: 27 Wavelength Validity Test WL(nm) Peak(nm) Result Cell 241.4 361.0 417.0 537.6 641.4 807.4 Please select mode: Fig 97 3. Press 【F3】 to set tolerance (Fig 98). Input the value by pressing the numeric keypad. WL : 900.0nm 12: 35: 27...
-
Page 44: Defined Tests
PC.The screen displays as Fig 100A. Press【ESC/STOP】to exit. WL : 656.1nm 08: 04: 35 UNICO SPECTROPHOTOMETER SPECTRO-QUEST Connecting to computer. . . United Products & Instruments INC. Fig 100 WL : 656.1nm 08: 04: 35 UNICO SPECTROPHOTOMETER SPECTRO-QUEST Controlled by PC . . . - Page 45 1. Press 【F1】 to setup method (Fig 102). There are 8 items (1 ref. 1 sample, 1 ref. 2 samples, 1 ref. 3 samples, 1 ref. 4 samples, 1 ref. 5 samples, 1 ref. 6 samples, 1 ref. 7 samples, N refs. N samples) for selecting.
- Page 46 7. Press 【 START】 ,the screen display as Fig105,the“ Place 1 group… ” appear on the right of top line, Press【0Abs/100%T】, the 8 references are taken automatically and the screen change to Fig 106. WL : 900.0nm Place 1st group . . 0.000 Abs Cell 1 Ref,...
- Page 47 Appendix A DNA/Protein Test Algorithm Wavelength(s) Parameters Method Calculations Displayed Test Name Units DNA MEASUREMENT =62.9 DNA: Absorbance 260nm difference μg/ml DNA/Protein concentration: =36.0 280nm (260,280) =1552 Protein:μ 320nm Protein Concentration =757.3 (optional) g/ml concentration DNA purity Absorbance =49.1 260nm difference concentration: =3.48...
- Page 48 Appendix B Lamp Replacement TO REPLACE DEUTERIUM LAMP 1. Turn off and unplug the instrument (VERY IMPORTANT: HIGH VOLTAGE). 2. Remove the cuvette holder rod by unscrewing the rod counterclockwise. 3. Remove the all screws around the sides of the spectrophotometer. See Fig A1 Fig A1 4.
- Page 49 Fig A2 HINT: If it is necessary to remove the cover from the right side of the instrument, carefully remove 3 connectors (CZ6, CZ4 and J3)on PCB marked SST8.417.100 . Be sure to reconnect after replacing the lamp! Fig A3 Fig A3 5.
- Page 50 place the protective cover to the side. See Fig A4 Fig A4 6. Disconnecting the connector J7 on the PCB marked SST8.411.128. Unscrew the screw that holds the lamp bracket to the instrument base. Pull the entire lamp and lamp holder assembly out. See Fig...
- Page 51 Fig A5 7. Replace the pre-aligned lamp with a lamp (Fig A6) provided by UNICOor an authorized UNICOService Provider . This comes pre-assembled with lamp socket. Fig A6 CAUTION: THE LAMP MAY BE HOT! TAKE PRECAUTIONS TO PREVENT POSSIBLE BURNS. 8.
- Page 52 Check the lamp alignment Fig. A7. If the image is not covering the slit, the lamp alignment needs adjustment. This requires running the UV-2802 without the covers, with high voltages accessible, and so should only be performed by a suitably qualified engineer.
- Page 53 Check the lamp alignment Fig. A9. If the image is not covering the slit, the lamp alignment needs adjustment. This requires running the UV-2802 without the covers, with high voltages accessible, and so should only be performed by a suitably qualified engineer.
- Page 54 Focus on the slit Fig A9 CAUTION: DO NOT HANDLE THE LAMP WITH BARE FINGERS. USE TISSUE OR CLOTH WHEN HANDLING LAMP. The oil from your fingers can cause the lamp to burn out prematurely. 5. Re-fit all the screws around the sides of the spectrophotometer, Fig. 6.
- Page 55 Appendix C A number of correction techniques can be used to eliminate or reduce interference errors. In general, if the source of the error is known and is consistent from sample to sample, the error can be eliminated. On the other hand, if the source is unknown and varies from sample to sample, the error can be reduced but not eliminated. Correction techniques can always require data from at least two wavelengths. The more sophisticated correction techniques require multiwavelength or spectral data. A.1 Isoabsorbance When a known interfering component with a known spectrum is present, the error introduced by this component at the analytical wavelength for the target analyte can be eliminated by selecting a reference wavelength at which the interfering compound exhibits the same absorbance as it does at the analytical wavelength. The absorbance at this reference wavelength is subtracted from the absorbance at the analytical wavelength, as shown in Figure A1.The residual absorbance is the true absorbance of the analyte. This technique is less reliable when the spectra of the analyte and of the interferent are highly similar. Moreover, it can correct for only one interference Fig A1 Isoabsorbance correction A.2 Three-point correction The three-point, or Morton-Stubbs correction uses two reference wavelengths, usually those on either side of the analytical wavelength. ...
- Page 56 The background interfering absorbance at the analytical wavelength is then estimated using linear interpolation (see Figure A2).This method represents an improvement over the single-wavelength reference technique because it corrects for any background absorbance that exhibits a linear relationship to the wavelength. In many cases, if the wavelength range is narrow, it will be a reasonable correction for non-linear background absorbances such as that resulting from . scattering of from a complex matrix Fig A2...
Need help?
Do you have a question about the UV-2802 and is the answer not in the manual?
Questions and answers