Table of Contents
Advertisement
Quick Links
Advertisement
Table of Contents

Related Manuals for R&S ESR


Summary of Contents for R&S ESR
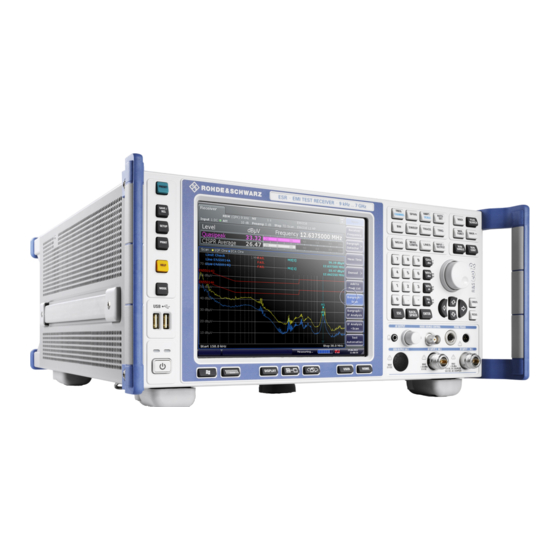
- Page 1 ® R&S EMI Test Receiver Getting Started (=@Ua2) 1316374902 Version 09...
- Page 2 This manual describes the following R&S®ESR models with firmware version 3.36 and higher: ● R&S ® ESR3 ● R&S ® ESR7 ● R&S ® ESR26 © 2021 Rohde & Schwarz GmbH & Co. KG Mühldorfstr. 15, 81671 München, Germany Phone: +49 89 41 29 - 0 Email: info@rohde-schwarz.com...
-
Page 3: Table Of Contents
® Contents R&S Contents 1 Safety and Regulatory Information........5 1.1 Safety Instructions................5 1.2 Warning Messages in the Documentation........10 1.3 Korea certification class A..............11 2 Documentation Overview............12 2.1 Getting Started Manual...............12 2.2 User Manuals and Help..............12 2.3 Service Manual..................13 2.4 Instrument Security Procedures............ - Page 4 Contents R&S 5.4 Setting up the R&S ESR..............30 5.5 Placing the R&S ESR on a Bench Top..........31 5.6 Mounting the R&S ESR in a Rack............32 5.7 Connecting the AC Power..............32 5.8 Connecting to a DC Power Source (Optional)........33 5.9 Switching the Instrument On and Off..........
-
Page 5: Safety And Regulatory Information
® Safety and Regulatory Information R&S Safety Instructions Safety and Regulatory Information The product documentation helps you use the product safely and efficiently. Fol- low the instructions provided here and in the following chapters. Intended use The product is intended for the development, production and verification of elec- tronic components and devices in industrial, administrative, and laboratory envi- ronments. - Page 6 ® Safety and Regulatory Information R&S Safety Instructions Never open the casing of the product. Only service personnel authorized by Rohde & Schwarz are allowed to repair the product. If any part of the product is damaged or broken, stop using the product. Contact Rohde & Schwarz customer service at http://www.customersupport.rohde-schwarz.com.
- Page 7 ® Safety and Regulatory Information R&S Safety Instructions uct is moved without lifting it. The foldable feet are designed to carry the weight of the product, but not an extra load. If stacking is possible, keep in mind that a stack of products can fall over and cause injury.
- Page 8 ® Safety and Regulatory Information R&S Safety Instructions these requirements, provide an easily accessible circuit breaker at the system level. Using laser products Lasers are classified according to their potential risk. If exposure to the laser beam is possible, the product is labeled as shown in the table explaining the safety labels.
- Page 9 ® Safety and Regulatory Information R&S Safety Instructions ● Only use the appropriate Rohde & Schwarz charger to charge the batteries. If the batteries are improperly charged, there is a risk of explosion. For charging and discharging temperature ranges, see the product documentation. ●...
-
Page 10: Warning Messages In The Documentation
® Safety and Regulatory Information R&S Warning Messages in the Documentation Electrical hazard Indicates live parts. Risk of electric shock, fire, personal injury or even death. Hot surface Do not touch. Risk of skin burns. Risk of fire. Protective conductor terminal Connect this terminal to a grounded external conductor or to protective ground. -
Page 11: Korea Certification Class A
® Safety and Regulatory Information R&S Korea certification class A Korea certification class A 이 기기는 업무용(A급) 전자파 적합기기로서 판매자 또는 사용자는 이 점을 주의하 시기 바라며, 가정외의 지역에서 사용하는 것을 목적으로 합니다. Getting Started 1316.3749.02 ─ 09... -
Page 12: Documentation Overview
Basic information on operating the R&S ESR is not included. The contents of the user manuals are available as help in the R&S ESR. The help offers quick, context-sensitive access to the complete information for the base unit and the firmware applications. -
Page 13: Service Manual
Rohde & Schwarz information system (GLORIS): https://gloris.rohde-schwarz.com). Instrument Security Procedures Deals with security issues when working with the R&S ESR in secure areas. It is available for download on the Internet. Basic Safety Instructions Contains safety instructions, operating conditions and further important informa- tion. -
Page 14: Release Notes And Open Source Acknowledgment (Osa)
The open source acknowledgment document provides verbatim license texts of the used open source software. www.rohde-schwarz.com/firmware/esr Application Notes, Application Cards, White Papers, etc. These documents deal with special applications or background information on particular topics. -
Page 15: Conventions Used In The Documentation
® Conventions Used in the Documentation R&S Conventions for Procedure Descriptions Conventions Used in the Documentation Typographical Conventions The following text markers are used throughout this documentation: Convention Description "Graphical user interface All names of graphical user interface elements on the screen, elements"... -
Page 16: Notes On Screenshots
® Conventions Used in the Documentation R&S Notes on Screenshots Notes on Screenshots When describing the functions of the product, we use sample screenshots. These screenshots are meant to illustrate as many as possible of the provided functions and possible interdependencies between parameters. The shown values may not represent realistic usage scenarios. -
Page 17: Instrument Tour
The Front Panel Instrument Tour On the instrument tour, you can learn about the different control elements and connectors on the front and back panel of the R&S ESR. The Front Panel The front panel of the R&S ESR is shown in Figure 4-1. - Page 18 RF input 1 4.1.1 Touchscreen Display The touchscreen on the front panel of the R&S ESR displays the measurement results. Additionally, the screen display provides status and setting information and allows you to switch between various measurement tasks. The screen is touch-sensitive, offering an alternative means of user interaction for quick and easy handling of the instrument.
- Page 19 6 "Instrument Functions" of the Operating Manual. Table 4-1: Function keys Turns the instrument on and off. Restores the default configuration of the R&S ESR. Provides functionality to save, restore and manage instrument settings and other files.
- Page 20 ® Instrument Tour R&S The Front Panel Provides functionality for general instrument configuration, for example: ● to configure the display ● to set the date and time ● to establish a LAN connection Provides functionality to configure printers and hardcopys. Displays the online help.
- Page 21 ® Instrument Tour R&S The Front Panel SPAN Provides functionality to configure the frequency span. In the realtime application, the span is coupled to the RBW and restricted to 40 MHz. AMPT (SCALE) Provides functionality to configure amplitude or level characteristics, for example: ●...
- Page 22 ● the scan and final measurement (in Receiver mode) ● the AF demodulation (in Receiver mode) ● IF analysis (in Receiver mode with option R&S ESR-K56) ● the realtime spectrum (in Realtime mode) ● the spectrogram measurement (in Realtime mode) ●...
- Page 23 RF Input 50Ω The R&S ESR provides two RF inputs for connection of a device under test (DUT) to the R&S ESR. The DUT is connected to the RF Input via cable and an approriate connector (for example a male N connector).
-
Page 24: Rear Panel View
10 dB attenuator between the DUT and the tracking generator. Rear Panel View The rear panel of the R&S ESR is shown in Figure 4-3. Each element is descri- bed in more detail in the subsequent sections. - Page 25 32. 4.2.2 The LAN interface can be used to connect the R&S ESR to a local network for remote control, printouts and data transfer. The assignment of the RJ-45 connec- tor supports twisted-pair category 5 UTP/STP cables in a star configuration (UTP stands for unshielded twisted pair, and STP for shielded twisted pair).
- Page 26 You can control the trigger output with the functionality provided in the "In-/ Output" menu ([INPUT/OUTPUT] key). The trigger output also controls signals by the frequency mask trigger available in realtime mode (R&S ESR-K55). 4.2.9 IF / Video The female BNC connector can be used for various outputs: ●...
- Page 27 ® Instrument Tour R&S Rear Panel View You can select between IF and video output with the functionality provided in the "In-/Output" menu ([INPUT/OUTPUT] key). 4.2.10 USB The rear panel provides two female USB connectors to connect devices like an external keyboard or mouse.
- Page 28 4.2.13 Device ID The unique device identifier is provided as a barcode sticker on the rear panel of the R&S ESR. It consists of the device order number and a serial number. The serial number is used to define the default instrument name, which is: <Type><variant>-<serial_number>...
-
Page 29: Preparing For Use
Unpacking and Checking................29 ● Choosing the Operating Site................30 ● Setting up the R&S ESR................. 30 ● Placing the R&S ESR on a Bench Top............31 ● Mounting the R&S ESR in a Rack..............32 ● Connecting the AC Power................32 ●... -
Page 30: Choosing The Operating Site
® Preparing For Use R&S Setting up the R&S ESR 3. Using the delivery notes, check the equipment for completeness. 4. Check the equipment for damage. If the delivery is incomplete or equipment is damaged, contact Rohde & Schwarz. Choosing the Operating Site Specific operating conditions ensure proper operation and avoid damage to the product and connected devices. -
Page 31: Placing The R&S Esr On A Bench Top
® Preparing For Use R&S Placing the R&S ESR on a Bench Top Placing the R&S ESR on a Bench Top To place the product on a bench top 1. Place the product on a stable, flat and level surface. Ensure that the surface can support the weight of the product. -
Page 32: Mounting The R&S Esr In A Rack
2. Lift the R&S ESR to shelf height. 3. Grab the handles and push the R&S ESR onto the shelf until the rack brack- ets fit closely to the rack. 4. Tighten all screws in the rack brackets with a tightening torque of 1.2 Nm to secure the R&S ESR in the rack. -
Page 33: Connecting To A Dc Power Source (Optional)
Preparing For Use R&S Connecting to a DC Power Source (Optional) The R&S ESR can be used with different AC power voltages and adapts itself automatically to it. Refer to the datasheet for the requirements of voltage and fre- quency. -
Page 34: Switching The Instrument On And Off
Ready green To switch on the R&S ESR The R&S ESR is off but connected to power. 1. Set the switch on the power supply to position [I]. Chapter 4.2.1, "AC Power Supply Connection and Main Power Switch", on page 25. -
Page 35: Connecting To Lan
► Press the [Power] key. The operating system shuts down. The LED changes to orange. If the instrument temperature exceeds the limit specified in the data sheet, the R&S ESR automatically shuts down to protect the instrument from dam- age. To disconnect from power The R&S ESR is in the standby state. - Page 36 ● Changing IP addresses ● Exchanging hardware Errors can affect the entire network. Connect the R&S ESR to the LAN via the LAN interface on the rear panel of the instrument. Windows automatically detects the network connection and activates the required drivers.
-
Page 37: Connecting A Keyboard
6. In the configuration dialog box, you can switch from the internal monitor (lap- top icon) to the external monitor (monitor icon), or both (double monitor icon). If the external monitor is selected, the R&S ESR display is disabled. The screen content (measurement screen) formerly displayed on the R&S ESR is displayed on the external screen. -
Page 38: Windows Operating System
After the R&S ESR is started, the operating system boots and the instrument firm- ware is started automatically. - Page 39 "Start" menu. For details on the IECWIN tool, see the "Network and Remote Control" chapter of the R&S ESR user manual. All necessary system settings can be defined in the "Start > Settings" menu. For required settings, refer to the Microsoft Windows documentation and to the hardware description.
-
Page 40: Logging On
5.14 Logging On Microsoft Windows requires that users identify themselves by entering a user name and password in a login window. By default, the R&S ESR provides two user accounts: ● "NormalUser": a standard user account with limited access ● "Instrument": an administrator account with unrestricted access to the com- puter/domain Some administrative tasks require administrator rights (e.g. - Page 41 If you change the password that is used during auto-login, this function no longer works. Adapt the settings for the auto-login function first. 1. Select the "Windows" icon on the front panel to access the operating system of the R&S ESR (see also "To access the "Start" menu" on page 39).
-
Page 42: Checking The Supplied Options
® Preparing For Use R&S Performing a Self Alignment and a Self Test 5.15 Checking the Supplied Options The instrument may be equipped with both hardware and firmware options. In order to check whether the installed options correspond to the options indicated on the delivery note, proceed as follows. -
Page 43: Considerations For Test Setup
® Preparing For Use R&S Considerations for Test Setup Performing a self test The self test does not need to be repeated every time the instrument is switched on. It is only necessary when instrument malfunction is suspected. 1. Press the [SETUP] key. 2. - Page 44 Information on signal levels is provided in the data sheet and on the instrument, next to the connector. Keep the signal levels within the specified ranges to avoid damage to the R&S ESR and connected devices. Getting Started 1316.3749.02 ─ 09...
-
Page 45: Basic Operations
Information in the Diagram Area Basic Operations This chapter gives an overview on how to work with the R&S ESR. It describes what kind of information is displayed in the diagram area, how to operate the R&S ESR via the front panel keys and other interaction methods, and how to use the Online Help. - Page 46 6.1.1 Channel Display Using the R&S ESR you can handle several different measurement tasks (chan- nels) at the same time (although they can only be performed asynchronously). For each channel, a separate tab is displayed on the screen. In order to switch from one channel display to another, simply press the corresponding tab.
- Page 47 (with a finger or mouse pointer). The cor- responding (edit) dialog box is displayed where you can edit the setting. In receiver mode, the R&S ESR shows the following settings: Demod Active AF demodulation.
- Page 48 Step Current frequency step mode. no label Active transducer factor. no label Active LISN. In spectrum mode, the R&S ESR shows the following settings: Ref Level Reference level RF attenuation level. Ref Offset Reference level offset Sweep time that has been set.
- Page 49 In Receiver mode, the R&S ESR shows the following information. Trigger source (for details see trigger settings in the "TRIG" menu in the Operating manual) ●...
- Page 50 ® Basic Operations R&S Information in the Diagram Area Label Description A frequency offset ≠ 0 Hz is set. DC/AC An external DC or AC calibration signal is in use. Input source: digital I/Q (option R&S FSV-B17 only) 6.1.4 Diagram-specific and Trace Information Diagram-specific information, e.g.
- Page 51 ® Basic Operations R&S Information in the Diagram Area SAMPLE detector AVERAGE detector RMS detector QUASIPEAK detector CISPR Average detector RMS Average detector Trace Mode Sweep mode: Clrw CLEAR/WRITE MAX HOLD MIN HOLD AVERAGE (Lin/Log/Pwr) View VIEW Marker information in Diagram Grid The x and y axis positions of the last 2 markers or delta markers that were set, as well as their index, are displayed within the diagram grid, if available.
- Page 52 ® Basic Operations R&S Information in the Diagram Area Marker Information in Marker Table In addition to the marker information displayed within the diagram grid, a separate marker table may be displayed beneath the diagram. This table provides the fol- lowing information for all active markers: Type Marker type: N (normal), D (delta), T (temporary, internal), PWR...
-
Page 53: Means Of User Interaction
® Basic Operations R&S Means of User Interaction Hiding the status bar You can hide the status bar display, e.g. in order to enlarge the display area for the measurement results. 1. Press the [DISPLAY] key. 2. In the "Display Settings" dialog box, select "Status Bar State: Off". The status bar is no longer displayed. - Page 54 ® Basic Operations R&S Means of User Interaction ● Chapter 6.2.5, "Rotary Knob", on page 58 ● Chapter 6.2.6, "Arrow Keys, UNDO/REDO Keys", on page 58 ● Chapter 6.2.7, "Softkeys", on page 59 ● Chapter 6.2.9, "Dialog Boxes", on page 62 All tasks necessary to operate the instrument can be performed using this user interface.
- Page 55 ® Basic Operations R&S Means of User Interaction Remote: DISP:TBAR:STAT ON The following functions are available: Table 6-1: Standard Application Functions in the Toolbar Icon Description Opens the "Select Mode" menu (see Chapter 6.1.1, "Channel Display", on page 46) Opens an existing measurement (settings) file Stores the current measurement file Prints the current measurement screen Saves the current measurement screen as a file (screenshot)
- Page 56 ® Basic Operations R&S Means of User Interaction Deactivating and Activating the Touchscreen Function The touchscreen function can be deactivated, e.g. when the instrument is being used for demonstration purposes and tapping the screen should not provoke an action. 1. Press the [DISPLAY] key. 2.
- Page 57 ® Basic Operations R&S Means of User Interaction You can use the TAB key on the on-screen keyboard to move the focus from one field to another in dialog boxes. 6.2.4 Keypad The keypad is used to enter alphanumeric parameters. It contains the following keys: ●...
- Page 58 ® Basic Operations R&S Means of User Interaction – If no input field is currently active, the most recently entered value is undone, i.e. the previous value is retrieved. Thus, you can toggle between two values (e.g. spans). ● ENTER key –...
- Page 59 ® Basic Operations R&S Means of User Interaction UPARROW/DNARROW keys The [UPARROW] or [DNARROW] keys do the following: ● In a numeric edit dialog box, increase or decrease the instrument parameter. ● In a list, scroll forward and backward through the list entries. ●...
- Page 60 ® Basic Operations R&S Means of User Interaction A list of softkeys for a certain function key is also called a menu. Each softkey can either represent a specific function, or a submenu that in turn represents several softkeys. Selecting softkeys ►...
- Page 61 ® Basic Operations R&S Means of User Interaction Hiding softkeys You can hide the softkey display, e.g. when using remote control, in order to enlarge the display area for the measurement results. When you press a function key on the front panel, the softkeys are displayed temporarily, enabling you to perform a certain task with the softkeys.
- Page 62 6.2.9 Dialog Boxes In most cases, the R&S ESR dialog boxes are designed to enter a numeric value. In the documentation, these dialog boxes are called "edit dialog boxes". Dialog boxes that are not only designed for parameter entry have a more complex struc- ture and, in the documentation, are called "dialog boxes".
-
Page 63: Setting Parameters
The optional third line shows status and error messages which always refer to the cur- rent entry. Setting Parameters This section describes how to perform the following basic tasks in the R&S ESR: ● Chapter 6.3.1, "Entering Numeric Parameters", on page 63 ●... - Page 64 ® Basic Operations R&S Setting Parameters 6.3.2 Entering Alphanumeric Parameters If a field requires alphanumeric input, you can use the on-screen keyboard to enter numbers and (special) characters (see also Chapter 6.2.3, "On-screen Key- board", on page 56). Figure 6-2: On-screen keyboard Alternatively, you can use the keypad.
- Page 65 ® Basic Operations R&S Setting Parameters Correcting an entry: 1. Using the arrow keys, move the cursor to the right of the entry you want to delete. 2. Press the [BACKSPACE] key. 3. The entry to the left of the cursor is deleted. 4.
- Page 66 ® Basic Operations R&S Setting Parameters 6.3.3 Navigating in Dialog Boxes Some of the dialog boxes are not only for parameter entry, and therefore have a more complex structure. The following figure shows an example. Changing the focus The focus on the graphical user interface is moved by pressing an element on the screen, or via the rotary knob.
- Page 67 ® Basic Operations R&S Setting Parameters Figure 6-3: Focused area Figure 6-4: Focused area in edit mode Edit mode When using the touchscreen for focus changes, all focused areas are in the edit mode automatically, if available. Otherwise, you must switch to edit mode manually.
- Page 68 ® Basic Operations R&S Setting Parameters Chapter 6.3.2, "Entering Alphanumeric Parameters", on page 64. If you edit fields, the edit mode is activated automatically when you start typing. ● To move the focus to the next interface element (e.g. field, option, list), press it on the screen, or turn the rotary knob.
-
Page 69: Changing The Display
In some cases, e.g. if you want to install a printer, original Windows dialog boxes are used. In these dialog boxes, the navigation behavior is different to the one you are used to from R&S ESR applications. In the following, the important differ- ences and useful tips are listed: ●... - Page 70 When working with an external monitor or operating via remote control on a com- puter, it is useful to be able to interact with the R&S ESR without requiring the keypad and keys located on the front panel of the instrument. Therefore, a "Soft Front Panel"...
- Page 71 ® Basic Operations R&S Changing the Display Using the F6 key you can toggle the Front Panel display on and off. Remote: SYST:DISP:FPAN:STAT ON Working with the Soft Front Panel Basic operation with the soft Front Panel is identical to normal operation. To acti- vate a key, either press the key on the touchscreen, or click on it with the mouse pointer.
- Page 72 ® Basic Operations R&S Changing the Display 2. In the "Display Settings" dialog box, select "Mini Front Panel State: On". The "Mini Front Panel" window appears on the screen. It can be moved any- where on the screen where it does not interfere with your current task. Using the key combination [ALT + M] you can toggle the Mini Front Panel display on and off.
- Page 73 ® Basic Operations R&S Changing the Display 6.4.4 Enlarging the Display Area You can enlarge the screen display area if you are using an external mon- itor or the Soft and Mini Soft Frontpanel display (see Chapter 6.4.3, "Soft and Mini Soft Front Panel Display", on page 70).
- Page 74 ® Basic Operations R&S Changing the Display Zoom and the number of sweep points Note that zooming is merely a visual tool, it does not change any measure- ment settings, such as the number of sweep points! You should increase the number of sweep points before zooming, as other- wise the function has no real effect (see the "Sweep Points"...
- Page 75 ® Basic Operations R&S Changing the Display Scrolling in the zoomed display You can scroll the diagram area to display the entire diagram using the scrollbars at the right and at the bottom of the diagram. To return to selection mode in the diagram While you are in zoom mode, touching the screen changes the zoom area.
- Page 76 ® Basic Operations R&S Changing the Display DISP:ZOOM:AREA 5,30,20,100 3. Hide the overview window: DISP:ZOOM:OVER OFF 6.4.7 Adding a Title to the Diagram Header You can add an introductory title to the trace information in the diagram header. 1. Press the SETUP key. 2.
- Page 77 ® Basic Operations R&S Changing the Display 3. Press the "More" softkey. 4. Press the "Theme Selection" softkey. A list of available themes is displayed. 5. Select the desired theme from the list. The screen display changes according to the selected theme. SCPI command: DISPlay:THEMe:SELect 6.4.10 Displaying and Setting the Date and Time...
- Page 78 ® Basic Operations R&S Changing the Display To descrease the display update rate 1. Press the [DISPLAY] key. The "Display Settings" dialog box is opened. 2. Under "Display Update Rate", select "Slow". The display is updated less frequently, and performance for measurements should improve.
-
Page 79: Basic Measurement Examples
If you measure signals higher than +30 dBm (= 1 W), insert a power attenua- tor before the RF input of the analyzer. 2. Connect the RF output of the signal generator to the RF input of R&S ESR. Getting Started 1316.3749.02 ─ 09... - Page 80 The R&S ESR always displays its amplitude and frequency at the marker position. The frequency measurement uncertainty is determined by the frequency reference of the R&S ESR, the resolution of the marker frequency display and the number of sweep points.
- Page 81 ® Basic Measurement Examples R&S Measuring a Sinusoidal Signal M1[1] -30.00 dBm 128.00000 MHz The field header indicates the number of the marker (Marker 1) and the trace on which the marker is located ([1] = Trace 1). Note: Performing a peak search. When a marker is initially activated, it auto- matically performs the peak search function (as shown in the example).
- Page 82 Low Reference Levels If the selected reference level is lower than the highest signal that occurs in the spectrum, the signal path in the R&S ESR is overloaded. In this case, the message "IFOVL" is displayed in the error message field.
- Page 83 The built-in frequency counter allows you to measure the frequency more accu- rately than measuring it with the marker. The frequency sweep is stopped at the marker, and the R&S ESR measures the frequency of the signal at the marker position.
-
Page 84: Measuring Harmonics Of Sinusoidal Signals
® Basic Measurement Examples R&S Measuring Harmonics of Sinusoidal Signals Figure 7-1: Measurement of the frequency with the frequency counter Prerequisites for using the internal frequency counter In order to obtain a correct result when measuring the frequency with the internal frequency counter, an RF sinusoidal signal or a spectral line must be available. - Page 85 Press the "Start" softkey and enter 100 MHz. c) Press the "Stop" softkey and enter 400 MHz. The R&S ESR displays the fundamental and the first and second harmon- ics of the input signal. 4. To average (smooth) the noise, reduce the video bandwidth.
- Page 86 ® Basic Measurement Examples R&S Measuring Harmonics of Sinusoidal Signals Figure 7-2: Measuring the harmonic suppression of the internal reference generator. Delta markers D2 [1] and D3 [1] show the offset of the first and second harmonics from the fundamental. Reducing Noise The signal analyzer offers three methods to differentiate the harmonics of a signal from the noise effectively:...
- Page 87 ® Basic Measurement Examples R&S Measuring Harmonics of Sinusoidal Signals Reducing the noise by reducing the video bandwidth 1. Press the [BW] key. 2. Press the "Video BW Manual" softkey. 3. Reduce the video bandwidth to 1 kHz (for example), by entering 1 kHz. This smoothes the noise significantly, and the sweep time is increased to 200 ms.
-
Page 88: Measuring Signal Spectra With Multiple Signals
® Basic Measurement Examples R&S Measuring Signal Spectra with Multiple Signals 2. Press the "Trace Wizard" softkey. 3. For "Trace 1", press the button in the "Trace Mode" column and select "Aver- age" from the list. The noise component of the trace is smoothed by averaging 10 successive traces. - Page 89 128,03 MHz 1. Set the signal analyzer to the default state by pressing the [PRESET] key. The R&S ESR is set to its default state. 2. Select "Spectrum" mode. 3. Set the center frequency to 128.015 MHz and the frequency span to 300 kHz.
- Page 90 The level drop is located exactly in the center of the screen only if the genera- tor frequencies match the frequency display of the R&S ESR exactly. To ach- ieve exact matching, the frequencies of the generators and the R&S ESR must be synchronized.
- Page 91 ® Basic Measurement Examples R&S Measuring Signal Spectra with Multiple Signals Figure 7-5: Measurement of two equally-leveled RF sinusoidal signals with a resolu- tion bandwidth which is larger than their frequency spacing Note: Reducing the resolution bandwidth. The resolution bandwidth (RBW) can be reduced again by turning the rotary knob counterclockwise, thus yield- ing a higher frequency resolution.
- Page 92 Since the dynamic range of a signal analyzer is very large, extremely small modulation depths can also be measured precisely. For this purpose, the R&S ESR provides measurement rou- tines that output the modulation depth numerically in % directly.
- Page 93 Press the "More" key. c) Press the "AM Mod Depth" softkey. The R&S ESR automatically sets a marker to the carrier signal in the cen- ter of the diagram and one delta marker each to the upper and lower AM sidebands.
- Page 94 50 % AM, 1 kHz AF 1. Set the signal analyzer to the default state by pressing the [PRESET] key. The R&S ESR is set to its default state. 2. Select "Spectrum" mode. 3. Set the center frequency to 128 MHz and the span to 0 Hz.
-
Page 95: Measurements In Zero Span
Press the "Trg/Gate Level" softkey and enter 50%. The trigger level is displayed as a horizontal line across the entire mea- surement diagram. The R&S ESR displays the 1 kHz AF signal as a static image in zero span. Use a headset to listen to the AF. - Page 96 Press the [SPAN] key and enter 0 Hz, or press the "Zero Span" softkey. 4. Set the reference level of the R&S ESR to 10 dBm (= level of the signal gener- ator +10 dB) and set the attenuation to 20 dB.
- Page 97 Measuring the Edges of a GSM Burst with High Time Resolution Because of the high time resolution of the R&S ESR at the 0 Hz display range, the edges of TDMA bursts can be measured precisely. The edges can be shifted to the screen area by using the trigger offset.
- Page 98 ® Basic Measurement Examples R&S Measurements in Zero Span Table 7-6: Signal generator settings (e.g. R&S SMU) Frequency 890 MHz Level 0 dBm Modulation GSM, one timeslot activated The measurement is based on the setting in the example above for measuring the power of the GSM during the activation phase.
- Page 99 -50 µs. The R&S ESR displays the rising edge of the GSM burst. Figure 7-9: Rising edge of the GSM burst displayed with high time resolution 4.
- Page 100 For this purpose, the R&S ESR provides the function for measuring absolute and relative power in zero span. In the following example, the measurement is per- formed using a GSM burst.
- Page 101 Press the [BW] key. d) Press the "Res BW Manual" softkey and enter 1 MHz. 4. Set the reference level of the R&S ESR to 0 dBm (= level of the signal genera- tor) by pressing the [AMPT] key and entering 0 dBm.
- Page 102 Using the rotary knob, move the second vertical line to the end of the burst. The R&S ESR displays the power during the activation phase of the burst. Figure 7-11: Power measurement during the activation phase of the burst 8.
- Page 103 Measurements in Zero Span b) Switch the "Trg/Gate Polarity" softkey to "Neg." The R&S ESR initiates triggering in response to the falling edge of the burst. This shifts the burst to the left-hand half of the measurement dia- gram. The power is measured in the deactivation phase. The start of the burst is shifted to the center of the screen and the power during the deacti- vation phase is measured.
- Page 104 1 kHz AF 1. Set the signal analyzer to the default state by pressing the [PRESET] key. The R&S ESR is set to its default state. 2. Select "Spectrum" mode. 3. Set the center frequency to 127.50 MHz and the span to 300 kHz.
- Page 105 Figure 7-13: Display of the filter edge of the 300 kHz filter as an FM discriminator characteristic 6. Set the FM deviation to 50 kHz on the signal generator. 7. Set the span to 0 Hz on the R&S ESR. a) Press the [SPAN] key. b) Press the "Zero Span" softkey.
- Page 106 ® Basic Measurement Examples R&S Measurements in Zero Span c) Press the "Trg/Gate Level" softkey and enter 50%. A static image for the FM AF signal is produced. Result: (-10 ( 5) dB; this yields a deviation of 100 kHz when the steepness of the demodulator characteristic is 5 dB/100 kHz.
-
Page 107: Storing And Loading Instrument Settings
Storing and Loading Instrument Settings Storing and Loading Instrument Settings The R&S ESR can store complete instrument settings together with instrument configurations and measurement data in a settings file. The data is stored on the built-in hard disk or - if selected - on a USB device (e.g. memory stick) or on a network drive. - Page 108 ® Basic Measurement Examples R&S Storing and Loading Instrument Settings The name may contain letters and digits. For details on alphanumeric entries Chapter 6.3.2, "Entering Alphanumeric Parameters", on page 64. 4. To store the file in a directory different to the default directory, select the required path in the Files area.
- Page 109 7.5.4 Configuring Automatic Loading If the R&S ESR is switched on in the factory default state, it loads the instrument settings that it had when switched off (provided that it was switched off using the power button on the front panel; see Chapter 5.9, "Switching the Instrument On...
-
Page 110: Index
® Index R&S Index Symbols TRIGGER OUTPUT ......26 USB ..........22, 27 75 Ω (enhancement label) ....... 49 Data sheets ..........13 Alphanumeric parameters ....... 64 Diagram area AP (trace information) ......50 Enhancement labels ......48 Application cards ........14 Hardware settings ....... - Page 111 ® Index R&S Measurement example AF of AM-modulated signal ....93 Hardware settings AF of FM-modulated signal ....103 Display ..........48 AM modulation ........92 input ............ 47 First and second harmonic ....84 Level and frequency ......80 Power of burst signals ......95 Icons Separating signals ......
- Page 112 ® Index R&S Themes Display ..........76 QP (trace information) ......51 Toggling Span values ........57 TOI (marker functions) ......51 RA (trace information) ......51 Toolbar RBW (hardware setting) ......48 Icon ............. 54 Ref (hardware setting) ......48 Toggle ..........
Need help?
Do you have a question about the ESR and is the answer not in the manual?
Questions and answers