Solmetric PVA-1500V2 User Manual
Pv analyzer i-v curve tracer with solsensor
Hide thumbs
Also See for PVA-1500V2:
- Quick reference card (2 pages) ,
- User manual (154 pages) ,
- User manual (150 pages)

Subscribe to Our Youtube Channel
Related Manuals for Solmetric PVA-1500V2


Summary of Contents for Solmetric PVA-1500V2
- Page 1 Solmetric PV Analyzer I-V Curve Tracer User’s Guide ™ PVA-1500V2/V3 with SolSensor 300V2 ™ PVA-1500S with SolSensor ™ PVA-1000S with SolSensor ™ PVA-600 with SolSensor...
- Page 2 Software Title Part No. 600-90001 Solmetric remains the owner of all right, title and interest in Version 4.0 or higher the PC Software, Embedded Software, and Documentation. September 2020...
- Page 3 ANY DAMAGES, INCLUDING ANY LOST PROFITS, warranted against defects in materials and workmanship for LOST SAVINGS, INJURY, DEATH, OR OTHER a period of one year. During the warranty period, Solmetric INCIDENTAL OR CONSEQUENTIAL DAMAGES will, at its option, either repair or replace products which ARISING FROM THE USE OF OR THE INABILITY TO prove to be defective.
- Page 4 This license agreement may be modified only in writing and written documentation must be signed by Buyer and Solmetric. In the event of litigation between Buyer and Solmetric concerning the PC Software, Embedded Software, Hardware, or Documentation, the prevailing party in the litigation will be entitled to recover attorney fees and expenses from the other party.
-
Page 5: Table Of Contents
Contents 1 GETTING STARTED ............................1-1 ................................1-1 VERVIEW ....................1-2 OMPUTER INIMUM YSTEM EQUIREMENTS ................................1-3 QUIPMENT Curve Tracer Equipment (PVA-1500xx, PVA-1000S, PVA-600 ) ..............1-3 SolSensor Equipment ............................1-3 ..............................1-4 PECIFICATIONS PVA-1500xx I-V Measurement Unit Specifications ..................1-4 PVA-1500xx Test Lead and Clip Specifications .................... - Page 6 PVA-1000S Precautions ..........................1-21 Using PV Connector Saver Jumpers......................1-21 PV/Electrical Safety Precautions ........................ 1-22 Battery Precautions ............................. 1-23 Measuring High-Efficiency PV Modules ....................1-23 PVA-600 Precautions ............................ 1-23 Using PV Connector Saver Jumpers......................1-23 PV/Electrical Safety Precautions ........................ 1-24 Battery Precautions .............................
- Page 7 Prediction of PV Performance ........................3-30 Translation of Measured Values to STC ......................3-30 Measurement of I ............................3-31 PVA PC S ..........................3-31 OFTWARE PDATES PVA-1500V2/V3 300V2 F ............... 3-31 ENSOR IRMWARE PDATES 4 MAKING MEASUREMENTS........................... 4-1 ..............................4-1 NTRODUCTION ..................
- Page 8 Measure the open circuit voltage Voc ....................... 4-2 Place the I-V Unit near the PV circuits to be measured ..................4-3 Connect the test leads to the PVA ........................4-3 Launch the PVA software ..........................4-3 Load your Project .............................. 4-3 Insert the wireless USB adapter (PVA-1000S and PVA-600+) ................
- Page 9 PV M ............................. 7-1 NPUTS TO THE ODEL I-V C ............................ 7-2 URVE ERMINOLOGY Performance Factor ............................7-2 Fill Factor ................................7-2 I-V C ........................7-3 HAPE OF A ORMAL URVE I-V C ........................... 7-4 NTERPRETING URVES 1. N ............................7-7 OTCHES OR STEPS Array Is Partially Shaded, or non-uniform soiling or debris is present .............
- Page 10 6. I (PVA-600+ PVA-1000S ) ..........1-29 IGURE NSERT WIRELESS ADAPTER ONLY 7. I ......................1-30 IGURE NSTALLATION COMPLETE DIALOG 8. L ......................1-30 IGURE AUNCHING THE SOFTWARE 9. S ............................1-30 IGURE PLASH SCREEN 10. T PVA-1500, PVA-1000S ( PVA-600 IGURE HE SOFTWARE USER INTERFACE SHARED BY THE...
- Page 11 49. M ............................3-23 IGURE EST TAB 50. H ..............3-25 IGURE EADER NFORMATION SECTION OF THE EXPORTED CSV FILE 51. T ..........3-26 IGURE EASUREMENT VS ODEL SECTION OF THE EXPORTED CSV FILE 52. T ..........3-26 IGURE ENSOR EASUREMENTS SECTION OF THE EXPORTED CSV FILE 53.
- Page 12 This page is intentionally left blank.
-
Page 13: Getting Started
Analyzer” it is referring to all versions. When you see “PVA-1500xx” it is referring to all 1500V versions, including the PVA-1500S, PVA-1500V2, and PVA-1500V3. When you see “PVA-1500V2/V3” it is referring to both PVA-1500V2 and PVA-1500V3. The Solmetric PV Analyzer is a portable electrical test instrument designed for commissioning and troubleshooting PV arrays. -
Page 14: Computer Minimum System Requirements
This data is stored and managed using the same type of array tree touch interface as the I-V measurement results. On its website Solmetric posts notices of software updates. It’s a good idea to check this NOTE from time to time by visiting Solmetric.com. -
Page 15: Equipment
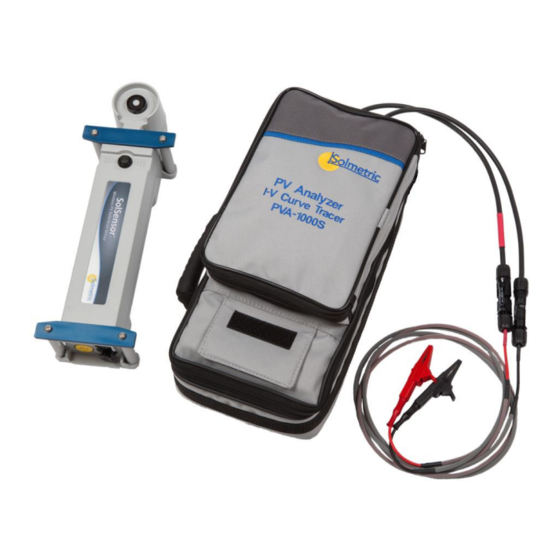
I-V Measurement Unit • Soft Case • Wireless USB Adapter (not required or provided with PVA-1500xx) • PVA Software Application (available at http://www.solmetric.com/downloads- pva.html) • AC Wall Plug Charger • MC-4 to MC-4 Connector-Saver Cable (2) • Test leads, MC-4 to 4mm banana plug with plug-on alligator clips (for PVA- 1000S and PVA-600+, rated to 1000V DC, 1 set) •... -
Page 16: Specifications
1 Getting Started Specifications PVA-1500xx I-V Measurement Unit Specifications Safety Rating: Measuring Category CAT III 1500V (applies to the I-V Measurement Unit only. Refer to the PVA-1500xx Test Lead and Clip Specifications section on page their unique specifications). Table 1. PVA-1500xx electrical and mechanical specifications Parameter Specification 0 –... -
Page 17: Pva-1500Xx Test Lead And Clip Specifications
1 Getting Started Parameter Specification Warning features Over-voltage, over-current, over- temperature, reverse polarity PV connector Staubli MC4-EVO2 Weight 6.6 kg (including soft case, test leads & charger) Height 38 cm (not including primary PV leads) Width 20 cm (not including handle) Depth 13 cm (not including gear pouch) Conventional PV modules and strings may be measured in parallel, up to the current... -
Page 18: Pva-1000S I-V Measurement Unit Specifications
1 Getting Started *Use only test leads and clips provided by Solmetric for the PVA-1500xx. PVA-1000S I-V Measurement Unit Specifications Safety Rating: Measuring Category CATIII 1000V. Table 3. PVA-1000S electrical and mechanical specifications Parameter Specification 0 – 1000 V Voltage range 0 –... -
Page 19: Specifications
1 Getting Started Parameter Specification Weight 5.4 kg (including soft case, test leads & charger) Height 38 cm (not including primary PV leads) Width 20 cm (not including handle) Depth 13 cm (not including gear pouch) Conventional PV modules and strings may be measured in parallel, up to the current limit specified here. -
Page 20: Solsensor 300 And Solsensor 300V2 Specifications
Measurement range Accuracy Typically, ±2% when used to predict the performance of well characterized poly- and monocrystalline PV modules in mid-day direct sun conditions. Contact Solmetric Application Engineering for more information on accurate irradiance measurements. Resolution 1 W/m Measurement interval 0.1 s (Measurement bandwidth approximately... - Page 21 1 Getting Started Parameter Specification Temperature Sensor type Type K thermocouple. Two inputs. 0 – 100ºC Measurement range Accuracy Typically, less than 2C including inherent thermocouple limitations Resolution 0.1ºC Measurement interval Tilt Sensor type Electronic 0 – 90 deg from horizontal Measurement range Accuracy ±2 deg typical (0-45 deg)
-
Page 22: Solsensor (Original) Specifications
Measurement range Accuracy Typically, ±2% when used to predict the performance of well characterized poly- and monocrystalline PV modules in mid-day direct sun conditions. Contact Solmetric Application Engineering for more information on accurate irradiance measurements. Resolution 1 W/m Measurement interval 0.1 s (Measurement bandwidth approximately... -
Page 23: Safety And Regulatory
1 Getting Started Parameter Specification Operating temperature range -10 to 65ºC Storage temperature range -20 to 65ºC Operating humidity <90% RH, non-condensing. Avoid exposing a cold instrument to warm and humid air as condensation will result. Store the instrument in the same conditions in which it will be used. Battery charging time 6 hr. -
Page 24: Declaration Of Conformity
1 Getting Started NOTE A Note provides important or special information. Declaration of Conformity A declaration of conformity is available upon request. Cleaning To remove dirt or dust from the external case and/or hard enclosure of the PVA-1500xx, use a dry or slightly dampened cloth only. WARNING To prevent electrical shock, disconnect the PVA-1500xx from the PV system and/or battery charger before cleaning. -
Page 25: Declaration Of Conformity
1 Getting Started NOTE A Note provides important or special information. Declaration of Conformity A declaration of conformity is available upon request. Cleaning To remove dirt or dust from the external case and/or hard enclosure of the PVA-1000S, use a dry or slightly dampened cloth only. WARNING To prevent electrical shock, disconnect the PVA-1000S from the PV system and/or battery charger before cleaning. -
Page 26: Declaration Of Conformity
1 Getting Started CAUTION A Caution calls attention to a procedure that, if not performed correctly, could result in damage to, or destruction of, the instrument. Do not proceed beyond a caution note until the indicated conditions are fully understood and met. NOTE A Note provides important or special information. -
Page 27: Solsensor 300 And Solsensor 300V2 Safety And Regulatory
1 Getting Started SolSensor 300 and SolSensor 300V2 Safety and Regulatory Warnings, Cautions, and Notes Before operating SolSensor, familiarize yourself with the following notations. WARNING A Warning calls attention to a procedure, which, if not performed correctly, could result in personal injury or loss of life. Do not proceed beyond a warning note until the indicated conditions are fully understood and met. -
Page 28: Solsensor (Original) Safety And Regulatory
1 Getting Started This symbol indicates separate collection for electrical and electronic equipment, mandated under EU law as of August 13, 2005. All electrical and electronic equipment are required to be separated from normal waste for disposal. (Reference WEEE Directive, 2002/96/EC.) SolSensor (original) Safety and Regulatory Warnings, Cautions, and Notes Before operating SolSensor, familiarize yourself with the following notations. -
Page 29: Instrument Markings
1 Getting Started Instrument Markings The SolSensor has the following markings on the front and/or rear panel. Familiarize yourself with these markings before operating the SolSensor. The cTUVus mark signifies that the product has been thoroughly tested and specifically certified to comply with the electrical and fire safety regulations of Canada and the United States. -
Page 30: Precautions
PVA-1500xx Precautions Using Test Leads and Clips Use only the test leads and clips specifically provided by Solmetric for use with the PVA- 1500xx. These leads and clips are specially rated for use at voltages up to 1500V and 30A DC. The test leads are labeled as shown in Figure 1 below. -
Page 31: Using Pv Connector Saver Jumpers
Replace them with fresh connector-saver jumpers, which can be ordered from Solmetric. Using the connector-saver jumpers as described here will extend the life of the PVA- 1500xx PV connectors by 100 times. - Page 32 1000S, which are rated only to 1000v. WARNING Do not remove instrument covers. There are no user serviceable parts within. Operation of the instrument in a manner not specified by Solmetric may result in personal injury or loss of life. •...
-
Page 33: Battery Precautions
Contact your local environmental control or disposal agency for further details. WARNING Only use the battery charger supplied by Solmetric. Measuring High-Efficiency PV Modules High-efficiency PV modules produce a short but intense inrush current at the start of the I-V measurement. -
Page 34: Pv/Electrical Safety Precautions
1 Getting Started PV/Electrical Safety Precautions Installed PV systems are not consistent in design or construction. Therefore, the guidance provided in this section is general in nature, and it is critical that you apply techniques and precautions appropriate to the circumstances, following best PV/electrical safety precautions. -
Page 35: Battery Precautions
1 Getting Started WARNING Do not remove instrument covers. There are no user serviceable parts within. Operation of the instrument in a manner not specified by Solmetric may result in personal injury or loss of life. • Do not use the I-V Unit if it is damaged. Always inspect for damage before using. -
Page 36: Pv/Electrical Safety Precautions
Replace them with fresh connector-saver jumpers, which can be ordered from Solmetric. Using the connector-saver jumpers as described here will extend the life of the PVA-600 PV connectors by 100 times. -
Page 37: Battery Precautions
WARNING Do not remove instrument covers. There are no user serviceable parts within. Operation of the instrument in a manner not specified by Solmetric may result in personal injury or loss of life. • Do not use the I-V Measurement Unit if it is damaged. Always inspect for damage before using. -
Page 38: Cleaning The Irradiance Sensor
SolSensor contains a small lithium battery and should not be disposed of with general refuse. Dispose of the battery in accordance with all local codes and regulations for products containing lithium batteries. Contact your local environmental control or disposal agency for further details. WARNING Only use the battery charger supplied by Solmetric. 1-26... -
Page 39: Installation Procedure
USB flash drive or run setup.exe from the Run dialog. Alternately, the installation file is available at http://www.solmetric.com/downloads-pva.html. Figure 2. Welcome screen Follow the instructions in the welcome screen to install the PVA software. The drivers for the wireless USB adapter will also be installed. -
Page 40: Figure 3. Prerequisites Dialog
1 Getting Started Figure 3. Prerequisites dialog After you start the installation, the following dialog appears for selecting the installation location. A default location is provided. Figure 4. Installation default location dialog Partway through the installation of the PVA-1000S or PVA-600+, the following screen will appear, asking you to insert the wireless USB adapter that will communicate with the I-V Unit. -
Page 41: Figure 5. Insert Wireless Usb Adapter Dialog
1 Getting Started Figure 5. Insert wireless USB adapter dialog Insert the wireless USB adapter shown below. NOTE If you are working with a PVA-1000S or PVA-600 and the Wireless USB Adapter is not available, you can complete the basic software installation by clicking Cancel. You will be asked whether the software installed correctly. -
Page 42: Figure 7. Installation Complete Dialog
1 Getting Started Figure 7. Installation complete dialog 10. If the Run Solmetric PV analyzer box is selected, the PVA software will launch when you click Finish. Alternately, you can start the PVA software by double- clicking on the shortcut icon on your desktop as shown in Figure 8. -
Page 43: Updating The Pv Equipment Databases
If your PC is connected to the internet when you start the PVA software, the software will check whether updated PV module or inverter equipment databases are available to be downloaded from Solmetric. Downloading takes only a few moments, and you do not need to restart your computer. -
Page 44: Solsensor Installation Procedure
I-V Unit shown in Figure 12 and plugging the charger into an AC outlet. If you are using a PVA-1500V2/V3, the pushbutton LED will blink slowly to indicate that the I-V Unit battery is being charged, and the LED will glow solid when the battery is fully charged. -
Page 45: Charging The Solsensor 300Xx Battery
When the SolSensor 300V2 is charging, the pushbutton LED blinks slowly. When charging is complete, the LED glows steadily. A SolSensor 300 can be upgraded to a SolSensor 300V2. Return to factory is required. Contact Solmetric www.Solmetric.com for assistance. You can check the battery voltage level by clicking on the Ready button in the PVA software following an I-V measurement, or by selecting Battery Level in the Utility menu. -
Page 46: Charging The Solsensor Battery Of The Original Solsensor
1 Getting Started Figure 14. Battery charger connector on the I-V Measurement Unit Charging the battery can take up to 6 hours. If you are using your I-V Measurement Unit heavily, we suggest you charge it each night. The PVA software interface will warn you when approximately one hour of battery life remains. -
Page 47: Your Wireless Network
1 Getting Started Your Wireless Network Your PVA-1500xx/SolSensor 300xx Wireless Network Communication between your PC and the PVA-1500xx I-V Measurement Unit is by conventional WiFi. The I-V Unit creates a hotspot when you turn it on. Just find that hotspot in your PC's network list and connect to it. The SSID (hotspot name) has the format “pva1500_yyyyyy”... -
Page 48: Your Pva-1000S/600 /Solsensor Wireless Network
If you own multiple sets of PV Analyzer equipment, be aware that each is a matched set. To avoid communications problems, keep the set together. A SolSensor 200 can be paired with a different I-V Unit if necessary. Call Solmetric Technical Support for assistance. -
Page 49: Figure 18. Network Diagrams
1 Getting Started Figure 18. Network diagrams For the PVA-1000S/600+ with SolSensor, communication can be direct from the PC to each of the instruments or either of the instruments can act as a relay. The network reconfigures itself automatically to achieve the longest transmission range between your devices. -
Page 50: Setting Up And Using The I-V Measurement Unit And Solsensor
I-V unit. The LED indicates these various operational states, also the status of the wireless network. There are differences in the operation of the LED pushbutton between the PVA-1500V2/V3, PVA-1500S, and PVA-1000S/600+. When the PVA-1500xx is turned on, it creates a Wi-Fi hotspot to which you will connect via your PC’s network list. - Page 51 1 Getting Started Table 8 describes the operational states of these instruments. Table 8. Pushbutton LED table for the PVA-1500xx I-V Units I-V Unit State LED Behavior Pushbutton Details Behavior Press once to turn on. Any state Press 3x to turn off I-V Unit.
-
Page 52: Operational States Of The Pva-1000S & 600
If the network connection is lost, the LED blinks rapidly to indicate it’s trying to establish a network. It should reconnect within 20-30 seconds. If you are using the PVA-1500V2/V3 and SolSensor 300V2 and pairing between them is lost, you can initiate re-pairing by pressing the I-V Unit’s LED button five times in rapid succession. -
Page 53: Setting Up The I-V Measurement Unit
Connect the Wireless USB adapter to a USB port in your computer. This step is not necessary for PVA-1500xx because communication is by WiFi. If you will be using the Solmetric SolSensor, refer to Setting Up SolSensor for setup information. -
Page 54: Setting Up Solsensor
1 Getting Started Setting Up SolSensor Below Figure 20 shows the SolSensor Wireless PV Reference sensor mounted on the frame of a PV module. Figure 20. SolSensor mounted on the frame of a PV module CAUTION: SolSensor contains a sensitive irradiance measurement device that can be damaged by impact or abrasion. -
Page 55: Mounting Sol Sensor To Apv Module Frame
1 Getting Started Mounting SolSensor to a PV module frame Below, Figure 21 shows SolSensor attached to a PV module with the Module Frame Clamp and secured with the Tool Lanyard. NOTE Mounting SolSensor along the upper horizontal edge of the module allows you to achieve better irradiance accuracy earlier and later in the day. -
Page 56: Figure 22. Sols
1 Getting Started Figure 22. SolSensor correctly seated along the upper horizontal leg of the module frame. Holding SolSensor in that position, slip the tip of the Module Frame Clamp inside the frame of the module. Seat the tip of the clamp on the flat inner surface of the frame as shown in Figure 23 and not on a shelf or ridge from which it could slip, allowing SolSensor to come loose. -
Page 57: Figure 24. Thermocouple Plugged Into The Figure 25. Locating The Thermocouple Tip On A Single Free
1 Getting Started Connect the thermocouple to SolSensor, inserting the yellow plug of the thermocouple wire into the upper left yellow receptacle labeled TC1 (see Figure 24). Figure 24. Thermocouple plugged into the TC1 connector. Tape the tip of the thermocouple into firm contact with the module backside, far enough under the module to avoid the cooler outer edges. -
Page 58: Figure 26. Sol Sensor Pushbutton With
1 Getting Started Figure 25. Locating the thermocouple tip on a single free-standing module. Remove the protective cover from SolSensor irradiance sensor. 10. Press the button to turn SolSensor on, as shown in Figure 26. The LED will blink on and off as it attempts a wireless connection, and will glow steadily when the connection is made. -
Page 59: Optimizing Wireless Transmission Range
Tripod mounting is also useful when it is not feasible to access the array. In this case you can set the PV Analyzer software to derive the module cell temperature from the measured I-V curve. To deploy SolSensor on a tripod, you will need the following equipment (contact support@solmetric.com for specific equipment recommendations): 2-47... -
Page 60: Figure 27. Tripod Mounting Setup
1 Getting Started Sturdy tripod Tripod level indicator This is typically a disc with a bubble level that mounts between the tripod and the rest of the fittings described here. Some tripods have a built-in level indicator. Note: level indicators vary widely in their sensitivity and accuracy. Tripod leveling head This device enables you to quickly and conveniently create a level mounting surface, without needing to adjust the legs of the tripod. -
Page 61: Connecting To The Solar Pv Equipment
A thermocouple extension cable may be useful; contact support@solmetric.com for recommendations. Fully spread the legs of the tripod and seat them firmly. -
Page 62: Figure 28. Example Of I-V M
If your strings run directly to the inverter, isolate them from one another and from the inverter by pulling their fuses. Connect the Solmetric PVA test leads to the string to be measured. In some cases, you can attach an alligator clip to the fuse clip, using it as a test point. -
Page 63: Powering-Up The I-V Measurement Unit
1 Getting Started If the distance between the test device and the I-V Measurement Unit requires the use of extension cables, use a PV cable that is properly rated for the maximum system voltage, with correctly installed connectors. Select a wire gauge that will result in a suitably small voltage drop. -
Page 64: I-V Measurements
1 Getting Started I-V Measurements The I-V Measurement Unit will measure an I-V curve each time you click on the Measure Now button. I-V data is transmitted to the PC shortly after each I-V sweep is taken. Data is not stored in the I-V Measurement Unit after it is transmitted. The Voc measurement is performed the instant before the actual I-V sweep begins. -
Page 65: Thermal Capacity Of The Pva-1500Xx
1 Getting Started Place the I-V Measurement Unit in the shade to reduce the likelihood of thermal CAUTION shutdown. Never place the I-V Measurement Unit on an asphalt driveway, on a solar panel, or roof in direct sunlight. Thermal Capacity of the PVA-1500xx The thermal capacity of the PVA-1500xx is the number of I-V measurements that can be made before the maximum allowable internal temperature is reached. -
Page 66: Over-Voltage Warnings
If a voltage more than 1500 V is detected, the I-V Measurement Unit is internally disabled to prevent continued use of a damaged unit. Resetting or restarting the I-V Measurement Unit will not re-enable it. Please contact Solmetric to arrange for repairs. PVA-600... -
Page 67: Reverse Polarity Protection
1 Getting Started Over-current can occur when: Measuring too many strings in parallel Measuring strings that are still electrically connected to the rest of the array or the inverter (for example, when the combiner box DC disconnect is not opened), and Measuring more than one string of high efficiency PV modules at a time (that is, connected in parallel). - Page 68 1 Getting Started Over-Voltage Warnings. 2-56...
-
Page 69: Software Overview
3 Software Overview 3 Software Overview Using Projects The PV Analyzer stores all of your setup information and measurement results in a specialized Windows file type file type called a Project file. The PV Analyzer software guides you through the steps of creating a Project for a particular array. All PV modules within a Project must be of the same type and must be mounted at the same azimuth. -
Page 70: Using The System Tree
3 Software Overview and adjusts your computer's clock as needed. Choose the time zone and daylight savings setting. All dates and times associated with the saved measurement data are preserved even if the Project is subsequently opened in another time zone. Using the System Tree The PV Analyzer provides a very efficient means of saving your data. -
Page 71: Menu Bar
Exports the measurement results for the currently loaded Project, as a Windows folder tree. It is organized hierarchically as System\Inverter\Combiner\String IV Data (csv files). Only the last measurement result for each location in the array is exported. Data in this hierarchical format can be analyzed automatically by the Solmetric Data Analysis Tool. -
Page 72: Export Meg Test Data
3 Software Overview Export Meg Test Data Exports the Meg test data as a .csv file, for the currently loaded project. New Project Clicking New Project… brings up the Site Info screen, shown in Figure 32. This is the first of three screens of the New Project Wizard. Figure 32. -
Page 73: Figure 34. Most Common Settings For A Horizontal Single
3 Software Overview To clarify what we mean by azimuth in a tracker, imagine that the tracker is stopped at a fixed setting and we want to determine the azimuth at which the modules are oriented. Imagine placing a marble on the module's glass surface, near the upper frame element, and releasing the marble to roll downhill. -
Page 74: Selecting Your Pv Module
3 Software Overview Figure 36. The PV Module screen of the New Project Wizard. Selecting your PV Module Selecting your PV module (Figure 36) makes the module's performance parameters available to the Project so that the software can calculate the expected I-V curve and the Performance Factor. -
Page 75: Creating The System Tree
3 Software Overview Review the 17 parameter values. If edits are needed, used the pencil icon buttons to enter the correct information. After editing, you have the option of renaming that module and saving it in the custom equipment folder. Creating the System Tree When you have finished selecting or editing your PV module, click Next to advance to the final step in the New Project Wizard, shown in Figure 38. -
Page 76: Using The Symmetrical Tree Builder
3 Software Overview Figure 39. Finished array tree for a utility PV field. The process of creating your tree has two parts. First, use the Symmetrical Tree Builder screen (shown in Figure 40) to create the basic structure of the tree. If it is a large utility- scale project, the design is likely to be modular, and in this first screen you will describe that modular, ‘symmetric’... - Page 77 3 Software Overview There are some limitations on which tree elements can be nested under one another. The rules are based mainly on the requirement that the PV source under test must ultimately nest (directly or indirectly) under an inverter. This list spells out that flexibility: Which elements can nest under the System? •...
- Page 78 3 Software Overview When you think your tree is complete, double-check it against your engineering drawings to be sure it’s correct, because it is not convenient to change the structure of this basic tree after exiting the Symmetrical Tree Builder. After closing the Symmetrical Tree Builder, use the editing features of the Array Navigator to add or delete items, adjust quantities, copy and paste, move up and down, and so on.
-
Page 79: Cloning, Modifying, And Reusing A Previous Project
3 Software Overview Cloning, Modifying, and Reusing a Previous Project If you need to create a new Project that will be very similar to one you have done before, you can save time by recycling the earlier project and adjusting it as needed. Follow these instructions. -
Page 80: View Menu
3 Software Overview Figure 43. Properties Menu View Menu Trace view options... These controls select which features are displayed in the Traces screen. Options include: Measured current vs. voltage curve I-V (STC) Measured current vs. voltage curve translated to STC Power vs. -
Page 81: Table 10. Utility Menu Description
3 Software Overview Table 10. Utility menu description Name Description Enable manual Check this menu item to display, as shown here the controls for sensor selecting your irradiance, temperature, and tilt sensing options. See configuration Chapter 6 Measuring Irradiance, Temperature, and Tilt for guidance on sensor choices. - Page 82 3 Software Overview Name Description Set I-V Curve Displays controls for selecting the number of measurement points in Resolution... your I-V curve. Select 100 points for commissioning and most troubleshooting. Select 500 points for some research and more detailed troubleshooting applications. The resolution can be changed at any time, and will remain in effect for subsequent measurements, until you change it again.
-
Page 83: Help Menu
In addition, the User Guide is available in the Support page of the Solmetric website, under Downloads. About Accesses the software version number and software build date. Please have this information ready if you call Solmetric about your PVA. 3-15... -
Page 84: Using The Tab Screens
3 Software Overview Using the Tab Screens The tabs along the left edge of the screen display measurement data in various ways. The paragraphs below explain how the features of each tab are used. Certain elements are common to more than one tab. These include the Status indicator, the Measure Now button, the Assign and Save... -
Page 85: Table 12. Traces Tab Description
3 Software Overview impact of electrical noise on measurement accuracy. The location of the blue marker is not derived from the PV model. • A green shaded region that represents the maximum power point tracking (MPPT) voltage range of your selected inverter. This feature is provided to help the user identify situations in which the number of modules in a string is not well matched to the inverter. - Page 86 3 Software Overview Name Description Measure Now Highlighted in green when the system is ready to start a new I-V measurement. Click this button to take a fresh measurement. Measuring (in Status indicator) During a measurement, the Measuring label blinks. Assign and Save Before the PV model points for a new measurement can be displayed on the I-V graph, the measurement...
- Page 87 3 Software Overview Name Description Disabled (in Status indicator) Displayed when a problem exists other than communication between the PC and I-V Measurement Unit. Problems could be related to low battery, over current, over voltage, over temperature, reversed polarity, and so on. No measurements can be taken while in this state.
- Page 88 3 Software Overview Name Description The preliminary irradiance value is an estimate of the actual irradiance, because without a Project, the software does not know how the irradiance sensor is oriented and cannot apply full correction for sun angle effects. Once a Project is created and loaded, irradiance is displayed in black, regular font, as shown here: Searching for SolSensor...
-
Page 89: Figure 47. Table Tab
3 Software Overview Table Tab Presents summaries of the predicted and measured I-V data and a translation of the measurement results to Standard Test Conditions. Figure 47 is an example of the Table tab screen. This section describes the table itself. See the Traces Tab section for explanations of other controls and displays on this screen. -
Page 90: History Tab
3 Software Overview Name Description efficiency of conversion from sunlight to electric power). It is defined as (I ) / (I ) and is discussed in detail in Chapter 7, Interpreting Measured I-V Curves.. Current Ratio The current ratio is a relative indication of the slope of the horizontal leg of the I-V curve. -
Page 91: Meg Test Tab
3 Software Overview Figure 48. History tab Meg Test Tab This tab is used to record resistance measurement results obtained from a separate instrument such as the Megger MIT430 Insulation Resistance Tester. Data is entered ® manually. The Meg Test tab is hidden by default. To enable this tab, use the control in the View menu. -
Page 92: Description Of The Exported I-V Data File
This section describes the organization of the .csv (comma separated value) file that is created in your hard drive when you export measurements from the PVA software. PV Analyzer users typically analyze their measurement results using the Solmetric I-V Data Analysis Tool (DAT), which automates the analysis and reporting process. To use the DAT, you will first export your Project data from the PV Analyzer, and then import it into the DAT. -
Page 93: Figure 50. Headeri
3 Software Overview When you export Project data, the PVA software creates a Windows folder tree on your hard drive that has the same hierarchy as your Network Navigator system tree. Your I-V trace data is exported to this folder structure in the form of comma separated value (.csv) files. -
Page 94: Figure 51. The Measurement Vs
3 Software Overview Item Description PVA Measurement Unit MAC The unique network address of the I-V Measurement Unit Address SolSensor MAC Address The unique network address of SolSensor Figure 51 shows the cardinal values of the measured and predicted I-V curves. The abbreviations represent maximum power, maximum power voltage and current, open circuit voltage, and short circuit current. -
Page 95: Figure 53. Modeld
3 Software Overview Table 16. Description of the SolSensor Measurements section of the exported csv file Item Description Irradiance Value of irradiance measured by SolSensor integrated Silicon photodiode sensor. Temperature Thermocouple 1 The temperature reading from the thermocouple plugged into SolSensor TC1 socket. Temperature Thermocouple 2 The temperature reading from the thermocouple plugged into SolSensor TC2 socket. -
Page 96: Table 17. Description Of Them
3 Software Overview Table 17. Description of the Model Details section of the exported csv file Item Description Irradiance used in model The value of irradiance used in the predictive model. Cell temperature used in The value of PV cell temperature used in the predictive model model. -
Page 97: Basis Of Pv Performance Predictions
3 Software Overview high-impedance voltmeter. This assures that the PV source circuit is truly unloaded when Voc is measured. Figure 54. The voltage, current, and power data from the I-V measurement Basis of PV Performance Predictions The PVA software predicts the electrical output of the PV source under test (module or string) based on the module performance model parameters, the existing irradiance and temperature, and a number of other factors. -
Page 98: Irradiance Measurement
3 Software Overview Irradiance Measurement SolSensor measurement of irradiance involves these steps: • SolSensor is clamped to the module frame, which orients it in the plane of the array. • The position of the sun relative to the orientation of the irradiance sensor is calculated based on the array azimuth and tilt and the site latitude and longitude. -
Page 99: Measurement Of I
It is free and takes only a few minutes. PVA-1500V2/V3 and SolSensor 300V2 Firmware Updates The firmware of the PVA-1500V2/V3 and SolSensor 300V2 can be updated in the field. The PVA-1500S and SolSensor 300 can be upgraded to PVA-1500V2 and SolSensor 3-31... - Page 100 * If you want to be able to upgrade your firmware in the field, you need to return your instruments to Solmetric for a one-time installation of the field-update capable firmware. To manually check which versions of firmware your I-V Unit and SolSensor are running, launch your PVA software, wirelessly connect to the instruments, select Help, then selext Connected Measurement Devices.
-
Page 101: Making Measurements
PVA hardware that you will be using. The PVA-1500xx uses version 4.x software, and the PVA-1000 and PVA-600+ use version 3.x software. To check the latest available version number, visit http://www.solmetric.com/downloads-pva.html. Create a Project in the PVA software. -
Page 102: Make Sure You Have All Your Equipment
Make sure you have all your equipment Personal Protective Equipment I-V Measurement Unit in its soft case, with a complete set of Solmetric-provided gear in its gear pouch. The pouch should contain PVA test leads, wireless USB adapter (not needed for PVA-1500xx), PVA software on a flash drive, and PV connector tools. -
Page 103: Place The I-V Unit Near The Pv Circuits To Be Measured
PV connectors out of the dirt. Connect the alligator clips to the ends of the test leads. Be sure to use only the Staubli Dolphin Clips supplied by Solmetric d with your PVA. Launch the PVA software Double click the PVA icon and the software will start. -
Page 104: Mount Solsensor
4 Making Measurements Mount SolSensor Attach SolSensor to a PV module frame using the provided bar clamp. It must face in the same direction as the PV module itself. Remove the black rubber cover (like a lens cap) that protects the irradiance sensor (the small white disc). -
Page 105: Turn On Solsensor
4 Making Measurements Turn on SolSensor Press and release the LED pushbutton. SolSensor powers up and starts looking for the wireless network. The LED blinks on and off while searching, and turns steady ON after it connects. The original SolSensor connects to the wireless USB adapter plugged into your PC or communicates indirectly using the I-V Unit as a relay station. -
Page 106: Connect The Test Leads To The Pv Equipment
4 Making Measurements Connect the test leads to the PV equipment Be sure to observe the correct polarities (connect the red test lead to DC positive, and the black test lead to DC negative). If you will be measuring circuits at a combiner box, after lifting all the fuses, you can connect the PVA test leads to the positive and negative buss bars. -
Page 107: Select The Next Pv Circuit And Take Another Measurement
4 Making Measurements Navigate to the location in the tree that matches where you are making your measurement. Highlight that branch of the Tree and click the Assign and Save button. If you don’t want to save the trace but do want the software to compare the measured trace with the predictions of the PV model, instead press the Assign Only button. -
Page 108: From Time To Time, Back Up Your Data
4 Making Measurements A low Fill Factor means that the shape of the I-V curve is degraded. This can be caused by shading, soiling, or debris or equipment on the modules under test. It is often helpful to clear the History table before moving on to the next combiner box. From time to time, back up your data The PVA software will remind you to back up your data. -
Page 109: Troubleshooting Pva Operation
5 Troubleshooting PVA Operation 5 Troubleshooting PVA Operation This chapter describes steps to troubleshoot the operation of the PVA. Troubleshooting of actual PV systems is not included in this discussion. Troubleshooting Using Status Messages Your main tool for troubleshooting PVA operation is the Status indicator, shown in Figure 56 and discussed in this chapter. - Page 110 If this is the case, clicking on the "Disabled" message provides instructions regarding the required version of Wireless USB Adapter. You may also need to update the I-V Measurement Unit firmware (contact Solmetric for support). I-V Measurement Unit battery voltage is too low In this case, clicking on the "Disabled"...
- Page 111 5 Troubleshooting PVA Operation Current overload pulse In this case, clicking on the "Disabled" message pops up a caution that a significant current overload pulse was detected. Check to be sure the inverter or other parts of the array were not inadvertently connected during the measurement. Also, certain high efficiency and thin film PV modules generate high discharge current pulses.
-
Page 112: Troubleshooting By Symptom
5 Troubleshooting PVA Operation also blinks rapidly when it is not connected to the PC via WiFi. Make sure that the I-V Unit is turned on and is within wireless range. “No WiFi connection” (PVA-1500xx only) This message appears when the PC WiFi network adapter is turned off. Turn on the Wifi adapter and connects to the PVA1500_yyyyyy hotspot. - Page 113 5 Troubleshooting PVA Operation The PVA software displays dashes in place of data in the sensor displays when SolSensor is turned off or out of wireless communication range, or when a thermocouple is not plugged into the yellow sockets labeled TC1 and TC2. Reduced wireless range can be caused by objects (especially metal) blocking the line-of- sight from PC to SolSensor, or by placing either the PC or SolSensor on top of or near metal objects like metal roof surfaces, equipment housings and so on.
- Page 114 Check that the Unit has been charged. Thermal fuse The I-V Measurement Unit contains a thermal fuse set to trip at 85C. This is an uncommon occurrence, but it irreversibly shuts down the Unit. If you suspect that this has occurred, contact Solmetric Technical Support.
- Page 115 5 Troubleshooting PVA Operation Solmetric Technical Support Phone: 707-823-4600 X2 Toll Free: 877-263-5026 Email: support@solmetric.com...
-
Page 117: Measuring Irradiance, Temperature, And Tilt
6 Measuring Irradiance, Temperature, and Tilt 6 Measuring Irradiance, Temperature, and Tilt Introduction Thorough evaluation of array performance by any measurement method (I-V curve tracing or conventional methods) always involves comparing measured I-V data to some form of reference. That reference may be anything from a simple STC maximum power value to a detailed PV performance model. -
Page 118: Table 18. Sensor Choices
6 Measuring Irradiance, Temperature, and Tilt • The materials in which the PV cell is embedded have poor thermal conductivity, so there can be substantial temperature drop between the cells and the module's front side or back side. • Temperature offset between PV cell and module backsheet depends on racking configuration and ventilation as well as current irradiance. -
Page 119: Measuring Irradiance With Solsensor
6 Measuring Irradiance, Temperature, and Tilt Measuring Irradiance with SolSensor SolSensor irradiance sensor SolSensor irradiance sensing element is a silicon photodiode with temperature correction. Its spectral response is corrected to match silicon solar cells and its angular response is corrected to provide enhanced accuracy over a broader part of the day. Preliminary Irradiance SolSensor irradiance measurement is further calibrated according to the PV model parameters for the selected PV module. -
Page 120: Orienting And Mounting The Irradiance Sensor
6 Measuring Irradiance, Temperature, and Tilt Orienting and mounting the irradiance sensor To provide a valid reference irradiance value, the sensor must be mounted in the plane of the array. This assures that the PV modules and the irradiance sensors present the same proportion of their area to the sun at all times of day (a cosine effect) and that reflective albedo effects are as similar as possible. -
Page 121: Determining Irradiance From The Measured I-V Curve
6 Measuring Irradiance, Temperature, and Tilt SolSensor irradiance sensor is corrected for angular effects. One of the benefits of this correction is better performance under diffuse light conditions. Determining Irradiance from the Measured I-V Curve When you select the From I-V option, the PVA software calculates irradiance from the measured I-V curve. -
Page 122: Entering Irradiance Manually
6 Measuring Irradiance, Temperature, and Tilt Entering Irradiance Manually When this option is selected, the user manually enters an irradiance value obtained by another method such as a hand-held sensor or an array mounted reference cell. This option has several disadvantages: •... -
Page 123: Selecting A Thermocouple Wire Gauge
6 Measuring Irradiance, Temperature, and Tilt • Backside temperature varies substantially across a PV module, string, or array. This variation is caused by patterns of convective cooling that depend on degree of ventilation, relative location in the array, and exposure to wind. For this reason, your temperature measurements can be biased higher or lower than actual. -
Page 124: Attaching The Thermocouple To The Module Backside
This tape is also available from Solmetric in spools of 1.75-inch disks for added convenience. Do not use cheap duct tape, as it sags when hot, allowing the thermocouple tip to pull away from the surface. -
Page 125: Measuring Pv Module Temperature With An Infrared Thermometer
6 Measuring Irradiance, Temperature, and Tilt Measuring PV module temperature with an infrared thermometer Some competing measurement solutions rely on infrared measurements of module temperature. This approach has serious limitations, which are discussed here because the PVA software allows the user to manually enter temperature values from hand-held sensor devices. -
Page 126: Determining Cell Temperature From The Measured I-V Curve
6 Measuring Irradiance, Temperature, and Tilt Determining Cell Temperature from the Measured I-V Curve When you select the From I-V option, the PVA software calculates the equivalent cell temperature from the measured I-V curve. This option has several benefits and several limitations, all due to the fact that since temperature is calculated mainly from the measured V and the resulting temperature value is an input to the PV model, the model... -
Page 127: Using Smarttemp To Measure Cell Temperature
6 Measuring Irradiance, Temperature, and Tilt Using SmartTemp to Measure Cell Temperature The SmartTemp method uses a blend of the From I-V and backside thermocouple methods, taking best advantage each while avoiding the biggest limitations of each. The blend changes as a function of irradiance: •... -
Page 129: Interpreting Measured I-V Curves
7 Interpreting Measured I-V Curves 7 Interpreting Measured I-V Curves Introduction A PV module, string, or array has a characteristic curve of current versus voltage; the “I- V curve”. The I-V curve represents the entire family of current and voltage pairs at which the PV circuit can be operated or loaded. -
Page 130: I-V Curve Terminology
7 Interpreting Measured I-V Curves I-V Curve Terminology These abbreviations will be used in the following discussion: • Short circuit current • Max power current • Max power voltage • Open circuit voltage • Performance Factor (PF, %) = 100 * (Measured P /Predicted P •... -
Page 131: The Shape Of A Normal I-V Curve
7 Interpreting Measured I-V Curves Figure 57. Definition of the Fill Factor. Fill Factor does not very much with irradiance so long as the irradiance is high, which means that comparing Fill Factor values is a good way to assess the consistency of I-V curve shapes in variable (but high) irradiance situations. -
Page 132: Interpreting I-V Curves
7 Interpreting Measured I-V Curves A normal I-V curve has a smooth shape with three distinct voltage regions as shown in Figure 58. A slightly sloped region above 0 V (the horizontal leg of the curve) A steeply sloped region below V (the downward leg of the curve) A bend or ‘knee’... - Page 133 7 Interpreting Measured I-V Curves 4. Rounder knee...
-
Page 134: Figure 59. Deviations In The Shape Of The
7 Interpreting Measured I-V Curves 5. Steeper slope in horizontal leg 6. Less steep slope in vertical leg Figure 59. Deviations in the shape of the I-V curve fall into one (or a combination) of these six categories It would be convenient if each of the I-V curve deviations illustrated in Figure 59 corresponded to a unique physical cause. -
Page 135: Notches Or Steps
7 Interpreting Measured I-V Curves 1. Notches or steps Examples of this type of deviation are shown in Figure 60, Figure 61, and Figure 62. Figure 60. The effect of partial shading on a string I-V curve. -
Page 136: Figure 61. The Shading Impact Of Placing A Business Card On A Single Cell In A String Of Fifteen
7 Interpreting Measured I-V Curves Figure 61. The shading impact of placing a business card on a single cell in a string of fifteen 180-watt modules Figure 62. The effect of intentionally shading entire modules in different combinations, in two parallel-connected strings NOTE The graphic shown in Figure 62 is an overlay of several I-V curve measurements. -
Page 137: Array Is Partially Shaded, Or Non-Uniform Soiling Or Debris Is Present
7 Interpreting Measured I-V Curves Array Is Partially Shaded, or non-uniform soiling or debris is present Partial shading of a PV cell reduces the current capacity of that cell, which in turn reduces the maximum current that can be produced by other series connected cells. For example, slightly shading one cell in a 72 cell module that has 3 bypass diodes will slightly reduce the current in 24 cells. -
Page 138: Pv Cells Are Damaged
7 Interpreting Measured I-V Curves 5. Steeper slope in horizontal leg. The impact of partial shading on the I-V curve is to create a notch. In a single PV string, the vertical height or current at which the notch appears is equal to the reduced short-circuit current of the partially shaded cells. The horizontal or voltage distance from V to the notch is related to the number of cell strings within modules that have been bypassed. -
Page 139: Uniform Soiling
7 Interpreting Measured I-V Curves Potential causes associated with the model settings include: • Incorrect module is selected for the PV model • Number of PV strings in parallel is not entered correctly in the model Potential causes associated with irradiance or temperature measurements include: •... -
Page 140: Module Degradation
7 Interpreting Measured I-V Curves Module Degradation Degradation of PV module performance with time and environmental stress is normally a very slow process. Given the number of factors that can affect the height of the I-V curve, the operator should estimate the impact of these other factors before concluding that the modules have degraded. -
Page 141: Irradiance Is Too Low, Or The Sun Is Too Close To The Horizon
7 Interpreting Measured I-V Curves Irradiance Is Too Low, or the Sun Is Too Close to the Horizon Most PV modules exhibit changes in the shape of their I-V curves under low light conditions. This effect tends to set in below 600 W/m^2 and becomes quite significant below 400 W/m^2. -
Page 142: Pv Cell Temperature Is Hotter Than The Measured Temperature
7 Interpreting Measured I-V Curves PV Cell Temperature Is Hotter than the Measured Temperature The module V is dependent on the temperature of the solar cells, with higher temperatures resulting in a lower V . It is possible that a poor thermal connection exists between the temperature measurement device and the back of the module. -
Page 143: Rounder Knee
7 Interpreting Measured I-V Curves 4. Rounder knee An example of this type of deviation is shown below. Figure 64. I-V curve measurement showing rounder knee than predicted by the PV model. Rounding of the knee of the I-V curve can be a manifestation of the aging process. Before concluding that this is the case, check the slopes of the horizontal and vertical legs of the I-V curve. -
Page 144: Steeper Slope In Horizontal Leg
7 Interpreting Measured I-V Curves 5. Steeper slope in horizontal leg An example of this deviation is shown below. Figure 65. An I-V curve showing steeper slope in the horizontal leg of the I-V curve. The horizontal leg of the I-V curve may exhibit a steeper slope than the PV model predicts. -
Page 145: Module I Sc Mismatch
7 Interpreting Measured I-V Curves steeper. The shunt current in a series of modules or within a single module can be dominated by a single hotspot on a single cell, or may arise from several smaller shunt paths in several series cells. Shunts within a module can improve over time, or can degrade until the module is damaged irreparably. -
Page 146: Less Steep Slope In Vertical Leg
The resistance of the primary test leads of the PV analyzer is extremely low and can be neglected. The resistance of the Solmetric Test Lead kit can also be neglected. Using smaller-gauge test leads can add significant resistance and corresponding measurement error. -
Page 147: Electrical Interconnections In The Array Are Resistive
7 Interpreting Measured I-V Curves Electrical Interconnections in the Array Are Resistive Electrical connections anywhere along the current path can add resistance to the circuit. Assure that connectors between modules are fully inserted. Also check for signs of corrosion in J-boxes and combiners. Series Resistance of PV Modules Has Increased Certain degradation mechanisms can increase the amount of series resistance of a particular module. -
Page 149: Translation Of I-V Data To Standard Test Conditions
8 Translation of I-V Data to Standard Test Conditions 8 Translation of I-V Data to Standard Test Conditions The PVA PC software provides a feature for translating the displayed I-V curve to and 25 C. The software also translates the Standard Test Conditions (STC) of 1000W/m key performance parameters in the Table view (tab). -
Page 150: Translation Equations
8 Translation of I-V Data to Standard Test Conditions reference condition, I . Using these (%/°C) units makes the same value applicable for both individual modules and for parallel strings of modules. α = Normalized temperature coefficient for I , (%/°C). Normalized in the same manner as α... - Page 151 8 Translation of I-V Data to Standard Test Conditions The translation equations are as follows, where the subscripts are defined as m = measured, and trans = translated: α * (E ) / (1 + ( /100) * (T sctrans scmeas trans meas...
- Page 152 8 Translation of I-V Data to Standard Test Conditions This page is intentionally left blank.
Need help?
Do you have a question about the PVA-1500V2 and is the answer not in the manual?
Questions and answers