Solmetric PVA-1000S User Manual
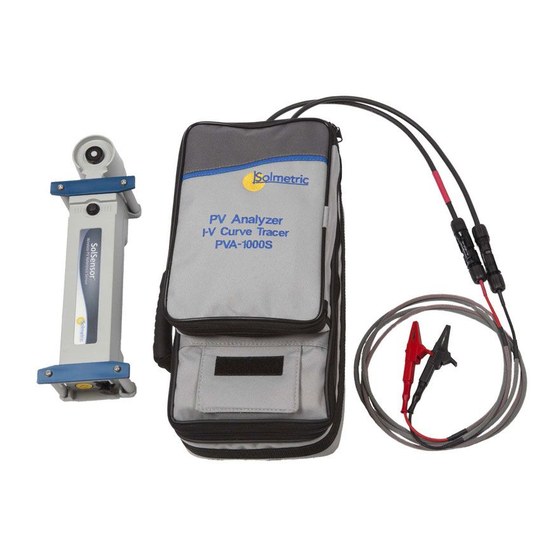
Pv analyzer and solsensor
Hide thumbs
Also See for PVA-1000S:
- Quick reference card (2 pages) ,
- User manual (154 pages) ,
- User manual (150 pages)
Table of Contents
Advertisement
Advertisement
Table of Contents
Troubleshooting

Subscribe to Our Youtube Channel
Related Manuals for Solmetric PVA-1000S


Summary of Contents for Solmetric PVA-1000S
- Page 1 Solmetric PVA-1000S PV Analyzer and SolSensor ™ User’s Guide...
- Page 2 Software Title Part No. 600-90001 Solmetric remains the owner of all right, title and interest in Version 3.0 the PC Software, Embedded Software, and Documentation. September 2013...
- Page 3 ANY DAMAGES, INCLUDING ANY LOST PROFITS, warranted against defects in materials and workmanship for LOST SAVINGS, INJURY, DEATH, OR OTHER a period of one year. During the warranty period, Solmetric INCIDENTAL OR CONSEQUENTIAL DAMAGES will, at its option, either repair or replace products which ARISING FROM THE USE OF OR THE INABILITY TO prove to be defective.
- Page 4 This license agreement may be modified only in writing and written documentation must be signed by Buyer and Solmetric. In the event of litigation between Buyer and Solmetric concerning the PC Software, Embedded Software, Hardware, or Documentation, the prevailing party in the litigation will be entitled to recover attorney fees and expenses from the other party.
-
Page 5: Table Of Contents
Changing the Battery on the PVA-1000S ....................... 1-18 Changing the SolSensor Battery ........................1-18 ..........................1-19 IRELESS ETWORK 2 SETTING UP AND USING THE PVA-1000S AND SOLSENSOR ............... 2-1 ........................2-1 YSTEM ONTROLS AND ETTINGS PVA-1000S Operational States ......................... 2-1... - Page 6 PVA-1000S ..........................2-3 ETTING P THE ............................2-3 ETTING ENSOR ....................2-4 OUNTING ENSOR TO A MODULE FRAME ....................... 2-8 PTIMIZING WIRELESS TRANSMISSION RANGE ........................2-9 OUNTING ENSOR ON A TRIPOD PV E ...................... 2-11 ONNECTING TO THE OLAR QUIPMENT I-V U ..........................
- Page 7 ..............................4-1 NTRODUCTION ............................ 4-1 REATING A ROJECT Start the PVA-1000S Software ......................... 4-2 Select New Project ............................4-2 Enter the Site Information ..........................4-3 Select PV Module ............................. 4-5 Create the System Tree ............................. 4-6 Add a New Inverter ............................4-7 Add a New Combiner ............................
- Page 8 7 INTERPRETING MEASURED I-V CURVES ....................7-1 ..............................7-1 NTRODUCTION PV M ............................. 7-1 NPUTS TO THE ODEL I-V C ............................ 7-2 URVE ERMINOLOGY Performance Factor ............................7-2 Fill Factor ................................7-2 I-V C ........................7-3 HAPE OF A ORMAL URVE I-V C ...........................
- Page 9 ....................1-16 IGURE SOFTWARE USER INTERFACE 10. D PVA-1000S ................1-17 IGURE IRECTORY STRUCTURE OF SOFTWARE 11. B PVA-1000S ................1-18 IGURE ATTERY CHARGER CONNECTOR ON THE 12. C ........................... 1-19 IGURE HARGER CONNECTED 13. N ............................. 1-20 IGURE ETWORK ICON 14.
- Page 10 CURVE SHOWING STEEPER SLOPE IN THE HORIZONTAL LEG OF THE CURVE 72. M ....... 7-17 IGURE EASUREMENT WITH LESS STEEP SLOPE IN THE VERTICAL LEG OF THE CURVE Tables 1. PVA-1000S ....................1-4 ABLE ELECTRICAL SPECIFICATIONS 2. S ....................1-5 ABLE ENSOR IRRADIANCE SPECIFICATIONS 3.
-
Page 11: Getting Started
PV models. Measurement results are easily saved for future reference and analysis. The PVA-1000S is controlled wirelessly by your portable PC via a wireless USB adapter. Wireless interfaces allow you to move around in the immediate work area, and eliminate the trip hazards associated with hard-wired interconnections. -
Page 12: Computer Minimum System Requirements
1 Getting Started The PC software can also save insulation resistance data collected by an insulation resistance tester. This data is stored and managed in the same database as the PVA-1000S I-V measurement results. Computer Minimum System Requirements ® ®... -
Page 13: Solsensor Equipment
1 Getting Started MC-4 to MC-3 Adapter Cable (1 set) User’s Guide (on Installation DVD and accessible via the PVA software) PVA/SolSensor Quick Start Guide SolSensor Equipment SolSensor unit K-type thermocouple temperature sensors (2) Wireless USB Adapter ... -
Page 14: Specifications
1 Getting Started Specifications PVA-1000S Specifications Safety Rating: Measuring Category CATIII 600V. Table 1. PVA-1000S electrical specifications Parameter Specification Voltage range 0 – 1000 V Current range 0 – 20 A Voltage accuracy (0 to 55C) ±0.5% ±0.25 V Current accuracy (0 to 55C) ±0.5% ±0.04 A... -
Page 15: Solsensor Specifications
0 – 1,500 W/m Accuracy Typically ±2% when used to predict the performance of well characterized poly- and monocrystalline PV modules in mid-day direct sun conditions. Contact Solmetric Application Engineering for more information on accurate irradiance measurements. Resolution 1 W/m Measurement interval 0.1 s (Measurement bandwidth approximately... - Page 16 1 Getting Started Parameter Specification thermocouple limitations Resolution 0.1C Measurement interval Tilt Sensor type Electronic Measurement range 0 – 90 deg from horizontal Accuracy (0 – 45 deg tilt) ±1 deg (typical) General Measurement synchronization with I-V Typically less than 1s curve Wireless range 100m line of sight...
-
Page 17: Safety And Regulatory
Declaration of Conformity A declaration of conformity is available upon request. Cleaning To remove dirt or dust from the external case and/or hard enclosure of the PVA-1000S, use a dry or slightly dampened cloth only. WARNING To prevent electrical shock, disconnect the PVA-1000S from the PV system and/or battery charger before cleaning. -
Page 18: Instrument Markings
1 Getting Started Instrument Markings The PVA-1000S has the following markings on the front and/or rear panel. Familiarize yourself with these markings before operating the PVA-1000S. The instruction manual symbol. The product is marked with this symbol when it is necessary for you to refer to instructions in the manual. -
Page 19: Instrument Markings
1 Getting Started WARNING To prevent electrical shock, disconnect SolSensor from the battery charger before cleaning. Use only a dry cloth or cloth slightly dampened with water to clean the external enclosure parts. Do not attempt to clean internally. WARNING The irradiance sensor (white disc) is a precision instrument and is easily damaged if cleaned improperly. -
Page 20: Precautions
PV connectors. The connector-saver jumpers are intended to take wear and tear, greatly extending the life of the PVA-1000S's own PV connectors. Leave the connector-saver jumpers in place at all times. Make all of your PV circuit connections/disconnections to the connector-saver jumpers, not to the PVA- 1000S's own connectors. -
Page 21: Battery Precautions
Battery Precautions CAUTION The PVA-1000S contains a small lithium battery and should not be disposed of with general refuse. Dispose of the battery in accordance with all local codes and regulations for products containing lithium batteries. Contact your local environmental control or disposal agency for further details. -
Page 22: Measuring High-Efficiency Pv Modules
High-efficiency PV modules may produce very high instantaneous current levels at the start of an I-V measurement, and this high current pulse may cause the PVA-1000S's protections circuits to trigger and place the I-V Unit in "Disabled" mode. For this reason, modules of high-efficiency modules (or strings) should not be measured in parallel. -
Page 23: Installation Procedure
Adapter. If this step is not performed, your PVA system will not function in the field. Insert the PVA-1000S DVD into the DVD drive on your Windows® computer. If the welcome screen does not automatically open as shown in Figure 1, either double-click on the setup.exe file on the DVD or run setup.exe from the Run... -
Page 24: Figure 2. Prerequisites Dialog
1 Getting Started Figure 2. Prerequisites dialog After you start the installation, the following dialog appears for selecting the installation location. A default location is provided. Figure 3. Installation default location dialog Partway through the installation, the following screen will appear, asking you to insert the wireless USB adapter that will communicate with the I-V Unit. -
Page 25: Figure 4. Insert Wireless Usb
1 Getting Started Figure 4. Insert wireless USB adapter dialog Insert the wireless USB adapter shown below. Figure 5. Insert wireless USB adapter When the Wireless USB Adapter driver installation completes, you will be asked whether the software installed correctly. Click Yes if that seems to be the case. When the installation process is finished, the following dialog appears. -
Page 26: Figure 7. Launching The Figure 8. Splash Screen
1 Getting Started 10. If the Run Solmetric PV analyzer box is selected, the PVA software will launch when you click Finish. Alternately, you can start the PVA-1000S software by double-clicking on the shortcut icon on your desktop as shown in Figure 7. -
Page 27: Special Xp Operating System Instructions
SolSensor Installation Procedure Drivers for SolSensor The SolSensor uses the same wireless USB adapter and driver as the PVA-1000S I-V Unit. Therefore, once the PVA-1000S software has been installed, no additional installation is required for using the SolSensor. -
Page 28: Charging The Battery
AC wall-plug. Figure 11. Battery charger connector on the PVA-1000S Charging the battery can take up to 6 hours. If you are using your PVA-1000S heavily, we suggest you charge it each night. There is no visible indication of charging on the PVA-1000S front panel. Because of the difficulties of determining the state of charge of the advanced lithium batteries, there is no user readout of charge level on the PVA-1000S software interface. -
Page 29: Your Wireless Network
There is no indicator on SolSensor to indicate that it is charging. Your Wireless Network The wireless network that interconnects your PC to the PVA-1000S and SolSensor uses a Zigbee protocol and operates in the 2.4 GHz frequency band. NOTE:... -
Page 30: Figure 13. Network Icon
1 Getting Started To see a diagram of the network, click on the network icon at the lower left corner of your measurement screen, as shown in Figure 13. Figure 13. Network icon The network diagram appears. There are four possible configurations, as shown in Figure Figure 14. -
Page 31: Table 3. Direct And Indirect Wireless Links Between
1 Getting Started Table 3. Direct and indirect wireless links between PC, PVA, and SolSensor Communication route Interface to I-V Unit Interface to SolSensor PC to I-V Unit Direct PC to SolSensor Direct PC to I-V Unit to SolSensor Direct Indirect PC to SolSensor to I-V unit Indirect... - Page 32 1 Getting Started This page left blank intentionally. 1-22...
-
Page 33: Setting Up And Using The Pva-1000S And Solsensor
W-USB adapter must be plugged into your PC and the PV Analyzer software must be launched. Figure 15. LED-illuminated button switch PVA-1000S Operational States The PVA-1000S I-V Unit can be in the following operational states: Power off ... - Page 34 2 Setting Up and Using the PVA-1000S and SolSensor Table 4. PVA-1000S states PVA-1000S State Description Power Button State Power Off PVA-1000S is turned off. LED Off. Network Search Press the power button once. LED Blinking. Communication between the I-V Unit and the Wireless USB adapter is attempted.
-
Page 35: Figure 16. Sols
Connect the Wireless USB adapter to a USB port in your computer. If you will be using the Solmetric Sol Sensor, refer to Setting Up the PVA-1000S for setup information. Setting Up SolSensor The figure below shows the SolSensor Wireless PV Reference sensor mounted in the recommended location along the upper frame edge of a PV module. -
Page 36: Figure 17. Sol Sensor
2 Setting Up and Using the PVA-1000S and SolSensor CAUTION: SolSensor contains a sensitive irradiance measurement device that can be damaged by impact or abrasion. The irradiance sensor’s accuracy can also be compromised by soiling. Cover the irradiance sensor with the protective cap whenever it is not actually mounted and in use. -
Page 37: Figure 18. Sols
2 Setting Up and Using the PVA-1000S and SolSensor To mount SolSensor, follow these steps: Remove SolSensor, the Module Frame Clamp, and the tool lanyard from the soft case. Attach the tool lanyard to an eyelet on SolSensor. Then loop the lanyard around a racking member and clip it back on itself, as shown in Figure 17. -
Page 38: Figure 19. Tip Of Frame Clamp Properly Seated On Inside Surface Of Module Frame
2 Setting Up and Using the PVA-1000S and SolSensor Figure 19. Tip of frame clamp properly seated on inside surface of module frame Inspect the mounting and assure that the posts and blue ears are in contact with the upper edge of the module frame. If there is space under one or both of the blue ears, the irradiance sensor will not be in the plane of the array as desired;... - Page 39 2 Setting Up and Using the PVA-1000S and SolSensor polyester tape. Other types of tape will sag at high temperature, allowing the tip of the thermocouple to pull away from the backsheet of the module. Use firm pressure to roll the tape over the thermocouple tip, forcing the tip into intimate contact with the module backside.
-
Page 40: Figure 22. Pushbutton With
2 Setting Up and Using the PVA-1000S and SolSensor Figure 22. Pushbutton with LED lit. LED blinks until wireless network is established, after which it remains on. Optimizing wireless transmission range SolSensor has a line-of-sight transmission range of over 100 meters. Follow these practices to realize as much of that transmission range as possible. - Page 41 2 Setting Up and Using the PVA-1000S and SolSensor Mounting SolSensor on a tripod Tripod mounting allows more flexibility in locating SolSensor for best wireless range. Tripod mounting is also useful when it is not feasible to access the array. In this case you can set the PV Analyzer software to derive the module cell temperature from the measured I-V curve.
-
Page 42: Figure 23. Tripod Mounting Setup
2 Setting Up and Using the PVA-1000S and SolSensor Figure 23. Tripod mounting setup Chose a location to set up the tripod. Consider the following factors: Location should have an open view of the sky, similar to the array itself. - Page 43 FAILURE TO TAKE APPROPRIATE SAFETY PRECAUTIONS COULD LEAD TO PERSONAL INJURY OR LOSS OF LIFE. Following safe operating procedures, connect the PV leads of the PVA-1000S to the PV source to be measured. The connection can be made at the PV module itself, or at the ends of home run cables, or at a combiner box.
-
Page 44: Figure 24. Example Of Pva-1000S
2 Setting Up and Using the PVA-1000S and SolSensor are required, use the Solmetric PVA test leads. Figure 24. Example of PVA-1000S test leads clipped to the buss bars of a PV combiner box If the distance between the test device and the I-V Unit requires the use of extension cables, use rated PV cable with correctly installed connectors. -
Page 45: Figure 25. Powering - Up The I-V U
2 Setting Up and Using the PVA-1000S and SolSensor Powering-Up the I-V Unit NOTE: The I-V Unit can be turned on before or after starting the PC software, but the wireless USB adapter should be plugged into your PC prior to launching the PVA software. -
Page 46: P Rotection
Manually disabling the I-V Unit in this way will assure that an I-V measurement is not accidentally taken when it is not expected. WARNING If the LED on the PVA-1000S is illuminated (either solid on or flashing), do not connect or disconnect the PV leads. Over-Temperature Protection Built-in safeguards prevent the I-V Unit from operating at potentially damaging internal temperatures. -
Page 47: Operating Under High-Temperature Conditions
When the over-voltage condition is detected, the I-V Unit is immediately reprogrammed into a disabled state to prevent continued use of a damaged unit. Resetting or restarting the I-V Unit will not re-enable it. Please contact Solmetric to arrange for repairs. WARNING Severe over-voltage conditions can damage the I-V Unit input protection circuitry. -
Page 48: Rotection
2 Setting Up and Using the PVA-1000S and SolSensor Over-Current Protection If greater than 20 A dc is applied to the I-V Unit, the PVA-1000S detects the over-current condition and switches into disabled mode automatically and an I-V measurement does not take place. -
Page 49: Software Overview
3 Software Overview 3 Software Overview Using Projects The PV Analyzer stores all of your setup information and measurement results in a specialized Windows file type file type called a Project file. You can use the same Project file each time you measure the array, so that over time you will accumulate a history of the performance of the array. - Page 50 V curve graph only after you have identified the location of the measurement. Main Screen Overview The PVA-1000S software runs on a PC and is your interface for making measurements and storing, viewing, and exporting data. The main screen is shown below, with the Traces tab selected.
-
Page 51: Figure 27. File Menu
It is organized hierarchically as System\Inverter\Combiner\String IV Data (csv files). Only the last measurement result for each location in the array is exported. Data in this hierarchical format can be analyzed automatically by the Solmetric Data Analysis Tool, available as an accessory to the PVA-1000S. -
Page 52: Figure 28. The Site Info Screen Of The Figure 29. Roof Measurement
3 Software Overview New Project Clicking New Project… brings up the Site Info screen, shown in Figure 28. This is the first of two screens of the New Project Wizard. Figure 28. The Site Info screen of the New Project Wizard In this screen you will enter the latitude, longitude, and azimuth (the true compass heading toward which the PV modules are tilted). -
Page 53: Figure 30. Roof Measurement
3 Software Overview Figure 30. Roof Measurement Tool image of PV Site To find the building azimuth, follow these steps: Click on the lower left corner of the building Click on the lower right corner of the building Slide your cursor northward, creating a rectangle, and click to ‘freeze’ the rectangle. -
Page 54: Figure 32. The Arrayn
3 Software Overview When the latitude, longitude, and azimuth have been entered in the Site Info screen of the New Project Wizard, click Next to advance to the Array Navigator screen, shown in Figure 32. Figure 32. The Array Navigator screen of the New Project Wizard This screen is used to describe your PV system hardware. -
Page 55: Table 5. Change Module Screen
Click New... to create a new custom module by entering all of the module parameter values. In most cases, you will enter your custom parameters from the PV module datasheet. A full Solmetric PV Model features a much larger number of parameters. Please contact support@solmetric.com for additional guidance about working with the Solmetric model. -
Page 56: Figure 34. Array Navigators
3 Software Overview Creating the System Tree The next step is to create your system tree, an electrical description of the DC side of the PV system that you will be testing, like the example shown in the central area of this figure. -
Page 57: Table 6. Array Navigator Screen Description
3 Software Overview Table 6. Array navigator screen description Name Description The Autofill Tree icon accesses a form for you to specify the entire architecture of the PV system. This control is useful in simple cases where all the inverters are identical and the details of their arrays are the same. - Page 58 3 Software Overview Name Description The Add Combiner icon accesses a form for you to add another combiner at a level just below a selected inverter or combiner. Enter the number of strings and modules. The number of strings can differ from other combiners. The number of modules per string should match the rest of the combiners feeding a given inverter.
- Page 59 3 Software Overview Name Description These controls input the wire properties of conductors between the I-V Unit and the string or module under test. These values are used to account for the resistance of the conductors in the predictive PV model and have no effect on the actual measurement of the I-V curve.
-
Page 60: Figure 35. Properties Menu
3 Software Overview Name Description 10 AWG (0.1019 in, 2.588 mm) → 0.0009989 Ω/foot 12 AWG (0.0808 in, 2.053 mm) → 0.001588 Ω/foot 14 AWG (0.0641 in, 1.628 mm) → 0.002525 Ω/foot 16 AWG (0.0508 in, 1.291 mm) → 0.004016 Ω/foot The temperature of the wiring is not taken into account in calculating wire resistance. -
Page 61: Figure 36. Site Informations
3 Software Overview Site Info… Clicking on the Site Info… menu item brings up the following screen. Figure 36. Site Information Screen Use these controls to edit the latitude and longitude of your construction site, and the azimuth (true compass heading) of your PV modules. Alternatively, you can use the Roof Measurement Tool to update these values. -
Page 62: Figure 38. Utility Menu
3 Software Overview Utility Menu The Utility Menu provides access to housekeeping functions and miscellaneous tools. The Utility Menu is shown in Figure 38 and described in Table 7. Figure 38. Utility Menu Table 7. Utility menu description Name Description Enable manual Check this menu item to display, as shown here the controls for selecting sensor... - Page 63 SolSensor. From the drop down list, select the COM port that is followed by a “+” sign. NOTE – If the Wireless USB adapter is installed into the PC before starting the PVA-1000S software, the communication port is selected automatically. Battery Level…...
-
Page 64: Figure 39. Help Menu
3 Software Overview Help Menu Figure 39. Help Menu Table 8. Help menu description Name Description Connected Presents three types of information useful in certain product support Measurement situations: Devices... Firmware versions (code for the embedded computers) MAC address (unique identifiers of instruments in the network) ... -
Page 65: Figure 40. Traces Tab
3 Software Overview Using the Tab Screens The tabs along the left edge of the screen display measurement data in various ways. The paragraphs below explain how the features of each tab are used. Certain elements are common to more than one tab. These include the Status indicator, the Measure Now button, the Assign and Save... -
Page 66: Table 9. Traces Tab Description
3 Software Overview open circuit voltage V (0, V ). If the actual I-V curve goes through or near the predicted five points, then the array is functioning as predicted. The green shaded area indicates the maximum power point tracking (MPPT) voltage range of your selected inverter. - Page 67 3 Software Overview Name Description Measure Now Highlighted when the system is ready to start a new I-V measurement. Click this button to take a fresh measurement. Measuring (in Status indicator) During a measurement, the Measuring label blinks. Assign and Save Before the PV model points for a new measurement can be displayed on the I-V graph, the measurement must be Reassign...
- Page 68 3 Software Overview Name Description troubleshooting the problem. No USB Wireless When displayed, click on the question mark icon for information to aid in troubleshooting the problem. (indicator) No I-V Unit (in Status indicator) Displayed when communication between the I-V Unit and the USB wireless adapter at the PC is not established.
-
Page 69: Figure 41. Table Tab
3 Software Overview Name Description Summary Bar Located directly below the displayed I-V curve, the Summary Bar displays the results of the currently displayed measurement. The Performance Factor represents the measured maximum power value as a percentage of the value predicted by the PV model. -
Page 70: Table 10. Table Tab Description
3 Software Overview Table 10. Table tab description Name Description Predicted Displays the predicted values from the selected performance model. Measured Displays actual measured values most recently measured. Meas Translated to STC Displays a translation of the measured parameters to Standard Test Conditions, 1000W/m2 and 25 C . -
Page 71: Figure 42. History Tab
3 Software Overview The contents of the History table are saved in your Project file, but are not exported along with your I-V trace data. Figure 42. History tab Meg Test Tab This tab is used to record resistance measurement results obtained from a separate instrument such as the Megger MIT430 Insulation Resistance Tester. -
Page 72: Table 11. Meg Test Tab Description
This section describes the organization of the .csv (comma separated value) file that is created in your hard drive when you export measurements from the PVA software. PV Analyzer users typically analyze their measurement results using the Solmetric I-V Data Analysis Tool (DAT), which automates the analysis and reporting process. To use the DAT, you will first export your Project data from the PV Analyzer, and then import it into the DAT. -
Page 73: Figure 44. Headeri
3 Software Overview individual modules in the strings, the lower-level directories in your folder structure will contain the string I-V trace .csv files. When you use the Data Analysis Tool, you can import some or all of this data into the DAT for automated analysis and reporting by simply browsing to the desired level of the folder hierarchy. -
Page 74: Figure 45. The Measurement Vs
3 Software Overview Figure 45 shows the cardinal values of the measured and predicted I-V curves. The abbreviations represent maximum power, maximum power voltage and current, open circuit voltage, and short circuit current. Figure 45. The Measurement vs. Model section of the exported csv file Figure 46 shows the SolSensor Measurements section of the exported csv file, and the table that follows describes the contents. -
Page 75: Figure 47. Modeld
3 Software Overview Figure 47 shows the Model Details section of the exported csv file, and the table that follows explains the contents. Figure 47. Model Details section of the exported csv file Table 14. Description of the Model Details section of the exported csv file Item Description Irradiance used in model... -
Page 76: Figure 48. The Voltage , Current
3 Software Overview Item Description in % Latitude and Longitude The location on Earth where the measurement was made. Time zone The time zone in which the measurement was made. Model Mfr Manufacturer of the PV module Module Model Model number of the PV module # of Modules in String Number of modules connected measured in series. -
Page 77: Solsensor Irradiance Calibration
3 Software Overview Basis of PV Performance Predictions The PVA software predicts the electrical output of the PV source under test (module or string) based on the module performance model parameters, the existing irradiance and temperature, and a number of other factors. The following discussion outlines the process by which SolSensor is calibrated and measures irradiance, and the process by which the PVA software predicts the expected I-V curve. -
Page 78: Pva Prediction Of Electrical Output
3 Software Overview PVA Prediction of Electrical Output The PVA software compares the measured I-V curve to the predictions of built-in PV performance models. The prediction process involves these steps: User selects their PV module from the built-in database. ... -
Page 79: Making Measurements
Creating a New Project The following procedure shows how to set up the PVA-1000S software to measure a particular PV system, using the New Project wizard. -
Page 80: Start The Pva-1000S Software
The actual tilt of the module SolSensor is mounted on is reported by SolSensor and is saved with each I-V measurement. Start the PVA-1000S Software On the PC, double-click on the Solmetric PV analyzer icon to start the PVA- 1000S application. The Traces screen appears as shown below. Figure 49. Traces screen SolSensor does not need to be installed for creating a Project. -
Page 81: Enter The Site Information
Enter the Site Information You can enter the site information manually using the entry boxes, or click on Use the Roof Measurement Tool… to obtain the values using the Solmetric web based utility. If your site does not have a roof ridge or edge or other feature that you can use to identify the azimuth in the satellite image, you can still use the Roof Measurement Tool to return the latitude and longitude of your site, and enter the azimuth manually. -
Page 82: Figure 52. Measuring Your Roof Orientation
4 Making Measurements Use the map controls to zoom in on the roof plane of interest. The next step is to identify the orientation of the roof by drawing a line along the appropriate roof ridge or roof edge/eave. In this example, we draw our line along an eave that runs approximately east-west. -
Page 83: Select Pv Module
4 Making Measurements Figure 53. Second screen of the new project wizard, unpopulated Select PV Module Click on Select PV Module... and the Change Module screen appears, as shown in Figure 54. Figure 54. Change Module screen Select Factory to invoke model parameters from the built-in database. Click Manufacturer and select the manufacturer. -
Page 84: Create The System Tree
4 Making Measurements If your module make and model number are not in the equipment database, check that your database is updated. This is checked automatically each time you launch the PVA software when web connected. Click on OK. Create the System Tree After selecting your PV module, your Array Navigator screen will look similar to Figure 55. -
Page 85: Add A New Inverter
4 Making Measurements If you are using combiners, check the box. Click and enter the number of combiners per inverter. Click and enter the number of strings per combiner. Click and enter the number of modules per string. Click OK. Figure 57. -
Page 86: Add A New Combiner
4 Making Measurements Click in the Number of combiners per inverter (or combiner) field and enter the appropriate value. Click in the Number of strings per inverter field and enter the appropriate value. Click in the Number of modules per string field and enter the appropriate value. Click on the OK button. -
Page 87: Edit Wire Properties
4 Making Measurements Figure 60. Add string screen Click in the Number of modules per string field and enter the appropriate value. Edit Wire Properties The final step in creating your Project is to review and edit, if needed, the properties of the conductors that connect your PV string (or module) to the point at which the PV Analyzer I-V Unit is connected. -
Page 88: Creating A New Project That Is Similar To An Existing Project
Making Measurements See the following chapters for more detail on setting up the instrument and using the software: Chapter 2 Setting Up and Using the PVA-1000S and SolSensor 4-10... - Page 89 4 Making Measurements Chapter 3 Software Overview Follow these steps to make typical measurements. Set up and turn on your measurement system. If you want to be able to compare your measured I-V curves with the predictions of the built-in PV modules and save your results, create a Project before starting your measurements.
-
Page 90: Using The History Tab
4 Making Measurements 10. Repeat the measurement process for all of the strings (or modules) to be tested. . Using the History Tab The results of recent measurements are displayed in the table in the History tab. The table holds up to 20 measurements, with the most recent in the left column. Once the table is full, the table drops the oldest measurement to make room for the newest. -
Page 91: Troubleshooting Pva-1000S Operation
Troubleshooting of actual PV systems is not included in this discussion. Troubleshooting Using Status Messages Your main tool for troubleshooting PVA-1000S and its wireless link to your PC is the Status indicator, shown below. It appears in each of the measurement screens. The Status indicator indicates the state of the measurement system, and in some conditions clicking on the Status indicator will open a popup with additional information. - Page 92 I-V Unit. The results of this first measurement are not displayed. The optimizing process roughly doubles the time required to perform the first measurement only. "Measuring" message When "Measuring" appears in the Status indicator, the PVA-1000S is processing a measurement request and performing an I-V measurement. “Disabled” message If the message “Disabled”...
- Page 93 5 Troubleshooting PVA-1000S Operation I-V Unit is too hot In this case, clicking on the "Disabled" message pops up a caution message that the I-V Unit's internal temperature is too high and the protection circuit has shut it down. Move the unit to a cooler location out of the direct sun, and allow time for the measurement to drop.
-
Page 94: Troubleshooting By Symptom
5 Troubleshooting PVA-1000S Operation Troubleshooting by Symptom "No I-V Measurement Unit" message This message in the Status indicator (upper right corner of measurement screen) means that the I-V Unit is either turned off or is out of wireless communication range. - Page 95 5 Troubleshooting PVA-1000S Operation I-V curve does not reach down to the X-axis This type of trace may be seen if you have been measuring strings or modules with a certain level of current and voltage, and then switch to measuring devices that have much higher or lower currents or voltages.
- Page 96 5 Troubleshooting PVA-1000S Operation This page left blank intentionally.
-
Page 97: Measuring Irradiance, Temperature, And Tilt
6 Measuring Irradiance, Temperature, and Tilt 6 Measuring Irradiance, Temperature, and Tilt Introduction Thorough evaluation of array performance by any measurement method (I-V curve tracing or conventional methods) always involves comparing measured I-V data to some form of reference. That reference may be anything from a simple STC capacity value to a detailed PV performance model. -
Page 98: Table 15. Sensor Choices
Surface and material issues limit the accuracy of infrared temperature measurements. These topics are all discussed in this chapter. The PVA-1000S provides multiple methods for measuring irradiance, temperature, and tilt, as shown in Table 15. Table 15. Sensor Choices Irradiance... -
Page 99: Measuring Irradiance With Solsensor
6 Measuring Irradiance, Temperature, and Tilt Measuring Irradiance with SolSensor SolSensor irradiance sensor SolSensor irradiance sensing element is a silicon photodiode with temperature correction. Its spectral response is corrected to match silicon solar cells and its angular response is corrected to provide enhanced accuracy over a broader part of the day. Preliminary Irradiance SolSensor is software corrected for sun angle effect to provide superior accuracy over a wider range of sun hours. -
Page 100: Orienting And Mounting The Irradiance Sensor
6 Measuring Irradiance, Temperature, and Tilt Orienting and mounting the irradiance sensor To provide a valid reference irradiance value, the sensor must be mounted in the plane of the array. This assures that the PV modules and the irradiance sensors present the same proportion of their area to the sun at all times of day (a cosine effect) and that reflective albedo effects are as similar as possible. -
Page 101: Determining Irradiance From The Measured I-V Curve
6 Measuring Irradiance, Temperature, and Tilt SolSensor irradiance sensor is corrected for angular effects. One of the benefits of this correction is better performance under diffuse light conditions. Determining Irradiance from the Measured I-V Curve When you select the From I-V option, the PVA software calculates irradiance from the measured I-V curve. -
Page 102: Measuring Pv Module Backside Temperature With A Thermocouple
6 Measuring Irradiance, Temperature, and Tilt A greater and more variable time delay between the I-V curve and irradiance measurements translates into irradiance error under conditions of rapidly changing irradiance. Hand-held irradiance sensors may have poor accuracy, especially in their cosine response. -
Page 103: Selecting A Thermocouple Wire Gauge
This tape is also available from Solmetric in spools of 1.75 inch disks for added convenience. Do not use cheap duct tape, as it sags when hot, allowing the thermocouple tip to pull... -
Page 104: Attaching The Thermocouple To The Module Backside
6 Measuring Irradiance, Temperature, and Tilt Attaching the thermocouple to the module backside Cut a fresh 2” length of tape, or use a fresh tape disk. Place the thermocouple bead in the center of the tape. Press the tape firmly against the backside of the PV module, applying pressure first over the thermocouple, then over the thermocouple lead, and then press down the rest of the tape. -
Page 105: Measuring Pv Module Temperature With An Infrared Thermometer
6 Measuring Irradiance, Temperature, and Tilt Measuring PV module temperature with an infrared thermometer Some competing measurement solutions rely on infrared measurements of module temperature. This approach has serious limitations, which are discussed here because the PVA software allows the user to manually enter temperature values from hand-held sensor devices. -
Page 106: D Etermining C Ell T Emperature From The M Easured I-V C Urve
6 Measuring Irradiance, Temperature, and Tilt Determining Cell Temperature from the Measured I-V Curve When you select the From I-V option, the PVA software calculates the equivalent cell temperature from the measured I-V curve. This option has several benefits and several limitations, all due to the fact that since temperature is calculated mainly from the measured V and the resulting temperature value is an input to the PV model, the model... -
Page 107: Using Smarttemp To Measure Cell Temperature
6 Measuring Irradiance, Temperature, and Tilt Using SmartTemp to Measure Cell Temperature The SmartTemp method uses a blend of the From I-V and backside thermocouple methods, taking best advantage each while avoiding their biggest limitations. The blend changes as a function of irradiance: ... - Page 108 6 Measuring Irradiance, Temperature, and Tilt This page left blank intentionally. 6-12...
-
Page 109: Interpreting Measured I-V Curves
For the prediction to be valid, the inputs to the model must be valid. The model inputs are: PV model parameters stored in the PVA-1000S PC software Number of PV modules in series ... -
Page 110: I-V Curve Terminology
7 Interpreting Measured I-V Curves An inverter database is included in the PVA software only to display the inverter's max power tracking range on the I-V curve graph. The inverter characteristics do not affect the measurement of the I-V curves and are not used in creating the PV model. I-V Curve Terminology These abbreviations will be used in the following discussion: ... -
Page 111: The Shape Of A Normal I-V Curve
7 Interpreting Measured I-V Curves technology has its own nominal range of fill factor values, and each module model number typically has an even narrow nominal range. Figure 63. Definition of the Fill Factor. Fill Factor does not very much with irradiance so long as the irradiance is high, which means that comparing Fill Factor values is a good way to assess the consistency of I-V curve shapes in variable (but high) irradiance situations. -
Page 112: Interpreting I-V Curves
7 Interpreting Measured I-V Curves Figure 64. A normal I-V curve for the parallel combination of two strings of eight 175-watt modules, showing conformance with five points predicted by the PV model. A normal I-V curve has a smooth shape with three distinct voltage regions as shown in Figure 64: A slightly sloped region above 0 V (the horizontal leg of the curve) A steeply sloped region below V... -
Page 113: Figure 65. Deviations In The Shape Of The
7 Interpreting Measured I-V Curves Figure 65. Deviations in the shape of the I-V curve fall into one (or a combination) of these six categories It would be convenient if each of the I-V curve deviations illustrated in Figure 65 corresponded to a unique physical cause. -
Page 114: Notches Or Steps
7 Interpreting Measured I-V Curves 1. Notches or steps Examples of this type of deviation are shown in Figure 66, Figure 67, and Figure 68. Figure 66. The effect of partial shading on a string I-V curve. -
Page 115: Figure 67. The Shading Impact Of Placing A Business Card On A Single Cell In A String Of Fifteen
7 Interpreting Measured I-V Curves Figure 67. The shading impact of placing a business card on a single cell in a string of fifteen 180-watt modules Figure 68. The effect of intentionally shading entire modules in different combinations, in two parallel-connected strings NOTE The graphic shown in Figure 68 is an overlay of several I-V curve measurements. -
Page 116: Array Is Partially Shaded, Or Non-Uniform Soiling Or Debris Is Present
7 Interpreting Measured I-V Curves Bypass diode is short-circuited Array Is Partially Shaded, or non-uniform soiling or debris is present Partial shading of a PV cell reduces the current capacity of that cell, which in turn reduces the maximum current that can be produced by other series connected cells. For example, slightly shading one cell in a 72 cell module that has 3 bypass diodes will slightly reduce the current in 24 cells. -
Page 117: Low Current
7 Interpreting Measured I-V Curves 2. Low Current Potential causes for the measured I being higher or lower than predicted are summarized below, and then discussed in more detail. Potential causes located in the array include: Uniform soiling Strip shade ... -
Page 118: Module Degradation
7 Interpreting Measured I-V Curves bottom row of cells, it begins to limit current. If the dirt bands are similar enough from module to module, the effect is like uniform soiling. Module Degradation Degradation of PV module performance with time and environmental stress is normally a very slow process. -
Page 119: Irradiance Is Too Low, Or The Sun Is Too Close To The Horizon
7 Interpreting Measured I-V Curves reflection seen by the PV modules under test is the same for all modules, the I-V curve may look normal but I may be elevated. If the reflection is not uniform from module to module, the I-V curve may have a mismatch type of shape, discussed later. Irradiance Is Too Low, or the Sun Is Too Close to the Horizon Most PV modules exhibit changes in the shape of their I-V curves under low light conditions. -
Page 120: Low Voltage
7 Interpreting Measured I-V Curves 3. Low voltage An example of this type of deviation is shown in below. Figure 69. Measurement with less steep than predicted slope in the vertical leg of the I-V curve. Potential causes are summarized below, and then discussed in more detail. Potential causes located in the array include: ... -
Page 121: One Or More Bypass Diodes Are Conducting Or Shorted
7 Interpreting Measured I-V Curves value of V that the PVA-1000S lists in the table display. This value is measured under open circuit conditions, just a moment before the I-V measurement actually begins. One or More Bypass Diodes Are Conducting or Shorted Failure modes within individual PV modules may cause a bypass diode(s) to conduct even in the absence of shade or severe module-to-module mismatch. -
Page 122: Rounder Knee
7 Interpreting Measured I-V Curves 4. Rounder knee An example of this type of deviation is shown below. Figure 70. I-V curve measurement showing rounder knee than predicted by the PV model. Rounding of the knee of the I-V curve can be a manifestation of the aging process. Before concluding that this is the case, check the slopes of the horizontal and vertical legs of the I-V curve. -
Page 123: Steeper Slope In Horizontal Leg
7 Interpreting Measured I-V Curves 5. Steeper slope in horizontal leg An example of this deviation is shown below. Figure 71. An I-V curve showing steeper slope in the horizontal leg of the I-V curve. The horizontal leg of the I-V curve may exhibit a steeper slope than the PV model predicts. -
Page 124: Module I Mismatch
7 Interpreting Measured I-V Curves shunts increases proportionally, causing the slope of the I-V curve near I to become steeper. The shunt current in a series of modules or within a single module can be dominated by a single hotspot on a single cell, or may arise from several smaller shunt paths in several series cells. -
Page 125: Less Steep Slope In Vertical Leg
The resistance of the primary test leads of the PV analyzer is extremely low and can be neglected. The resistance of the Solmetric Test Lead kit can also be neglected. Using smaller-gauge test leads can add significant resistance and corresponding measurement error. -
Page 126: Electrical Interconnections In The Array Are Resistive
7 Interpreting Measured I-V Curves Electrical Interconnections in the Array Are Resistive Electrical connections anywhere along the current path can add resistance to the circuit. Assure that connectors between modules are fully inserted. Also check for signs of corrosion in J-boxes and combiners. Series Resistance of PV Modules Has Increased Certain degradation mechanisms can increase the amount of series resistance of a particular module. -
Page 127: Translation Of I-V Data To Standard Test Conditions
8 Translation of I-V Data to Standard Test Conditions 8 Translation of I-V Data to Standard Test Conditions The PVA-1000S PC software provides a feature for translating the displayed I-V curve to and 25 C. The software also translates the Standard Test Conditions (STC) of 1000W/m key performance parameters in the Table view (tab). -
Page 128: Definition Of The Translation Process
8 Translation of I-V Data to Standard Test Conditions reference condition, I . Using these (%/°C) units makes the same value applicable for both individual modules and for parallel strings of modules. α = Normalized temperature coefficient for I , (%/°C). Normalized in the same manner as α... - Page 129 8 Translation of I-V Data to Standard Test Conditions mptrans trans )] / {1+ γ /100*(T * [ln(E ) / ln(E mptrans trans trans ] / {1+ γ /100*(T * [E mptrans mpmeas trans trans...
Need help?
Do you have a question about the PVA-1000S and is the answer not in the manual?
Questions and answers