Solmetric PVA-1500S User Manual
Pv analyzer i-v curve tracer
Hide thumbs
Also See for PVA-1500S:
- Quick reference card (2 pages) ,
- User manual (152 pages) ,
- User manual (128 pages)

Related Manuals for Solmetric PVA-1500S


Summary of Contents for Solmetric PVA-1500S
- Page 1 Solmetric PV Analyzer I-V Curve Tracer PVA-1500S with SolSensor 300 PVA-1000S with SolSensor ™ PVA-600 with SolSensor ™ User’s Guide...
- Page 2 Software Title Part No. 600-90001 Solmetric remains the owner of all right, title and interest in Version 4.0 the PC Software, Embedded Software, and Documentation. June 2018...
- Page 3 ANY DAMAGES, INCLUDING ANY LOST PROFITS, warranted against defects in materials and workmanship for LOST SAVINGS, INJURY, DEATH, OR OTHER a period of one year. During the warranty period, Solmetric INCIDENTAL OR CONSEQUENTIAL DAMAGES will, at its option, either repair or replace products which ARISING FROM THE USE OF OR THE INABILITY TO prove to be defective.
- Page 4 This license agreement may be modified only in writing and written documentation must be signed by Buyer and Solmetric. In the event of litigation between Buyer and Solmetric concerning the PC Software, Embedded Software, Hardware, or Documentation, the prevailing party in the litigation will be entitled to recover attorney fees and expenses from the other party.
-
Page 5: Table Of Contents
................................1-1 VERVIEW ....................1-2 OMPUTER INIMUM YSTEM EQUIREMENTS ................................1-2 QUIPMENT Curve Tracer Equipment (PVA-1500S, PVA-1000S, PVA-600 ) ..............1-3 SolSensor Equipment ............................1-3 ..............................1-4 PECIFICATIONS PVA-1500S Specifications ..........................1-4 PVA-1000S Specifications ..........................1-5 PVA-600 Specifications ..........................1-6 SolSensor 300 Specifications .......................... - Page 6 SolSensor Installation Procedure ........................1-29 ............................ 1-30 HARGING THE ATTERY Charging the Battery on the PVA-1500S I-V Measurement unit ..............1-30 Charging the SolSensor 300 Battery ....................... 1-30 Charging the Battery on the PVA-1000S and PVA-600 I-V Measurement Unit .......... 1-31 Charging the SolSensor Battery of the Original SolSensor ................
- Page 7 3 SOFTWARE OVERVIEW ..........................3-1 ..............................3-1 SING ROJECTS ............................3-2 SING THE YSTEM ............................3-2 CREEN VERVIEW ................................3-3 File Menu ................................3-3 Browse Project ............................. 3-3 Recent Projects ............................. 3-3 Export Trace for Active Measurement ......................3-3 Export Traces for Entire System ........................3-3 Export Meg Test Data ..........................
- Page 8 Insert the wireless USB adapter (PVA-1000S and PVA-600+) ................ 4-3 Mount SolSensor ............................... 4-3 Attach SolSensor’s thermocouple ........................4-3 Turn on the I-V Measurement Unit, and connect wirelessly to your PC ............4-4 Turn on SolSensor ............................4-4 Prepare the PV source circuits for measurement ....................4-4 Connect the test leads to the PV equipment ......................
- Page 9 Array Is Partially Shaded, or non-uniform soiling or debris is present ............. 7-8 PV Cells Are Damaged ............................. 7-8 Cell String Conductor Is Short Circuited ......................7-8 2. L ..............................7-8 URRENT Uniform soiling ..............................7-9 Strip shade ................................ 7-9 Dirt dam ................................
- Page 10 16. N ............................. 1-34 IGURE ETWORK ICON 17. N ..........................1-34 IGURE ETWORK DIAGRAMS 18. LED- PVA-1500S I-V M )..... 2-1 IGURE ILLUMINATED BUTTON SWITCH SHOWN FOR THE EASUREMENT 19. S ................. 2-5 IGURE ENSOR MOUNTED ON THE FRAME OF A MODULE 20.
- Page 11 ABLE ENSOR SPECIFICATIONS 6. D PC, PVA, ........1-35 ABLE IRECT AND INDIRECT WIRELESS LINKS BETWEEN ENSOR 7. I-V O PVA-1500S ..................2-2 ABLE PERATIONAL TATES OF THE 8. I-V O PVA-1000S & 600 ................2-3 ABLE PERATIONAL TATES OF THE 9.
- Page 12 This page left blank intentionally.
-
Page 13: Getting Started
I-V Measurement Units and SolSensor. The Solmetric PV Analyzer is a portable electrical test instrument designed for commissioning and troubleshooting PV arrays. It measures the current-voltage (I-V) curves of PV modules and strings and immediately compares the results to the predictions of built-in PV models. -
Page 14: Computer Minimum System Requirements
1 Getting Started NOTE Version 4.x PVA software, which supports the PVA-1500S and SolSensor 300, will not operate the PVA-1000S, PVA-600+, or earlier hardware. Version 4.x software will not add new measurements to a Project created on version 3.x software. However, version 4.x software will open version 3.x Project files, and will display and export their data. -
Page 15: Curve Tracer Equipment (Pva-1500S, Pva-1000S, Pva-600 )
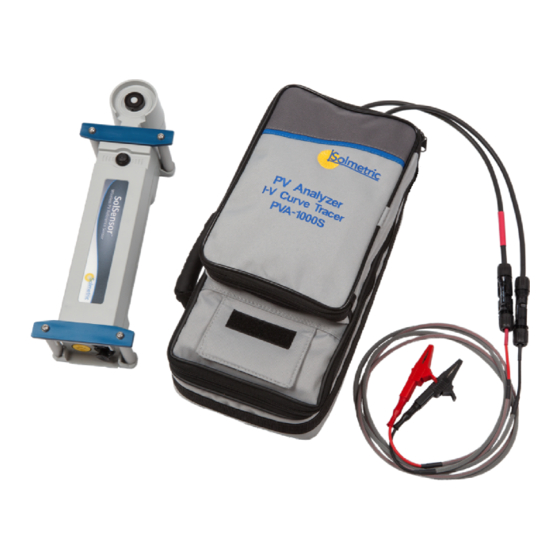
1 Getting Started Curve Tracer Equipment (PVA-1500S, PVA-1000S, PVA-600 I-V Measurement Unit Soft Case Wireless USB Adapter (not required or provided with PVA-1500S) PVA Software Application (available at http://www.solmetric.com/downloads- pva.html) AC Wall Plug Charger ... -
Page 16: Specifications
1 Getting Started Specifications PVA-1500S Specifications Safety Rating: Measuring Category CAT III 1500V. Table 1. PVA-1500S electrical and mechanical specifications Parameter Specification Voltage range 0 – 1500 V Current range 0 – 30 A Voltage accuracy (0 to 45C) ±0.5% ±0.25 V Current accuracy (0 to 45C) ±0.5% ±0.04 A... -
Page 17: Pva-1000S Specifications
1 Getting Started Parameter Specification Weight 6.6 kg (including soft case, test leads & charger) Height 38 cm (not including primary PV leads) Width 20 cm (not including handle) Depth 13 cm (not including gear pouch) Conventional PV modules and strings may be measured in parallel, up to the current limit specified here. -
Page 18: Specifications
1 Getting Started Parameter Specification Operating temperature range -10 to +65ºC Storage temperature range -20 to +65ºC Operating humidity <90% RH, non-condensing. Avoid exposing a cold instrument to warm and humid air as condensation will result. Store the instrument in the same conditions in which it will be used. -
Page 19: Solsensor 300 Specifications
1 Getting Started Parameter Specification Measurement Sweep Time 50 ms to 240 ms Measurement Points per Trace (typical) Wireless Communications Range 10 m typical, open line of sight Battery Life ≈20 hours (normal use) Charging Time 6 hours Operating Temperature +0 to +50ºC Storage Temperature -20 to +60ºC... - Page 20 Parameter Specification Accuracy Typically, ±2% when used to predict the performance of well characterized poly- and monocrystalline PV modules in mid-day direct sun conditions. Contact Solmetric Application Engineering for more information on accurate irradiance measurements. Resolution 1 W/m Measurement interval 0.1 s (Measurement bandwidth approximately...
-
Page 21: Solsensor (Original) Specifications
0 – 1,500 W/m Accuracy Typically, ±2% when used to predict the performance of well characterized poly- and monocrystalline PV modules in mid-day direct sun conditions. Contact Solmetric Application Engineering for more information on accurate irradiance measurements. Resolution 1 W/m Measurement interval 0.1 s (Measurement bandwidth approximately... - Page 22 1 Getting Started Parameter Specification Tilt Sensor type Electronic Measurement range 0 – 90 deg from horizontal Accuracy (0 – 45 deg tilt) ±2 deg (typical) General Measurement synchronization with I-V Typically, less than 1s curve Wireless range (open line of sight) 10m US only.
-
Page 23: Safety And Regulatory
Declaration of Conformity A declaration of conformity is available upon request. Cleaning To remove dirt or dust from the external case and/or hard enclosure of the PVA-1500S, use a dry or slightly dampened cloth only. WARNING To prevent electrical shock, disconnect the PVA-1500S from the PV system and/or battery charger before cleaning. -
Page 24: Pva-1000S Safety And Regulatory
1 Getting Started This symbol indicates separate collection for electrical and electronic equipment, mandated under EU law as of August 13, 2005. All electrical and electronic equipment are required to be separated from normal waste for disposal. (Reference WEEE Directive, 2002/96/EC.) The IEC HV symbol indicates the presence of hazardous voltages. -
Page 25: Safety And Regulatory
1 Getting Started The C-tick mark is the manufacturer's declaration that the product complies with the EMC regulations of Australia and New Zealand. The instruction manual symbol. The product is marked with this symbol when it is necessary for you to refer to instructions in the manual. This symbol indicates separate collection for electrical and electronic equipment, mandated under EU law as of August 13, 2005. -
Page 26: Solsensor 300 Safety And Regulatory
1 Getting Started The PVA-600 have the following markings on the front and/or rear panel. Familiarize yourself with these markings before operating the PVA-600 The instruction manual symbol. The product is marked with this symbol when it is necessary for you to refer to instructions in the manual. -
Page 27: Instrument Markings
1 Getting Started The irradiance sensor (white disc) is cleaned using a more carefully controlled process, to avoid damaging the irradiance sensor. See the SolSensor 300 Precautions/Cleaning section for details. WARNING To prevent electrical shock, disconnect SolSensor 300 from the battery charger before cleaning. -
Page 28: Cleaning
1 Getting Started Cleaning To remove dirt or dust from the SolSensor enclosure, use a dry or slightly dampened cloth only. The irradiance sensor (white disc) is cleaned using a more carefully controlled process, to avoid damaging the irradiance sensor. See the SolSensor Precautions/Cleaning section for details. -
Page 29: Precautions
PV connectors. The connector-saver jumpers are intended to take wear and tear, greatly extending the life of the PVA-1500S PV circuit and test lead connectors. Leave the connector-saver jumpers in place at all times. - Page 30 I-V Unit before connecting or disconnecting the test leads of the PVA-1500S. Do not use the PVA-1500S to test devices that produce more than the instrument’s specified maximum current and voltage. Connect the test leads to the test device (PV module, string, or array) with the correct polarity.
-
Page 31: Battery Precautions
Battery Precautions CAUTION The PVA-1500S contains a small lithium battery and should not be disposed of with general refuse. Dispose of the battery in accordance with all local codes and regulations for products containing lithium batteries. Contact your local environmental control or disposal agency for further details. -
Page 32: Pv/Electrical Safety Precautions
1 Getting Started Using the connector-saver jumpers as described here will extend the life of the PVA- 1000S PV connectors by 100 times. PV/Electrical Safety Precautions Installed PV systems are not consistent in design or construction. Therefore, the guidance provided in this section is general in nature, and it is critical that you apply techniques and precautions appropriate to the circumstances, following best PV/electrical safety precautions. -
Page 33: Battery Precautions
, which are rated only to 600v. WARNING Do not remove instrument covers. There are no user serviceable parts within. Operation of the instrument in a manner not specified by Solmetric may result in personal injury or loss of life. ... -
Page 34: Pv/Electrical Safety Precautions
Replace them with fresh connector-saver jumpers, which can be ordered from Solmetric. Using the connector-saver jumpers as described here will extend the life of the PVA-600 PV connectors by 100 times. -
Page 35: Battery Precautions
WARNING Do not remove instrument covers. There are no user serviceable parts within. Operation of the instrument in a manner not specified by Solmetric may result in personal injury or loss of life. Do not use the I-V Measurement Unit if it is damaged. Always inspect for damage before using. -
Page 36: Solsensor And Solsensor 300 Precautions
SolSensor contains a small lithium battery and should not be disposed of with general refuse. Dispose of the battery in accordance with all local codes and regulations for products containing lithium batteries. Contact your local environmental control or disposal agency for further details. WARNING Only use the battery charger supplied by Solmetric. 1-24... -
Page 37: Installation Procedure
USB flash drive or run setup.exe from the Run dialog. Alternately, the installation file is available at http://www.solmetric.com/downloads-pva.html. Figure 1. Welcome screen Follow the instructions in the welcome screen to install the PVA software. The drivers for the wireless USB adapter will also be installed. -
Page 38: Figure 2. Prerequisites Dialog
Partway through the installation of the PVA-1000S or PVA-600+, the following screen will appear, asking you to insert the wireless USB adapter that will communicate with the I-V Unit. NOTE The wireless USB installation is not required for PVA-1500S. Go to step 9. 1-26... -
Page 39: Figure 4. Insert Wireless Usb Adapter Dialog
1 Getting Started Figure 4. Insert wireless USB adapter dialog Insert the wireless USB adapter shown below. NOTE If you are working with a PVA-1000S or PVA-600 and the Wireless USB Adapter is not available, you can complete the basic software installation by clicking Cancel. You will be asked whether the software installed correctly. -
Page 40: Figure 6. Installation Complete Dialog
1 Getting Started Figure 6. Installation complete dialog 10. If the Run Solmetric PV analyzer box is selected, the PVA software will launch when you click Finish. Alternately, you can start the PVA software by double- clicking on the shortcut icon on your desktop as shown in Figure 7. Or, select the list of programs in the Start menu, then select Solmetric >... -
Page 41: Updating The Pv Equipment Databases
If your PC is connected to the internet when you start the PVA software, the software will check whether updated PV module or inverter equipment databases are available to be downloaded from Solmetric. Downloading takes only a few moments, and you do not need to restart your computer. -
Page 42: Charging The Battery
1 Getting Started Charging the Battery Charging the Battery on the PVA-1500S I-V Measurement unit The battery in the I-V Unit is not removable. It may be recharged by attaching the battery charger to the connector on the I-V Unit shown in Figure 11Figure 13 and plugging the charger into an AC wall-plug. -
Page 43: Charging The Battery On The Pva-1000S And Pva-600
1 Getting Started Figure 12. Charger connected If you are using SolSensor heavily, we suggest you charge it each night. There is no indicator on SolSensor to indicate that it is charging. Charging the Battery on the PVA-1000S and PVA-600 Measurement Unit The battery in the I-V Measurement Unit is not removable. -
Page 44: Charging The Solsensor Battery Of The Original Solsensor
There is no indicator on SolSensor to indicate that it is charging. Your Wireless Network Your PVA-1500S/SolSensor 300 Wireless Network Communication between your PC and the I-V Measurement Unit is by conventional WiFi. The I-V Unit creates a hotspot when you turn it on. Just find that hotspot in your PC's network list and connect to it. -
Page 45: Your Pva-1000S/600 /Solsensor Wireless Network
To avoid this limitation, you can add a USB Wi-Fi adapter as the second network interface. When you are using the PVA-1500S and the WiFi link to the I-V Unit hotspot temporarily drops, there is some chance that the PC will attempt to automatically connect with another frequently-used network that is set up in your network list to connect automatically. -
Page 46: Figure 17. Network Diagrams
1 Getting Started equipment working nearby. To avoid confusion and communications problems, avoid mixing the components between PVA systems. To see a diagram of the network, click on the network icon at the lower left corner of your measurement screen, as shown in Figure 16. Figure 16. -
Page 47: Table 6. Direct And Indirect Wireless Links Between Pc, Pva, And Solsensor
1 Getting Started Table 6. Direct and indirect wireless links between PC, PVA, and SolSensor Communication route Interface to I-V Interface to SolSensor Measurement Unit PC to I-V Measurement Unit Direct PC to SolSensor Direct PC to I-V Measurement Unit to Direct Indirect SolSensor... - Page 48 1 Getting Started This page left blank intentionally. 1-36...
-
Page 49: Setting Up And Using The I-V Measurement Unit And Solsensor
PVA-1000S/600+, and differences in the networks themselves. When the PVA-1500S is turned on, it creates a Wi-Fi hotspot to which you will connect your PC by selecting it on your PC’s network list. When the PVA-1000S or PVA-600+ is turned on, it searches for the matched Wireless USB Adapter. -
Page 50: Operational States Of The Pva-1500S I-V Measurement Unit
If the network connection is lost, the LED blinks rapidly to indicate it’s trying to establish a network. It should reconnect within 20-30 seconds. If it is necessary to reset either the PVA-1500S I-V Unit or the SolSensor 300, just hold the LED pushbutton down for 5 seconds and release. Following the reset, the instruments... -
Page 51: Table 8. I-V Operational States Of The Pva-1000S & 600
2 Setting Up and Using the I-V Measurement Unit and SolSensor Operational States of the PVA-1000S & 600 I-V Measurement Unit Table 8 describes the operational states of this instrument. The table is an abbreviated guide, and more detailed descriptions follow. Table 8. -
Page 52: Setting Up The I-V Measurement Unit
Connect the Wireless USB adapter to a USB port in your computer. This step is not necessary for PVA-1500S because communication is by WiFi. If you will be using the Solmetric SolSensor, refer to Setting Up SolSensor for setup information. -
Page 53: Mounting Sol Sensor To Apv Module Frame
2 Setting Up and Using the I-V Measurement Unit and SolSensor Figure 19. SolSensor mounted on the frame of a PV module CAUTION: SolSensor contains a sensitive irradiance measurement device that can be damaged by impact or abrasion. The irradiance sensor’s accuracy can also be compromised by soiling. -
Page 54: Figure 20. Sol Sensor
2 Setting Up and Using the I-V Measurement Unit and SolSensor Figure 20. SolSensor tool lanyard secured to a racking member. To mount SolSensor, follow these steps: Remove SolSensor, the Module Frame Clamp, and the tool lanyard from the soft case. -
Page 55: Figure 22. Tip Of Frame Clamp Properly Seated On Inside Surface Of Module Frame
2 Setting Up and Using the I-V Measurement Unit and SolSensor of the frame as shown in Figure 22 and not on a shelf or ridge from which it could slip, allowing SolSensor to come loose. Squeeze the clamp mechanism until SolSensor is firmly held against the side of the module frame. - Page 56 The SolSensor 300 links to the PVA-1500S I-V unit, which relays its communications with the PC. Make sure the I-V Unit is turned on.
-
Page 57: Optimizing Wireless Transmission Range
Tripod mounting is also useful when it is not feasible to access the array. In this case you can set the PV Analyzer software to derive the module cell temperature from the measured I-V curve. To deploy SolSensor on a tripod, you will need the following support@solmetric.com equipment (contact for specific equipment recommendations):... -
Page 58: Figure 26. Tripod Mounting Setup
2 Setting Up and Using the I-V Measurement Unit and SolSensor Tripod level indicator This is typically a disc with a bubble level that mounts between the tripod and the rest of the fittings described here. Some tripods have a built-in level indicator. -
Page 59: Connecting To The Solar Pv Equipment
A thermocouple extension cable may be useful; contact support@solmetric.com for recommendations. Fully spread the legs of the tripod and seat them firmly. -
Page 60: Figure 27. Example Of I-V M
Connect the Solmetric PVA test leads to the string to be measured. In some cases, you can attach an alligator clip to the fuse clip, using it as a test point. -
Page 61: Powering-Up The I-V Measurement Unit
2 Setting Up and Using the I-V Measurement Unit and SolSensor system voltage, with correctly installed connectors. Select a wire gauge that will result in a suitably small voltage drop. When extension cables are longer than 10 feet (one-way), lay the cables close to one another to minimize added cable inductance. -
Page 62: I-V Measurements
2 Setting Up and Using the I-V Measurement Unit and SolSensor I-V Measurements The I-V Measurement Unit will measure an I-V curve each time you click on the Measure Now button. I-V data is transmitted to the PC shortly after each I-V sweep is taken. -
Page 63: Thermal Capacity Of The Pva-1500S
2 Setting Up and Using the I-V Measurement Unit and SolSensor Thermal Capacity of the PVA-1500S The thermal capacity of the PVA-1500S is the number of I-V measurements that can be made before the maximum allowable internal temperature is reached. Thermal capacity decreases with higher Voc, higher outdoor ambient temperatures, and shorter wait time between measurements. -
Page 64: Pva-1000S Over-Voltage Protection
If a voltage more than 1500 V is detected, the I-V Measurement Unit is immediately reprogrammed into a disabled state to prevent continued use of a damaged unit. Resetting or restarting the I-V Measurement Unit will not re-enable it. Please contact Solmetric to arrange for repairs. -
Page 65: Software Overview
3 Software Overview 3 Software Overview Using Projects The PV Analyzer stores all of your setup information and measurement results in a specialized Windows file type file type called a Project file. The PV Analyzer software guides you through the steps of creating a Project for a particular array. -
Page 66: Using The System Tree
3 Software Overview and adjusts your computer's clock as needed. Choose the time zone and daylight savings setting. All dates and times associated with the saved measurement data are preserved even if the Project is subsequently opened in another time zone. Using the System Tree The PV Analyzer provides a very efficient means of saving your data. -
Page 67: Menu Bar
Exports the measurement results for the currently loaded Project, as a Windows folder tree. It is organized hierarchically as System\Inverter\Combiner\String IV Data (csv files). Only the last measurement result for each location in the array is exported. Data in this hierarchical format can be analyzed automatically by the Solmetric Data Analysis Tool. -
Page 68: Export Meg Test Data
3 Software Overview Export Meg Test Data Exports the Meg test data as a .csv file, for the currently loaded project. New Project Clicking New Project… brings up the Site Info screen, shown in Figure 31. This is the first of three screens of the New Project Wizard. Figure 31. -
Page 69: Figure 33. Roof Azimutht
3 Software Overview Figure 32. Roof Azimuth Tool The Roof Azimuth Tool returns the latitude and longitude of your site. If your array is aligned with the edge of a building or other satellite-visible edge (such as a road or fence line), the Tool can also return the azimuth of your array. -
Page 70: Figure 34. Finding The Azimuth
3 Software Overview toward the southern-most edge of the roof. Note: In these images, azimuth values are ‘true’, not ‘magnetic’. 1. Click on the Azimuth Tool button. 2. Left-click (in this example) the northwest corner of the main roof. 3. Slide your cursor downward and left-click a second time at the southwest corner of the main roof. -
Page 71: Figure 35. Finding Your Site
3 Software Overview Figure 35. Finding your site’s latitude and longitude using the Offline List feature. Start by typing the name of your country. Once you have found and selected it, repeat the process until you have selected the nearest city. Then click OK and the latitude and longitude of that city will be copied into the Site Info screen. -
Page 72: Figure 37. Settings For A Horizontal Single
3 Software Overview Figure 37. Settings for a horizontal single-axis tracking system. The final step in the Site Info screen is to make sure that your PC clock is set correctly. These parameters include the time, date, and time zone. Each measurement you make is stamped with the technician’s PC’s values of time, date, CAUTION and time zone. -
Page 73: Selecting Your Pv Module
3 Software Overview Figure 39. The PV Module screen of the New Project Wizard. Selecting your PV Module Selecting your PV module (Figure 39) makes the module's performance parameters available to the Project so that the software can calculate the expected I-V curve and the Performance Factor. -
Page 74: Creating The System Tree
3 Software Overview Review the 17 parameter values. If edits are needed, used the pencil icon buttons to enter the correct information. After editing, you have the option of renaming that module and saving it in the custom equipment folder. Creating the System Tree When you have finished selecting or editing your PV module, click Next to advance to the final step in the New Project Wizard, shown in Figure 41. -
Page 75: Using The Symmetrical Tree Builder
3 Software Overview The process of creating your tree has two parts. First, use the Symmetrical Tree Builder screen (shown in Figure 43) to create the basic structure of the tree. If it is a large utility- scale project, the design is likely to be modular, and in this first screen you will describe that modular, ‘symmetric’... - Page 76 3 Software Overview When you think your tree is complete, double-check it against your engineering drawings to be sure it’s correct. It is not convenient to change this modular tree after exiting the Symmetrical Tree Builder. Try not to use more ‘non-electrical’ layers than necessary (‘block’, ‘field’, ‘parking lot’, etc.).
-
Page 77: Cloning, Modifying, And Reusing A Previous Project
3 Software Overview Cloning, Modifying, and Reusing a Previous Project If you need to create a new Project that will be very similar to one you have done before, you can save time by recycling the earlier project and adjusting it as needed. Follow these instructions. -
Page 78: View Menu
3 Software Overview Figure 46. Properties Menu View Menu Trace view options... These controls select which features are displayed in the Traces screen. Options include: Measured current vs. voltage curve I-V (STC) Measured current vs. voltage curve translated to STC Power vs. -
Page 79: Table 9. Utility Menu Description
3 Software Overview Table 9. Utility menu description Name Description Enable manual Check this menu item to display, as shown here the controls for selecting sensor your irradiance, temperature, and tilt sensing options. See Chapter configuration Measuring Irradiance, Temperature, and Tilt for guidance on sensor choices. - Page 80 The battery voltage at which the unit will shut down is also reported. In the PVA-1500S software, the battery levels of both the I-V Measurement Unit and SolSensor 300 are reported. In the PVA-1000S and PVA-600+ software, only the I-V Unit voltage is reported.
-
Page 81: Help Menu
In addition, the User Guide is available in the Support page of the Solmetric website, under Downloads. About Accesses the software version number and software build date. Please have this information ready if you call Solmetric about your PVA. 3-17... -
Page 82: Using The Tab Screens
3 Software Overview Using the Tab Screens The tabs along the left edge of the screen display measurement data in various ways. The paragraphs below explain how the features of each tab are used. Certain elements are common to more than one tab. These include the Status indicator, the Measure Now button, the Assign and Save... -
Page 83: Table 11. Traces Tab Description
3 Software Overview impact of electrical noise on measurement accuracy. The location of the blue marker is not derived from the PV model. A green shaded region that represents the maximum power point tracking (MPPT) voltage range of your selected inverter. This feature is provided to help the user identify situations in which the number of modules in a string is not well matched to the inverter. - Page 84 3 Software Overview Name Description Measuring (in Status indicator) During a measurement, the Measuring label blinks. Assign and Save Before the PV model points for a new measurement can be displayed on the I-V graph, the measurement must be Reassign assigned or saved to a location in the System Tree in the Array Navigator.
- Page 85 Ready within seconds of connecting your PC to the I-V Unit's WiFi hot spot. If there is a problem it is PVA-1500S typically because they are out of wireless range of one another, or you connected with a different I-V Unit that was in the same vicinity (uncommon).
-
Page 86: Table Tab
I-V Unit, or the PC has not yet (in SolSensor display area) connected to the I-V Unit hotspot. PVA-1500S No SolSensor Displayed if SolSensor is turned off or out of wireless range of the PC. However, if the wireless USB adapter is... -
Page 87: Figure 50. Table Tab
3 Software Overview Figure 50. Table tab Table 12. Table tab description Name Description Predicted Displays the predicted values from the selected performance model. Measured Displays actual measured values most recently measured. Meas Translated to STC Displays a translation of the measured parameters to Standard Test Conditions, 1000W/m2 and 25 C. -
Page 88: History Tab
3 Software Overview Name Description Chapter 7 - Interpreting Measured I-V Curves. Irradiance, temperature The irradiance, temperature, and tilt associated with the current and tilt measurement are displayed in the Summary Bar, directly below the table. History Tab Automatically displays the tabular results of your most recent measurements. New results appear in the left-hand column. -
Page 89: Meg Test Tab
3 Software Overview Meg Test Tab This tab is used to record resistance measurement results obtained from a separate instrument such as the Megger MIT430 Insulation Resistance Tester. Data is entered ® manually. The Meg Test tab is hidden by default. To enable this tab, use the control in the View menu. -
Page 90: Description Of The Exported I-V Data File
This section describes the organization of the .csv (comma separated value) file that is created in your hard drive when you export measurements from the PVA software. PV Analyzer users typically analyze their measurement results using the Solmetric I-V Data Analysis Tool (DAT), which automates the analysis and reporting process. To use the DAT, you will first export your Project data from the PV Analyzer, and then import it into the DAT. -
Page 91: Figure 53. Headeri
3 Software Overview Figure 53. Header Information section of the exported csv file Table 14. Description of the Header Information section of the exported csv file Item Description Report Date and Time When your measurement was made, as recorded from your computer’s clock. -
Page 92: Figure 55. The Sol Sensorm
3 Software Overview Below Figure 55 shows the SolSensor Measurements section of the exported csv file, and the table that follows describes the contents. All of the values were recorded at the time the I-V measurement was made. Figure 55. The SolSensor Measurements section of the exported csv file Table 15. -
Page 93: Figure 56. Model Details Section Of The Exported Csv File
3 Software Overview Figure 56. Model Details section of the exported csv file Table 16. Description of the Model Details section of the exported csv file Item Description Irradiance used in model The value of irradiance used in the predictive model. Cell temperature used in The value of PV cell temperature used in the predictive model. -
Page 94: Figure 57. The Voltage, Current, And Power Data From The I-V Measurement
3 Software Overview Item Description Module Model Model number of the PV module # of Modules in String Number of modules connected measured in series. # of Strings in Parallel Number of strings measured in parallel. Inverter Mfr Manufacturer of the inverter. Inverter Model Model number of the inverter. -
Page 95: Basis Of Pv Performance Predictions
3 Software Overview Basis of PV Performance Predictions The PVA software predicts the electrical output of the PV source under test (module or string) based on the module performance model parameters, the existing irradiance and temperature, and a number of other factors. The following discussion outlines the process by which SolSensor is calibrated and measures irradiance, and the process by which the PVA software predicts the expected I-V curve. -
Page 96: Prediction Of Pv Performance
3 Software Overview Prediction of PV Performance The PVA software compares the measured I-V curve to the predictions of built-in PV performance models. The Performance Factor is calculated from this comparison. The prediction process involves these steps: User creates a Project and inputs all of the required parameters, including selection of their PV module from the built-in equipment database. -
Page 97: Making Measurements
PVA hardware that you will be using. The PVA-1500 uses version 4.x software, and the PVA-1000 and PVA-600+ use version 3.x software. To check the latest available version number, visit http://www.solmetric.com/downloads-pva.html. Create a Project in the PVA software. -
Page 98: Make Sure You Have All Your Equipment
Make sure you have all your equipment Personal Protective Equipment I-V Measurement Unit in its soft case, with a complete set of Solmetric-provided gear in its gear pouch. The pouch should contain PVA test leads, wireless USB adapter (not needed for PVA-1500S), PVA software on a flash drive, and PV connector tools. -
Page 99: Launch The Pva Software
4 Making Measurements Connect the alligator clips to the ends of the test leads. Launch the PVA software Double click the PVA icon and the software will start. Make sure that you have selected the version of software that works with your version of the hardware. To check the software version, click About in the Help menu. -
Page 100: Turn On The I-V Measurement Unit, And Connect Wirelessly To Your Pc
When the PVA-100S or PVA-600+ connects to the wireless USB adapter plugged into your PC, the Status indicator in the upper right corner of the PVA software displays Ready. The PVA-1500S creates a WiFi hotspot. Find and connect to that hotspot in the network list of your PC. Turn on SolSensor Press and release the LED pushbutton. -
Page 101: Select The First Pv Circuit To Be Measured
4 Making Measurements If you will be measuring circuits at a combiner box, after lifting all the fuses, you can connect the PVA test leads to the positive and negative buss bars. This allows you to insert one string fuse at a time to select the PV circuit to test. If measuring circuits in parallel (for example ‘harnessed’... -
Page 102: Select The Next Pv Circuit And Take Another Measurement
4 Making Measurements with the predictions of the PV model, instead press the Assign Only button. The Array Tree closes and the I-V curve expands to its full width. Inspect the curve for abnormal shapes. Also notice the values of the Fill Factor and the Performance Factor below the I-V curve graph. -
Page 103: From Time To Time, Back Up Your Data
4 Making Measurements From time to time, back up your data The PVA software will remind you to back up your data. Always do this. It is possible for PVA Project files to become corrupted. Also create a backup when you are finished measuring a PV installation. - Page 104 4 Making Measurements This page left blank intentionally.
-
Page 105: Troubleshooting Pva Operation
5 Troubleshooting PVA Operation 5 Troubleshooting PVA Operation This chapter describes steps to troubleshoot the operation of the PVA. Troubleshooting of actual PV systems is not included in this discussion. Troubleshooting Using Status Messages Your main tool for troubleshooting PVA operation is the Status indicator, shown in Figure 59 and discussed in this chapter. - Page 106 If this is the case, clicking on the "Disabled" message provides instructions regarding the required version of Wireless USB Adapter. You may also need to update the I-V Measurement Unit firmware (contact Solmetric for support). I-V Measurement Unit battery voltage is too low In this case, clicking on the "Disabled"...
- Page 107 Make sure that the I-V Unit is turned on and is within wireless range. Searching for SolSensor This message appears in the SolSensor data display area when SolSensor 300 has not yet established its WiFi link to the PVA-1500S I-V Unit. Make sure the SolSensor 300 is...
-
Page 108: Troubleshooting By Symptom
Obstructions in the line-of-sight can also reduce wireless range. Also make sure that you are using the SolSensor 300 that was shipped from Solmetric with that particular I-V Unit; they are permanently paired at the factory. - Page 109 10-20 seconds during the switch between direct and indirect. A brief dropout can also occur between the PVA-1500S and your PC. If the link does not restore in 2 minutes, you may be out of wireless range. Similarly, communication with the SolSensor 300 can also briefly drop out, but should restore momentarily if SolSensor 300 and the I-V Unit are within wireless range of one another.
- Page 110 The I-V Measurement Unit contains a thermal fuse set to trip at 85C. This is an uncommon occurrence, but it irreversibly shuts down the Unit. If you suspect that this has occurred, contact Solmetric Technical Support. Solmetric Technical Support Phone: 707-823-4600 X2...
-
Page 111: Measuring Irradiance, Temperature, And Tilt
6 Measuring Irradiance, Temperature, and Tilt 6 Measuring Irradiance, Temperature, and Tilt Introduction Thorough evaluation of array performance by any measurement method (I-V curve tracing or conventional methods) always involves comparing measured I-V data to some form of reference. That reference may be anything from a simple STC capacity value to a detailed PV performance model. -
Page 112: Table 17. Sensor Choices
6 Measuring Irradiance, Temperature, and Tilt The materials in which the PV cell is embedded have poor thermal conductivity, so there can be substantial temperature drop between the cells and the module's outer surfaces. Temperature offset between PV cell and module backsheet depends on racking configuration and ventilation. -
Page 113: Measuring Irradiance With Solsensor
6 Measuring Irradiance, Temperature, and Tilt Measuring Irradiance with SolSensor SolSensor irradiance sensor SolSensor irradiance sensing element is a silicon photodiode with temperature correction. Its spectral response is corrected to match silicon solar cells and its angular response is corrected to provide enhanced accuracy over a broader part of the day. Preliminary Irradiance SolSensor irradiance measurement is further calibrated according to the PV model parameters for the selected PV module. -
Page 114: Orienting And Mounting The Irradiance Sensor
6 Measuring Irradiance, Temperature, and Tilt Orienting and mounting the irradiance sensor To provide a valid reference irradiance value, the sensor must be mounted in the plane of the array. This assures that the PV modules and the irradiance sensors present the same proportion of their area to the sun at all times of day (a cosine effect) and that reflective albedo effects are as similar as possible. -
Page 115: Determining Irradiance From The Measured I-V Curve
6 Measuring Irradiance, Temperature, and Tilt SolSensor irradiance sensor is corrected for angular effects. One of the benefits of this correction is better performance under diffuse light conditions. Determining Irradiance from the Measured I-V Curve When you select the From I-V option, the PVA software calculates irradiance from the measured I-V curve. -
Page 116: Measuring Pv Module Backside Temperature With A Thermocouple
6 Measuring Irradiance, Temperature, and Tilt A greater and more variable time delay between the I-V curve and irradiance measurements translates into irradiance error under conditions of rapidly changing irradiance. Hand-held irradiance sensors may have poor accuracy, especially in their cosine response. -
Page 117: Selecting A Thermocouple Wire Gauge
This tape is also available from Solmetric in spools of 1.75 inch disks for added convenience. Do not use cheap duct tape, as it sags when hot, allowing the thermocouple tip to pull... -
Page 118: Attaching The Thermocouple To The Module Backside
6 Measuring Irradiance, Temperature, and Tilt Attaching the thermocouple to the module backside Cut a fresh 2” length of tape, or use a fresh tape disk. Place the thermocouple bead in the center of the tape. Press the tape firmly against the backside of the PV module, applying pressure first over the thermocouple, then over the thermocouple lead, and then press down the rest of the tape. -
Page 119: Measuring Pv Module Temperature With An Infrared Thermometer
6 Measuring Irradiance, Temperature, and Tilt Measuring PV module temperature with an infrared thermometer Some competing measurement solutions rely on infrared measurements of module temperature. This approach has serious limitations, which are discussed here because the PVA software allows the user to manually enter temperature values from hand-held sensor devices. -
Page 120: Determining Cell Temperature From The Measured I-V Curve
6 Measuring Irradiance, Temperature, and Tilt Determining Cell Temperature from the Measured I-V Curve When you select the From I-V option, the PVA software calculates the equivalent cell temperature from the measured I-V curve. This option has several benefits and several limitations, all due to the fact that since temperature is calculated mainly from the measured V and the resulting temperature value is an input to the PV model, the model... -
Page 121: Using Smarttemp To Measure Cell Temperature
6 Measuring Irradiance, Temperature, and Tilt Using SmartTemp to Measure Cell Temperature The SmartTemp method uses a blend of the From I-V and backside thermocouple methods, taking best advantage each while avoiding their biggest limitations. The blend changes as a function of irradiance: ... - Page 122 6 Measuring Irradiance, Temperature, and Tilt This page left blank intentionally. 6-12...
-
Page 123: Interpreting Measured I-V Curves
7 Interpreting Measured I-V Curves 7 Interpreting Measured I-V Curves Introduction A PV module, string, or array has a characteristic curve of current versus voltage; the “I- V curve”. The I-V curve represents the entire family of current and voltage pairs at which the PV circuit can be operated or loaded. -
Page 124: I-V Curve Terminology
7 Interpreting Measured I-V Curves An inverter database is included in the PVA software only to display the inverter's max power tracking range on the I-V curve graph. The inverter characteristics do not affect the measurement of the I-V curves and are not used in creating the PV model. I-V Curve Terminology These abbreviations will be used in the following discussion: ... -
Page 125: The Shape Of A Normal I-V Curve
7 Interpreting Measured I-V Curves technology has its own nominal range of fill factor values, and each module model number typically has an even narrow nominal range. Figure 60. Definition of the Fill Factor. Fill Factor does not very much with irradiance so long as the irradiance is high, which means that comparing Fill Factor values is a good way to assess the consistency of I-V curve shapes in variable (but high) irradiance situations. -
Page 126: Interpreting I-V Curves
7 Interpreting Measured I-V Curves A normal I-V curve has a smooth shape with three distinct voltage regions as shown in Figure 61: A slightly sloped region above 0 V (the horizontal leg of the curve) A steeply sloped region below V (the downward leg of the curve) A bend or ‘knee’... -
Page 127: Figure 62. Deviations In The Shape Of The I-Vcurve Fall Into One
7 Interpreting Measured I-V Curves Figure 62. Deviations in the shape of the I-V curve fall into one (or a combination) of these six categories It would be convenient if each of the I-V curve deviations illustrated in Figure 62 corresponded to a unique physical cause. -
Page 128: Notches Or Steps
7 Interpreting Measured I-V Curves 1. Notches or steps Examples of this type of deviation are shown in Figure 63, Figure 64, and Figure 65. Figure 63. The effect of partial shading on a string I-V curve. -
Page 129: Figure 64. The Shading Impact Of Placing A Business Card On A Single Cell In A String Of Fifteen 180- Watt
7 Interpreting Measured I-V Curves Figure 64. The shading impact of placing a business card on a single cell in a string of fifteen 180-watt modules Figure 65. The effect of intentionally shading entire modules in different combinations, in two parallel-connected strings NOTE The graphic shown in Figure 65 is an overlay of several I-V curve measurements. -
Page 130: Array Is Partially Shaded, Or Non-Uniform Soiling Or Debris Is Present
7 Interpreting Measured I-V Curves Bypass diode is short-circuited Array Is Partially Shaded, or non-uniform soiling or debris is present Partial shading of a PV cell reduces the current capacity of that cell, which in turn reduces the maximum current that can be produced by other series connected cells. For example, slightly shading one cell in a 72 cell module that has 3 bypass diodes will slightly reduce the current in 24 cells. -
Page 131: Uniform Soiling
7 Interpreting Measured I-V Curves Module degradation Potential causes associated with the model settings include: Incorrect module is selected for the PV model Number of PV strings in parallel is not entered correctly in the model Potential causes associated with irradiance or temperature measurements include: ... -
Page 132: Number Of Pv Strings In Parallel Is Not Entered Correctly In The Model
7 Interpreting Measured I-V Curves back of the PV modules. If the array is known to have a mix of PV modules of different types, this can also contribute to changes in I . Mixed modules can also cause a mismatch effect, another class of deviation discussed later. -
Page 133: Manual Irradiance Sensor Is Not Accurate
7 Interpreting Measured I-V Curves Manual Irradiance Sensor Is Not Accurate Hand-held irradiance sensors vary widely in their calibration accuracy, response to off- angle light, and spectral match to the array being measured. All of these variables affect accuracy. 3. Low voltage An example of this type of deviation is shown in below. -
Page 134: One Or More Cells Or Modules Are Completely Shaded
7 Interpreting Measured I-V Curves the PV module under test has a poor thermal connection between the back of the module and the actual PV junction. One or More Cells or Modules Are Completely Shaded Hard shade on an entire cell causes its associated bypass diode to begin conducting a very low current, making it look like V has shifted downward. -
Page 135: Steeper Slope In Horizontal Leg
7 Interpreting Measured I-V Curves Rounding of the knee of the I-V curve can be a manifestation of the aging process. Before concluding that this is the case, check the slopes of the horizontal and vertical legs of the I-V curve. If they have changed, it can produce a visually similar effect in the shape of the knee. -
Page 136: Module I Sc Mismatch
7 Interpreting Measured I-V Curves module encapsulant material. Shunt current is typically associated with highly localized defects within the solar cell, or at cell interconnections. Infrared imaging of the PV module can usually identify minor shunt current hot spots since a temperature rise of 20 ºC or more is common. -
Page 137: Tapered Shade Or Dirt Dam
7 Interpreting Measured I-V Curves Tapered shade or dirt dam When a string of modules is mounted in portrait orientation, a band of shade or dirt across the entire string can cause the steeper slope in the horizontal leg of the curve, but only if the band is tapered from one end to the other (or if there is a randomized slight variation in the extent of the dirt band across the modules in the string). -
Page 138: Electrical Interconnections In The Array Are Resistive
The resistance of the primary test leads of the PV analyzer is extremely low and can be neglected. The resistance of the Solmetric Test Lead kit can also be neglected. Using smaller-gauge test leads can add significant resistance and corresponding measurement error. -
Page 139: Translation Of I-V Data To Standard Test Conditions
8 Translation of I-V Data to Standard Test Conditions 8 Translation of I-V Data to Standard Test Conditions The PVA PC software provides a feature for translating the displayed I-V curve to Standard Test Conditions (STC) of 1000W/m and 25 C. The software also translates the key performance parameters in the Table view (tab). -
Page 140: Definition Of The Translation Process
8 Translation of I-V Data to Standard Test Conditions reference condition, I . Using these (%/°C) units makes the same value applicable for both individual modules and for parallel strings of modules. α = Normalized temperature coefficient for I , (%/°C). Normalized in the same manner as α... - Page 141 8 Translation of I-V Data to Standard Test Conditions mptrans trans )] / {1+ γ /100*(T * [ln(E ) / ln(E mptrans trans trans ] / {1+ γ /100*(T * [E mptrans mpmeas trans trans...
- Page 142 8 Translation of I-V Data to Standard Test Conditions...
Need help?
Do you have a question about the PVA-1500S and is the answer not in the manual?
Questions and answers