
Related Manuals for Fluke VR101S


Summary of Contents for Fluke VR101S
- Page 1 ® VR101S Voltage Event Recorder System Users Manual December 1997, Rev. 4, 06/02 © 1997, 1999, 2002 Fluke Corporation. All rights reserved. All product names are trademarks of their respective companies.
- Page 3 LIMITED WARRANTY & LIMITATION OF LIABILITY Each Fluke product is warranted to be free from defects in material and workmanship under normal use and service. The warranty period is one year and begins on the date of shipment. Parts, product repairs and services are warranted for 90 days.
- Page 4 Fluke Corporation, P.O. Box 9090, Everett, WA 98206-9090 USA, or Fluke Industrial B.V., P.O. Box 680, 7600 AR, Almelo, The Netherlands SERVICE CENTERS To locate an authorized service center, visit us on the World Wide Web: http://www.fluke.com...
-
Page 5: Table Of Contents
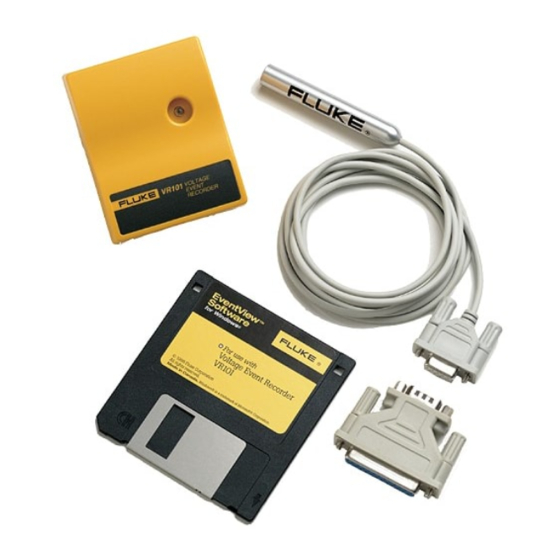
Safety Inspection ............ 5 Battery Care............5 Maintenance ............6 Product Service............6 What You Need to Run Fluke EventView Software..7 What’s in the VR101S Package........7 Installing EventView software ........8 Setting the Time and Date........10 Chapter 2 Setting Up the VR101 .......... - Page 6 VR101S Users Manual Chapter 3 Retrieving and Saving Events ........19 Retrieving Events from a Recorder ......19 Saving Events ............20 Opening an Already Saved File......21 Chapter 4 Displaying and Printing Events........23 Displaying Events .............23 Viewing the Events Tab.........23 Viewing Events as a Bar Graph ......29 (Quick Summary)...........29...
- Page 7 Chapter 7 VR101 Specifications ........... 51 Equipment Ratings ........... 51 Sag, Swell & Outage Measurement......54 Transient Measurement..........55 Frequency Measurement.......... 55 Time Measurement........... 56 Approvals..............57...
- Page 8 VR101S Users Manual...
-
Page 9: Chapter 1 Getting Started
Chapter 1 Getting Started Introduction Features of the Voltage Event Recorder System The VR101 Voltage Event Recorder, hereafter referred to as the recorder, records sags, swells, transients, outages, and frequency variations on the power line. It is self powered and easy to use—parameters can be set by a few easy keystrokes from your PC equipped with EventView Software The recorder can retain 4,000 events. - Page 10 VR101S Users Manual A Quick Overview The following steps are discussed in detail throughout this manual: Read the next five pages on safety and battery care. Install EventView Software on your PC. Plug the VR101 into the closest wall socket.
-
Page 11: Safety
Getting Started Introduction Safety Attention Carefully read the following safety information before using the recorder. Safety Precautions Specific warning and caution statements, where they apply, will be found throughout the manual. A Caution identifies conditions and actions that may damage the recorder. A Warning identifies conditions and actions that pose hazard(s) to the user. - Page 12 VR101S Users Manual (N-G) events and to measure the recorder’s polarity, indicated by the LED. Also see below under “Using an Ungrounded Outlet”. The ground prong may be electrically disconnected (as long as it is not exposed). The recorder does not need special ventilation, however, its ambient temperature should not be allowed to rise above the operating limit.
-
Page 13: Electrical Immunity
Getting Started Introduction Electrical Immunity The recorder’s internal circuitry is solid-state with built-in EMI and RFI protection to ensure reliable readings. The recorder will withstand exposure to a 3,400V transient for a duration of 20 ms. Safety Inspection We recommend that you inspect the recorder periodically for visible damage. -
Page 14: Maintenance
The Optical Interface Cable is the only replacement part in the VR101S package. If you require service, please contact your local dealer or an authorized Fluke service center. (See under “Service Centers” in the front of this manual.) -
Page 15: What You Need To Run Fluke Eventview Software
Getting Started What You Need to Run Fluke EventView Software What You Need to Run Fluke EventView Software In order to run Fluke EventView software, your computer system must include: • IBM PC or 100% compatible, with Windows 3.1 or Windows 95/98/NT installed and operating •... -
Page 16: Installing Eventview Software
VR101S Users Manual Installing EventView software Before installing EventView software, close other applications, or restart Windows. For Windows 3.1, open Program Manager, select File from the menu bar and choose Run... Windows 95/98/NT users select Start from the Taskbar on the desktop and choose Run... - Page 17 For Windows 3.1 users a dialog box appears to select or to create the Windows Program Group to add the EventView Software to. Click Next to create the Fluke PQ Tools program group. (PQ stands for Power Quality.) Click Next to begin installation.
-
Page 18: Setting The Time And Date
VR101S Users Manual Setting the Time and Date It is very important that your PC system’s time and date are correct before running the EventView program. When retrieving data from the recorder, the EventView program uses the PC’s internal clock for time and date reference. -
Page 19: Chapter 2 Setting Up The Vr101
Starting EventView • Windows 3.1 users double-click the Fluke EventView program icon EV101 in the Fluke PQ Tools group window. (Double-click the Update Readme icon to read the latest information about the VR101S.) -
Page 20: Selecting A Com Port
VR101S Users Manual • Windows 95/98/NT users click Start on the Taskbar, and choose Programs, Fluke PQ Tools and then EventView. (Select Update Readme to read the latest information about the VR101S.) The main FLUKE EVENTVIEW window will open. Selecting a COM Port •... -
Page 21: Setting Thresholds On The Status Tab
Setting Up the VR101 Starting EventView The Site Report window displays the recorder’s settings and its recorded events. If the VR101 is not plugged into a power source, an information box will appear saying “No voltage detected on recorder. Realtime halted to conserve power.”... - Page 22 VR101S Users Manual If the voltage exceeds the swell voltage threshold for longer than one cycle, a swell event will be recorded. Voltage Sags Sags are decreases in line voltage lasting for at least ½ cycle. Sags are only measured on the hot-neutral lines.
-
Page 23: Viewing The Default Threshold Settings
Setting Up the VR101 Starting EventView Viewing the Default Threshold Settings The EventView program has factory-installed default threshold settings. These settings are adequate for most applications. • To see the default threshold settings on the Status tab, click the Default Setup button. If you are concerned that some of your electronic equipment may have particular power quality requirements, we suggest that you call the equipment... -
Page 24: Describing The Site
VR101S Users Manual Describing the Site Site Description gives you the opportunity of specifying the location of the recorder, for instance, if you need to distinguish between the locations of three recorders in one office. You may describe the site in your own words using up to 30 characters. -
Page 25: Sending The Setup To The Recorder
Setting Up the VR101 Starting EventView Sending the Setup to the Recorder and as a consequence, Clearing all events from the recorder Place the wand into the optical port of the recorder. If you have changed threshold settings or you are leaving the settings the way they are, click Send Setup/Clear Recorder button. - Page 26 VR101S Users Manual...
-
Page 27: Retrieving And Saving Events
Chapter 3 Retrieving and Saving Events Retrieving Events from a Recorder With the Main VR101 window open, and with the Optical Interface Cable connected to your computer, ensure that the wand is blinking. If it is not, choose Scan from the Communicate menu (or, on the ToolBar, click the red scan button so that it flashes). -
Page 28: Saving Events
VR101S Users Manual Saving Events To save the events that you have downloaded choose Save from the File menu or click the Save button on the ToolBar. The Save As dialog box will appear with the current file name highlighted in the File Name box. -
Page 29: Opening An Already Saved File
Retrieving and Saving Events Saving Events Opening an Already Saved File From the File menu choose Open Site File. The Open dialog box will appear. Scroll through the list of site files until you find the file you want. Double-click the selected file (or click it and then click OK) to open the Site Report window. - Page 30 VR101S Users Manual...
-
Page 31: Displaying And Printing Events
Chapter 4 Displaying and Printing Events Displaying Events EventView software enables you to view events in different forms: • The Events tab in the Site Report window lists all events that the recorder has gathered. • Sags, swells and transients can be displayed in a Quick Summary bar graph. - Page 32 VR101S Users Manual Event # column The Event # column displays the number of each event. The most recent events are displayed first. You may have to scroll down (use the scroll bar on the right of the window) to view all the events that the recorder has recorded.
- Page 33 Displaying and Printing Events Displaying Events Transient Events The recorder can detect both positive and negative transients down to one 1 µs in duration on either the H-N and N-G circuits. If the voltage exceeds the transient deviation threshold for any given half cycle, a transient event will be recorded.
- Page 34 VR101S Users Manual hot-neutral lines or on the neutral-ground lines. Sags are only measured on the hot-neutral lines. Outage Events Outage events less than one second duration are recorded with half cycle resolution. Longer outages are recorded with 8 second resolution.
- Page 35 Displaying and Printing Events Displaying Events Hot - Hot - Neutral Neutral Voltage Duration Voltage Duration VER Data 100V 2 cycles 120V 1 hour Sag 100V, 2 cycles 2 cycles 120V 1 hour Sag 40V, 2 cycles 100V 2 seconds 120V 1 hour Sag 100V, 2 seconds...
- Page 36 VR101S Users Manual • Events that last longer than 24 hours display the end time (date and time). If an event was still in progress when data was downloaded from the recorder, the event will be designated as an open event in this column. Open events are assigned the number zero in the Event # column.
-
Page 37: Viewing Events As A Bar Graph
Displaying and Printing Events Displaying Events Viewing Events as a Bar Graph (Quick Summary) Quick Summary displays the number of sag, swell, transient, outages, and frequency events as bars on a graph. With the Site Report window open at the Events tab, choose Quick Summary from the View menu (or click the Quick Summary button on the ToolBar). -
Page 38: Viewing A Single Transient As A Graph
VR101S Users Manual The horizontal axis displays time; the vertical axis displays the number of events that occurred in each time period. In the bar graph above, the time periods are sorted by date. Note that the thickness of a bar and its position in a time period is irrelevant—the bar only displays the number of... -
Page 39: Viewing Events As An Event Distribution Graph
Displaying and Printing Events Displaying Events To open a dialog box of display options, right-click the mouse with the pointer in the graph. Also see under Changing Graph Styles” on page 33. Viewing Events as an Event Distribution Graph The Event Distribution Graph plots the magnitude of an event against duration on a logarithmic scale in order to determine the importance of the data. - Page 40 VR101S Users Manual • Click OK to close this dialog box and to display the Event Distribution Graph. Since the transients have a duration that is unknown, they are represented as having a width of 10 µs.
-
Page 41: Changing Graph Styles
Displaying and Printing Events Displaying Events Changing Graph Styles The Graph Control dialog box contains a number of edit features that enable you to change the way a graph appears. These features include naming and placing titles, using 3D effects, and saving a graph in different formats. -
Page 42: Printing Events
VR101S Users Manual Printing Events Printing Events from the Events Tab With the Events tab displayed, choose Print from the File menu (or click the print button on the ToolBar). Choose the option you want from the Print dialog box (printing all events, printing one or more pages, or printing a number of events that you selected). -
Page 43: Chapter 5 Troubleshooting
Chapter 5 Troubleshooting Optical Interface Cable Many manufactures of PC software and hardware use the COM (serial) port(s). It is difficult to predict potential COM port conflicts. If the Optical Interface Cable’s wand tip is not flashing, there are a few steps that can be taken in order to find the source of the problem. - Page 44 VR101S Users Manual modem, MSD may detect the modem’s serial port. This serial port cannot be directly used with the Optical Interface Cable. Windows 95/98/NT users verify port settings in Device Manager. Device Manager is found on the TaskBar by choosing Start, Settings, Control Panel, System, and Device Manager.
-
Page 45: Printers
Troubleshooting Printers EventView program. If you are unable to make the optical interface flash when running the program, re-install EventView software. • Check your mouse driver. Certain older or inferior drivers for mice, trackballs and laptop “pointing sticks” are known to interfere with serial port operation. -
Page 46: Technical Support
The VER will be ready to record events in 8-16 seconds. Technical Support If you are experiencing problems with your recorder system, please contact your local dealer or an authorized Fluke service center. (See under “Service Centers” in the front of this manual.) -
Page 47: Power Quality Issues
Chapter 6 Power Quality Issues Power Quality Background Why Is It Such a Concern? Many people blame the power utility for degrading power when, in most cases, the problem is caused by poor power distribution within a facility. Equipment such as computers, TVs, phone systems, alarm systems, process controls and even the heating, ventilation and air conditioning system in your building use... -
Page 48: Common Questions About Power Quality
VR101S Users Manual For example, more than likely your business uses microprocessor-based systems. If these devices are continually affected by voltage disturbances, they can be damaged and cause a shutdown. The downtime will result in financial losses. Power quality monitoring should be considered an integral part of any maintenance program. -
Page 49: Power Quality Definitions And Standards
Power Quality Issues Power Quality Definitions and Standards Power Quality Definitions and Standards Power Line Disturbance Definitions Disturbance-Free Voltage Common Power Line Disturbances Many terms are used to describe power line disturbances. Below are some graphic examples of power line disturbances recorded by a recorder followed by definitions of the terms. -
Page 50: How Bad Is Bad
VR101S Users Manual Sag An operating voltage of 90% of nominal volts or less Swell More than one cycle above 10% of nominal Dropout Power loss of 1 ms to 1 s Outage More than 1 s of power loss... -
Page 51: Causes And Effects Of Poor Power Quality
Power Quality Issues Causes and Effects of Poor Power Quality Although this graph does not apply to all equipment, it does apply to a vast amount of equipment in the marketplace. Causes and Effects of Poor Power Quality Causes of Poor Power Quality Swells •... -
Page 52: How Power Line Disturbances Affect Your Equipment
VR101S Users Manual Frequency Variation • Major load increases • Utility switching How Power Line Disturbances Affect Your Equipment Depending on their degree and frequency, power line disturbances can cause corrupted data or permanent damage in sensitive electronic equipment. The following list shows the effects that power line disturbances can have on various types of sensitive electronic equipment. -
Page 53: Performing A Power Quality Study
Power Quality Issues Performing a Power Quality Study Performing a Power Quality Study Developing a Power Quality Monitoring Program A power quality monitoring program is a simple, useful process that helps determine the best method for assessing an electrical environment’s power quality. Before you monitor power quality, develop a monitoring plan. - Page 54 VR101S Users Manual Developing a Location Plan Depending on the size of the organization, number of departments, and importance of certain locations, note the priority locations. The location plan may change throughout the power quality study as clues may direct you to a possible problem location.
- Page 55 Power Quality Issues Performing a Power Quality Study quality monitoring program will help make the organization more productive and will possibly save money. Final Note This is only one strategy that can verify power quality. Different situations may call for different strategies in order to investigate and solve power quality concerns.
-
Page 56: Now That I Have This Information, What Do I Do With It
VR101S Users Manual Now That I Have This Information, What Do I Do with It? There are two ways to solve most power line disturbances: either rewire the electrical system to separate the sensitive loads from the problem branches, or place a number of UPS’s or other protection devices in mission critical areas. - Page 57 Power Quality Issues Performing a Power Quality Study The following power conditioning suggestion chart is useful for choosing an adequate protection device for unrepetitive power line disturbances. Transient/ Power Line Uninterruptible Swell Filter Power Supply Protector Transients Swells Sags Outages * Used only when transients and swells are moderate in quantity or else damage may occur to the power protection device.
- Page 58 VR101S Users Manual...
-
Page 59: Vr101 Specifications
Chapter 7 VR101 Specifications The following specifications are valid only when the Voltage Event Recorder is plugged into a grounded standard convenience outlet and when the LED indicates correct polarity. Specifications subject to change without notice. Equipment Ratings Model number VR101/xx3 Nominal Supply: 120V Operating Range:... - Page 60 VR101S Users Manual Plug Configurations Back view of country versions L = LINE N = NEUTRAL E = EARTH...
- Page 61 VR101 Specifications Equipment Ratings Memory Size: 32kB, 4000 events Storage Method: First-in First-out, or Fill-then- stop Sampling Method: Continuous (half cycle integrated) Alarm Type: Optical; red LED slowly blinks when there are events stored in memory. Polarity Detection : Within 8 s after plugging in. Polarity Indication: Red LED lights steadily during 8 to 16 seconds if polarity is OK.
-
Page 62: Sag, Swell & Outage Measurement
VR101S Users Manual Sag, Swell & Outage Measurement Hot to Neutral Model number VR101/xx3 Range: 0 to 200Vrms ±2Vrms* Accuracy: Resolution: 1Vrms Model numbers VR101/xx1, /xx4, /xx5, and /xx7 Range: 0 to 270Vrms ±4Vrms** Accuracy: Resolution: 2Vrms Neutral to ground... -
Page 63: Transient Measurement
VR101 Specifications Transient Measurement Transient Measurement Range Hot to Neutral: 100 to 2500Vpeak Neutral to Ground: 50 to 2500Vpeak ±10% of reading + 10V Accuracy: Resolution: 1 µs minimum Width Detection: Phase Angle Range: 20° to 180°, 200° to 360° ±1°... -
Page 64: Time Measurement
VR101S Users Manual Time Measurement Events <1 s(econd) Accuracy ±0.5 cycle* Hot to Neutral: ±1 cycle** Neutral to Ground: Resolution Hot to Neutral: 0.5 cycle Neutral to Ground: 1 cycle ±2 s/day Clock accuracy: Timer counter capacity 4.25 year (24 bit counter, resolution 8 seconds) Outages are reported with ½... -
Page 65: Approvals
VR101 Specifications Approvals Approvals Safety: This device is safety approved by CSA and CSA(NRTL/C) for measurements on 300V CAT III, Pollution Degree 2, double insulation, per: UL3111-1 (1994) IEC1010-1 (1990) CSA C22.2 No. 1010.1 (1992) EN61010-1 (1993) Environmental: MIL-T-28800E, Type III, Class 3 EMC: FCC rules part 15. - Page 66 VR101S Users Manual Declaration of Conformity Fluke VR101 Voltage Event Recorder Manufacturer Fluke Industrial B.V. Lelyweg 1 7602 EA Almelo The Netherlands Statement of Conformity Based on test results using appropriate standards, the product is in conformity with Electromagnetic Compatibility Directive 89/336/EEC...
- Page 67 Index Approvals, 57 Bar graph, 29 Battery care, 5 CBEMA Curve, 42 Changing graph styles, 33 COM port selecting, 12 Date and Time, setting, 10 Declaration of Conformity, 58 Default threshold settings changing, 15 viewing, 15 Displaying events, 23 Electromagnetic Compatibility, 58 Equipment Ratings, 51 Event Distribution Graph, 31 Events...
- Page 68 VR101S Users Manual Events tab End Time/Duration/Degree Column, 27 Event column, 24 Events # column, 24 Extreme column, 27 Start Time column, 24 Flash When Data Available, 15 Frequency Measurement, 55 Frequency variations, 14, 27 Graph Control dialog box, 33...
- Page 69 Index (continued) Scan button, 12, 19 Sending setup to a Voltage Event Recorder, 17 Single Transient Graph, 30 Site Description, 16 Site Report Window, opening, 12 Software equipment required, 7 installing, 8 setting the time and date, 10 starting the program, 11 Specifications, 51 Stop Recording When Full, 15 Swell, Sag &...
- Page 70 VR101S Users Manual...
Need help?
Do you have a question about the VR101S and is the answer not in the manual?
Questions and answers