Table of Contents
Advertisement
Quick Links
Indoor PM2.5 / PM10 / CO
Temperature / Humidity 5-In-1
Contents
1.
Introduction ................................................. 2
2.
Unpacking ................................................... 3
3.
Features ...................................................... 4
4.
Sensor Set Up .............................................. 7
5.
Sensor Installation ........................................ 9
6.
Wi-Fi Configure with gateway...................... 11
6.1 Pair with Gateway .................................... 11
6.2 Wi-Fi Connection for the Gateway .............. 12
7.
View Online Data on WS View .................... 12
8.
Appendix .................................................. 13
9.
Sensor Calibration ...................................... 17
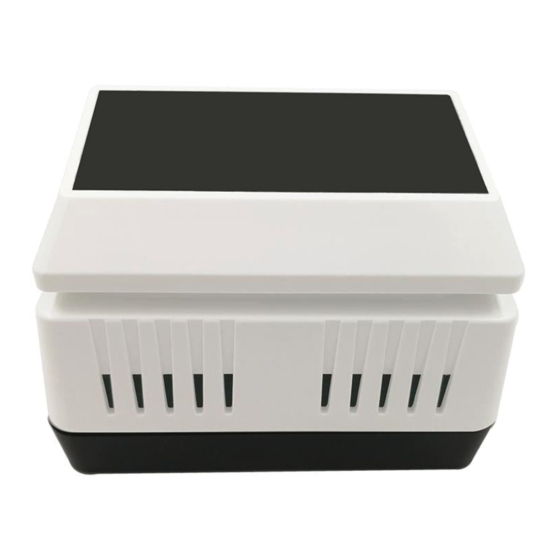
Detection Sensor
Model: WH45
1
/
2
Advertisement
Table of Contents

Subscribe to Our Youtube Channel
Related Manuals for ECOWITT WH45


Summary of Contents for ECOWITT WH45
-
Page 1: Table Of Contents
Indoor PM2.5 / PM10 / CO Temperature / Humidity 5-In-1 Detection Sensor Model: WH45 Contents Introduction ..........2 Unpacking ........... 3 Features ............4 Sensor Set Up ..........7 Sensor Installation ........9 Wi-Fi Configure with gateway...... 11 6.1 Pair with Gateway ........11 6.2 Wi-Fi Connection for the Gateway .... -
Page 2: Introduction
Specification .......... 19 Warranty Information ......21 Introduction Thanks for your purchasing of this integrated multifunction indoor air quality monitoring sensor. It measures PM2.5 / PM10 / CO2 / Temperature / Humidity. To ensure the best product performance, please read this manual and retain it for future reference. -
Page 3: Unpacking
Unpacking Open your box and inspect that the contents are intact (nothing broken) and complete (nothing missing). Inside you should find the following: Item Description Particle Detection Sensor (PM2.5 / PM10 / /CO2 / Temperature / Humidity 5-In-1) USB Cable User Manual Table: Package content If any component is missing from the package, or broken,... -
Page 4: Features
Features Particle Detection Sensor PM2.5, PM10, Measures indoor , Temperature and Humidity concentration every 60 seconds when powered with USB or detecting every 10 minutes when powered with batteries only. USB connection for indoor use only CO2 value calibration function available on the device ... - Page 5 Monitor live sensor data on the Live Data page of the WS View app (requires the gateway and your phone using the same Wi-Fi network) Displays current PM2.5 PM10 concentration/AQI and 24H AQI and air quality level index on the Live Data page of the WS View app ...
- Page 6 Calibration function available. When uploaded to Ecowitt Weather Server: View current sensor data & history records & graph on the website Set and receive email alerts from the server Remote monitoring with smart phone, laptop, or...
-
Page 7: Sensor Set Up
Sensor Set Up 1. Remove the battery door on the base of the air quality sensor as shown in Figure 1 Figure 1 Description Description Red LED Indicator Battery Compartment (RF transmission) Cover... - Page 8 AC Adapter USB Battery Compartment Power Port 2. Insert two AA batteries and close the battery door. Note: The batteries (not included) are mainly for backup purpose. 3. Connect the USB cable between the sensor and an AC adapter(not included). Note: After inserting the batteries or connecting AC power, the sensor LED indicator will light for 3 seconds –...
-
Page 9: Sensor Installation
Sensor Installation Before install the sensor into its permanent location, you may go to Section 6 to configure with the gateway first. Once the sensor has been confirmed working correctly, then you can go back here. Place the sensor on a horizontally surface. Note that the vents must be clear of any obstructions, and we recommend placement away from other electronic devices to prevent interference. - Page 10 and TVs. Radio Frequency Interference (RFI). If you have other devices using the same RF frequency and communication is intermittent, try turning off these other devices for troubleshooting purposes. You may need to relocate the transmitters or receivers to avoid intermittent communication.
-
Page 11: Wi-Fi Configure With Gateway
6.1 Pair with Gateway If GW1000 has been in operation, and you have never had any WH45 sensor setup before, just power up the sensor and GW1000 will pick sensor data automatically. If a WH45 sensor has been hooked on GW1000 before,... -
Page 12: Wi-Fi Connection For The Gateway
6.2 Wi-Fi Connection for the Gateway For this part, please refer to the manual of the GW1000 Wi-Fi gateway. Any question, please contact the customer service. View Online Data on WS View When the Wi-Fi configuration is done, you can view the live data of your sensor on the WS View application. -
Page 13: Appendix
Note: The WH45 sensor data can be only viewed on the Live Data interface since it doesn’t support uploads to weather underground. If you choose to upload the data to our weather server: https://www.ecowitt.net, view live data/history graph and download the records on the website. - Page 14 0 - 50 Good 0.0-12.0 51 -100 Moderate 12.1-35.4 101-150 Poor 35.5-55.4 151-200 Unhealthy 55.5-150.4 201-300 Severe 150.5-250.4 300+ Hazardous 250.5+ Air Quality Index (AQI) for the PM10 Concentration (24hr) PM2.5 Concentration Air Pollution Level ug/m3...
- Page 15 0 - 50 Good 0-54 51 -100 Moderate 55-154 101-150 Poor 155-254 151-200 Unhealthy 255-354 201-300 Severe 355-424 300+ Hazardous 425+ Carbon Dioxide Levels and potential health problems are indicated below: 250-350 ppm: background (normal) outdoor air level 350-1,000 ppm: typical level found in occupied...
- Page 16 spaces with good air exchange 1,000-2,000 ppm: level associated with complaints of drowsiness and poor air 2,000-5,000 ppm: level associated with headaches, sleepiness, and stagnant, stale, stuffy air; poor concentration, loss of attention, increased heart rate and slight nausea may also be present.
-
Page 17: Sensor Calibration
Sensor Calibration CO2:There is an easy way to find the CO2 sensor is drifted or not: put the sensor in outdoor open air locations, away from any combustion exhausts, wait for 30 minutes, you should see the CO2 reading is 420ppm +/-10. If it is far from this reading, you can wait for some more time, and test it during night to confirm. - Page 18 WS View App, which saves the offset value on the gateway side before sending data to www.ecowitt.net server. However if PM2.5 data is persistently low, it can be that there is a spider net going inside the sensor. So please clean the sensor from time to time to see if there is any sign of spider penetration.
- Page 19 Specification Measurement Range Accuracy Resolution PM 2.5 0~999ug/m3 >100ug/m3, 1ug/m3 ± 15% <100ug/m3, ± 15ug/m3 PM 10 0~999ug/m3 >100ug/m3, 1ug/m3 ± 25% <100ug/m3, ± 25ug/m3 0- 40000ppm 400- 1ppm 10000ppm ±(30ppm± -40° C – 60° C Temperature ± 0.1° C, (-40°...
- Page 20 Transmission distance in open field: 100m(300 feet) Frequency: 915/868/433MHz (915MHz for North America, 868MHz for Europe, 433 for other areas) Sensor reporting interval: 1 minutes (10 minutes when only powered by batteries) Power consumption Particle Detection Sensor: AC power (5V 1A) - Not included 2 x AA 1.5V Batteries for back up - Not included Note:...
- Page 21 Warranty Information We disclaim any responsibility for any technical error or printing error, or the consequences thereof. All trademarks and patents are recognized. We provide a 1-year limited warranty on this product against manufacturing defects, or defects in materials and workmanship.
- Page 22 misrepresentation by the seller, or performance variations resulting from installation-related circumstances.
Need help?
Do you have a question about the WH45 and is the answer not in the manual?
Questions and answers