Table of Contents
Advertisement
Quick Links
Advertisement
Table of Contents

Subscribe to Our Youtube Channel
Related Manuals for Rohde & Schwarz R&S UPP


Summary of Contents for Rohde & Schwarz R&S UPP
- Page 1 ® R&S Audio Analyzer User Manual (>;:ÅP) 1411105532...
- Page 2 This operating manual describes the Audio Analyzers ● ® R&S UPP200 ● ® R&S UPP400 ● ® R&S UPP800 and their options. © 2018 Rohde & Schwarz GmbH & Co. KG Mühldorfstr. 15, 81671 München, Germany Phone: +49 89 41 29 - 0 Fax: +49 89 41 29 12 164 Email: info@rohde-schwarz.com...
- Page 3 Basic Safety Instructions Always read through and comply with the following safety instructions! All plants and locations of the Rohde & Schwarz group of companies make every effort to keep the safety standards of our products up to date and to offer our customers the highest possible degree of safety. Our products and the auxiliary equipment they require are designed, built and tested in accordance with the safety standards that apply in each case.
- Page 4 Basic Safety Instructions Symbol Meaning Symbol Meaning Caution ! Hot surface Alternating current (AC) Protective conductor terminal Direct/alternating current (DC/AC) To identify any terminal which is intended for connection to an external conductor for protection against electric shock in case of a fault, or the terminal of a protective earth Earth (Ground) Class II Equipment...
- Page 5 Basic Safety Instructions Operating states and operating positions The product may be operated only under the operating conditions and in the positions specified by the manufacturer, without the product's ventilation being obstructed. If the manufacturer's specifications are not observed, this can result in electric shock, fire and/or serious personal injury or death. Applicable local or national safety regulations and rules for the prevention of accidents must be observed in all work performed.
- Page 6 Basic Safety Instructions 6. The product may be operated only from TN/TT supply networks fuse-protected with max. 16 A (higher fuse only after consulting with the Rohde & Schwarz group of companies). 7. Do not insert the plug into sockets that are dusty or dirty. Insert the plug firmly and all the way into the socket provided for this purpose.
- Page 7 Basic Safety Instructions 2. Before you move or transport the product, read and observe the section titled "Transport". 3. As with all industrially manufactured goods, the use of substances that induce an allergic reaction (allergens) such as nickel cannot be generally excluded. If you develop an allergic reaction (such as a skin rash, frequent sneezing, red eyes or respiratory difficulties) when using a Rohde &...
- Page 8 Basic Safety Instructions 2. Adjustments, replacement of parts, maintenance and repair may be performed only by electrical experts authorized by Rohde & Schwarz. Only original parts may be used for replacing parts relevant to safety (e.g. power switches, power transformers, fuses). A safety test must always be performed after parts relevant to safety have been replaced (visual inspection, protective conductor test, insulation resistance measurement, leakage current measurement, functional test).
- Page 9 Basic Safety Instructions 3. If you use the product in a vehicle, it is the sole responsibility of the driver to drive the vehicle safely and properly. The manufacturer assumes no responsibility for accidents or collisions. Never use the product in a moving vehicle if doing so could distract the driver of the vehicle. Adequately secure the product in the vehicle to prevent injuries or other damage in the event of an accident.
- Page 10 Instrucciones de seguridad elementales Instrucciones de seguridad elementales ¡Es imprescindible leer y cumplir las siguientes instrucciones e informaciones de seguridad! El principio del grupo de empresas Rohde & Schwarz consiste en tener nuestros productos siempre al día con los estándares de seguridad y de ofrecer a nuestros clientes el máximo grado de seguridad. Nuestros productos y todos los equipos adicionales son siempre fabricados y examinados según las normas de seguridad vigentes.
- Page 11 Instrucciones de seguridad elementales Señalización de seguridad de los productos Las siguientes señales de seguridad se utilizan en los productos para advertir sobre riesgos y peligros. Símbolo Significado Símbolo Significado Aviso: punto de peligro general Tensión de alimentación de PUESTA EN MARCHA / PARADA Observar la documentación del producto Atención en el manejo de dispositivos de peso...
- Page 12 Instrucciones de seguridad elementales Palabras de señal y su significado En la documentación del producto se utilizan las siguientes palabras de señal con el fin de advertir contra riesgos y peligros. Indica una situación de peligro que, si no se evita, causa lesiones graves o incluso la muerte.
- Page 13 Instrucciones de seguridad elementales Seguridad eléctrica Si no se siguen (o se siguen de modo insuficiente) las indicaciones del fabricante en cuanto a seguridad eléctrica, pueden producirse choques eléctricos, incendios y/o lesiones graves con posible consecuencia de muerte. 1. Antes de la puesta en marcha del producto se deberá comprobar siempre que la tensión preseleccionada en el producto coincida con la de la red de alimentación eléctrica.
- Page 14 Instrucciones de seguridad elementales 11. A menos que esté permitido expresamente, no retire nunca la tapa ni componentes de la carcasa mientras el producto esté en servicio. Esto pone a descubierto los cables y componentes eléctricos y puede causar lesiones, fuego o daños en el producto. 12.
- Page 15 Instrucciones de seguridad elementales 5. Ciertos productos, como p. ej. las instalaciones de radiocomunicación RF, pueden a causa de su función natural, emitir una radiación electromagnética aumentada. Deben tomarse todas las medidas necesarias para la protección de las mujeres embarazadas. También las personas con marcapasos pueden correr peligro a causa de la radiación electromagnética.
- Page 16 Instrucciones de seguridad elementales Baterías y acumuladores o celdas Si no se siguen (o se siguen de modo insuficiente) las indicaciones en cuanto a las baterías y acumuladores o celdas, pueden producirse explosiones, incendios y/o lesiones graves con posible consecuencia de muerte. El manejo de baterías y acumuladores con electrolitos alcalinos (p. ej. celdas de litio) debe seguir el estándar EN 62133.
- Page 17 Instrucciones de seguridad elementales Eliminación/protección del medio ambiente 1. Los dispositivos marcados contienen una batería o un acumulador que no se debe desechar con los residuos domésticos sin clasificar, sino que debe ser recogido por separado. La eliminación se debe efectuar exclusivamente a través de un punto de recogida apropiado o del servicio de atención al cliente de Rohde &...
- Page 18 Customer Support Technical support – where and when you need it For quick, expert help with any Rohde & Schwarz product, contact our customer supportcenter. A team of highly qualified engineers provides support and works with youto find a solution to your query on any aspect of the operation, programming or applicationsof Rohde &...
-
Page 19: Table Of Contents
® Contents R&S Contents 1 Introduction..................19 Key Features........................19 For Your Safety......................19 Documentation Overview................... 19 2 Startup....................21 Description of the Front View..................21 2.1.1 USB Connectors......................22 2.1.2 Digital Audio Interfaces....................22 2.1.3 Digital Audio/HDMI Interfaces..................23 2.1.4 Multi-channel generator....................26 2.1.5 Analog Audio Interfaces.................... - Page 20 ® Contents R&S Connecting an External Monitor................42 2.8.1 Changing Screen Resolution of External Monitor under Windows XP......43 2.8.2 Changing Screen Resolution of External Monitor under Windows 7......44 Installing Options......................44 2.10 Connect R&S UPP to a Network (LAN)..............45 2.10.1 Connection to the Network....................45 2.10.2 Configuration of R&S UPP for Network Operation............46...
- Page 21 ® Contents R&S 3.3.4 Quickstart Panel......................77 3.3.5 Structure of the Panels and Display Windows.............. 81 3.3.6 Basic Rules of Operation....................83 3.3.7 Function Selection and Value Entry................83 3.3.8 Input Help........................87 3.3.9 Measurement Functions and Displaying Measurement Results........87 Introduction to Instrument Operation Using Examples.......... 91 3.4.1 Measuring the Frequency Response of an Amplifier, Equalizer, etc......91 3.4.2...
- Page 22 ® Contents R&S 4.7.3 Changing Functions....................133 4.7.4 Hiding Parameter Fields....................133 4.7.5 Highlighting Controls....................134 4.7.6 Activating/Deactivating Functions – Checkboxes............134 4.7.7 Toggling Functions – Radio Buttons................135 4.7.8 Selecting a Parameter – Selection Fields..............135 4.7.9 Numeric Entries – Numeric Entry Fields..............136 4.7.10 Alphanumeric Entries –...
- Page 23 ® Contents R&S 4.18 Overview of Keys...................... 188 4.19 Overview of Panels and Measurement Displays (Graphical Windows)....190 4.20 Overview of Status Messages..................193 5 Instrument Functions................ 195 Selecting the Generator....................195 5.1.1 Generator Configuration Panel................... 195 Configuring Analog Generator................196 5.2.1 Analog Generator Config Panel..................
- Page 24 ® Contents R&S 5.6.7 Random........................249 5.6.8 Arbitrary........................255 5.6.9 Play..........................256 5.6.10 Polarity........................263 5.6.11 DC (Direct-Current Voltage)..................264 5.6.12 Chirp..........................265 5.6.13 Universal........................268 5.6.14 Lip Sync........................277 Equalization....................... 279 Protocol Generator....................280 5.8.1 Higher-Level Settings....................280 5.8.2 Setting Bytes as Numerical Values................283 5.8.3 Setting Bytes in Remote-Control Mode...............283 5.8.4...
- Page 25 ® Contents R&S 5.13.3 Interface Assignment....................322 5.14 Configuring the HDMI Analyzer................325 5.14.1 HDMI Analyzer Configuration Panel................325 5.14.2 Signal Flow between DUT and R&S UPP ..............334 5.14.3 Interface Assignment of HDMI..................335 5.14.4 Interface Assignment of HEC..................335 5.14.5 HEAC Support......................336 5.15 Starting Measurements....................
- Page 26 ® Contents R&S 5.23.4 MOD DIST........................396 5.23.5 DFD..........................398 5.24 Polarity Measurement....................400 5.25 Frequency Band Analysis..................401 5.25.1 Nth Octave Analysis....................401 5.26 FFT Analysis......................408 5.26.1 Size of the FFT......................409 5.26.2 Window Function......................410 5.26.3 Post FFT........................411 5.26.4 FFT Measurement Function..................412 5.27 Noise Voltage Density....................419 5.28 Delay Measurement....................
- Page 27 ® Contents R&S 5.38.5 Examples of Settling ....................466 5.39 Filter........................... 466 5.39.1 Analyzer Prefilter......................467 5.39.2 Analyzer Function Filters.....................467 5.39.3 Generator Filters......................467 5.39.4 Filter Table........................468 5.40 User-Definable Filters....................469 5.40.1 Filters 01 to 09......................470 5.40.2 Lowpass Filter and Highpass Filter................471 5.40.3 Bandpass Filters and Bandstop Filters...............
- Page 28 ® Contents R&S 5.47.3 Parameter Fields of the Panel..................571 5.47.4 Softkey Menu......................574 5.48 Numeric display......................574 5.48.1 Graphical Display, Explanation of the Elements............575 5.48.2 Calling Up........................578 5.48.3 Parameter Fields of the Panel..................578 5.48.4 Softkey Menu......................578 5.49 Combi Display......................578 5.49.1 Graphical Display, Explanation of the Elements............579 5.49.2...
- Page 29 ® Contents R&S 5.57 Loading and Saving....................629 5.58 Loading and Saving Setups..................630 5.58.1 Saving Setups......................630 5.58.2 Loading Setups......................630 5.59 Printing and Saving....................630 5.59.1 Printing and Saving Display Screen................630 5.59.2 Configuring Print and Save Operations...............631 5.59.3 Starting Print and Save Operations................631 5.59.4 Graphic Properties......................
- Page 30 ® Contents R&S 6.6.7 Triggering Measurement or Sweep................660 6.6.8 Command Synchronization..................660 Command Recording....................661 6.7.1 Starting Recording...................... 662 6.7.2 Recording Commands....................662 6.7.3 Editing Commands......................663 Status Reporting System..................663 6.8.1 Structure of SCPI Status Register................664 6.8.2 Overview of Status Registers..................666 6.8.3 Status Byte (STB) and Service Request Enable (SRE) Register........667 6.8.4...
- Page 31 ® Contents R&S 7.4.2 Configuring the Analog Analyzer.................721 7.4.3 Configuring the Digital Analyzer..................724 7.4.4 Configuring the I S Analyzer..................726 7.4.5 Configure HDMI Analyzer................... 727 Triggering Measurements and Reading Results............730 7.5.1 Starting Measurements....................730 7.5.2 Start Conditions......................733 7.5.3 External Sweeps and Level-Controlled Measurement Value Triggering..... 735 7.5.4 Reading Measurement Results...................736 7.5.5...
- Page 32 ® Contents R&S 7.15 Protocol Analysis......................768 7.16 Delay Measurement....................769 7.17 Lip-Sync Analysis..................... 769 7.18 Frequency, Phase and Group Delay Measurement..........770 7.19 Input, Second and Level Monitor................770 7.20 Settling Methods....................... 771 7.21 Filters......................... 772 7.22 Auxiliaries Panel....................... 777 7.23 Switcher........................779 7.24 Traces, Spectrum Displays and Bargraphs............
- Page 33 ® Contents R&S 8.4.2 Examples of Cascade Configuration................860 8.4.3 Switching Cascade Off and On Again................. 861 8.4.4 Dissolving Cascade.....................861 8.4.5 Status and Errors During Connection Setup............... 862 Operating Modes.......................863 Manual Operation of a Cascade................863 8.6.1 Operating Method....................... 863 Remote Control......................867 8.7.1 Operating Slaves from Master..................
- Page 34 ® Contents R&S User Manual 1411.1055.32 ─ 10...
-
Page 35: Introduction
® Introduction R&S Documentation Overview 1 Introduction High measurement speed, parallel signal processing in multichannel applications, and high reliability in continuous operation are vital requirements to be met by audio ana- lyzers for use in production. If a cost-efficient instrument for system use is what you need, the solution is the R&S UPP audio analyzer. - Page 36 ® Introduction R&S Documentation Overview The printed getting started manual and the basic safety instruction are delivered together with the instrument. The getting started describes how to set up and start working with the instrument, it includes basic operations and general information, e.g. safety instructions, ●...
-
Page 37: Startup
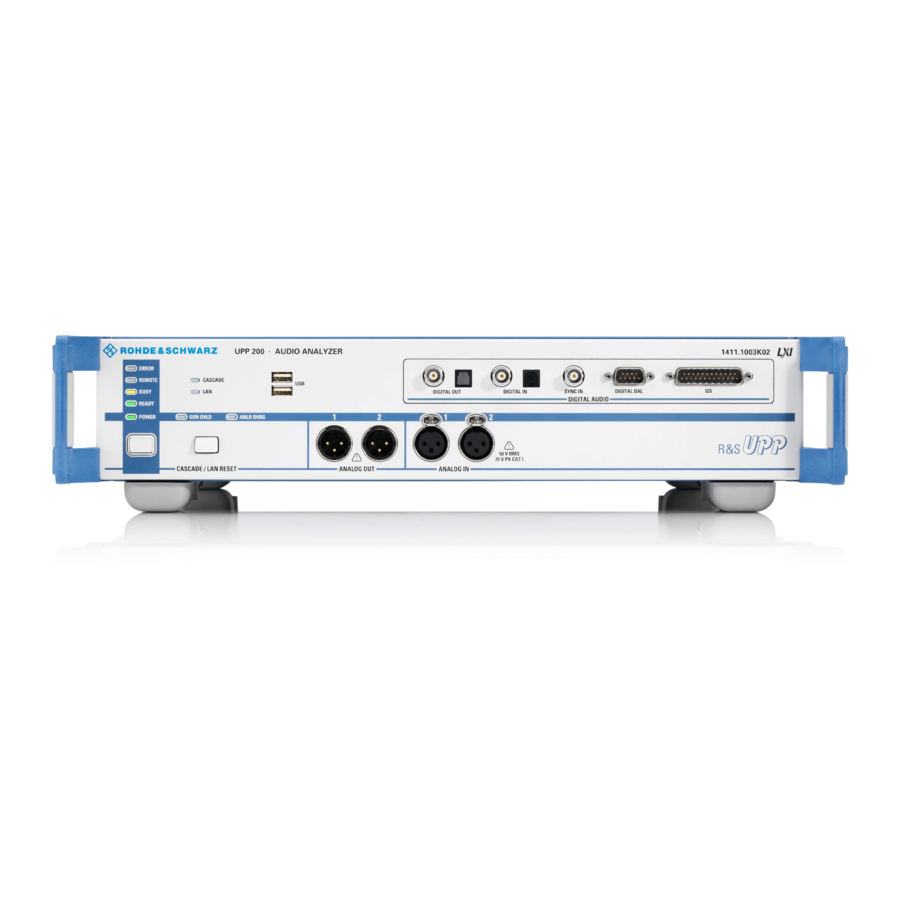
® Startup R&S Description of the Front View 2 Startup The R&S UPP audio analyzer is available in three models. The 8-channel instrument R&S UPP 800, the 4-channel instrument R&S UPP 400 and the 2-channel instrument R&S UPP 200. The instruments are offered without display, without front panel controls and without CD/DVD drive. -
Page 38: Usb Connectors
® Startup R&S Description of the Front View ‑ channel instrument), also representative for R&S UPP 200 Figure 2-1: Front view of R&S UPP 400 (4 ‑ channel instrument) and R&S UPP 800 (8 ‑ channel instrument) with installed ‑ B2 option (digital audio interfaces). R&S UPP 1 = USB Connectors 2 = Digital audio/HDMI interfaces or multichannel generator... -
Page 39: Digital Audio/Hdmi Interfaces
® Startup R&S Description of the Front View [DIGITAL OUT] BNC output for the SPDIF or AES/EBU format acc. to EIAJ CP-340 and optical output acc. to the TOSLINK system. A double-shielded BNC cable must be used to maintain EMC Class B. [DIGITAL IN] BNC input for the SPDIF or AES/EBU format acc. - Page 40 ® Startup R&S Description of the Front View [DIGITAL IN] BNC input for the SPDIF or AES/EBU format acc. to EIAJ CP-340 and optical input acc. to the TOSLINK system. A double-shielded BNC cable must be used to maintain EMC Class A. [SYNC IN] BNC synchronization input for the generator instrument "Digital Audio"...
- Page 41 ® Startup R&S Description of the Front View [SINK] HDMI 1.4 analyzer socket with HEAC support. Various measurement functions are available for the audio and video signals fed in at this interface. To maintain EMC Class A, a suitable HDMI cable with multiple shielding and two ferrites (e.g. Würth Elektronik split ferrite 722-712-21) as well as a maximum length of 3 m is to be used.
-
Page 42: Multi-Channel Generator
® Startup R&S Description of the Front View 2.1.4 Multi-channel generator Generator with analog and digital outputs. Note This interface is only available if the R&S UPP‑B8 option (multichannel audio genera- tor) is installed! [ANALOG OUT] Eight analog outputs brought out on the pins of a 25-pin D-Sub socket. As an accessory for the R&S UPP‑B8 option (multichannel audio generator), a break- out cable with a 25‑pin D‑Sub connector on the one end and eight XLR connectors on the other end is available (R&S UP‑Z8A option;... -
Page 43: Analog Audio Interfaces
® Startup R&S Description of the Front View [DIGITAL OUT] Eight outputs in S/P DIF format in accordance with IEC 60958 (Unbal), which are brought out to a 9‑pin D‑Sub socket. As an accessory for the R&S UPP‑B8 option (multichannel audio generator), a break- out cable with a 9‑pin D‑Sub connector on the one end and five XLR connectors on the other end is available (R&S UP‑Z8D option;... -
Page 44: Lan Reset Button
® Startup R&S Description of the Front View 2.1.6 LAN RESET button [CASCADE / LAN RESET] The LAN RESET button has three functions: ● Configuration of an R&S UPP cascade: A short key press combines several UPP instruments into one measurement unit with more than 8 analog audio channels, see Chapter 8.4, "Configuration of a Cas- cade",... -
Page 45: Status Leds
® Startup R&S Description of the Front View 2.1.8 Status LEDs [ERROR] ● LED is lit (not flashing): The instrument detected an error during the measure- ment ● LED is flashing: The instrument detected an error during the configuration of the cascading [REMOTE] The instrument is controlled remotely... -
Page 46: Description Of The Rear Panel
® Startup R&S Description of the Rear Panel [ANLR OVRG] ● LED is red: One of the analog audio inputs is overloaded. The level of the are present signal is too high for the current band. Signals outside the IF "Bandwidth" can result in overranging. -
Page 47: Pc Interfaces
® Startup R&S Description of the Rear Panel 2.2.2 PC interfaces [DVI-D] DVI-D socket for connecting an external monitor to the instrument. It is recommended to use a very well shielded cable with ferrite sleeves. [LAN] LAN interface for ● integrating the audio analyzer in a network, e.g. -
Page 48: Bnc Monitor Outputs
® Startup R&S Description of the Rear Panel [TRIGGER OUT] ● Required for cascading and must be connected with TRIGGER IN of the next instrument ● The trigger output level is 3.3 V ● Can be used for connecting to a device under test. 2.2.4 BNC monitor outputs The instrument settings determine which signal is present at these BNC sockets: ●... -
Page 49: Putting Into Operation
® Startup R&S Putting into Operation ● 0: The instrument is disconnected from the AC supply ● 1: The instrument is supplied by the AC supply voltage. Depending on the activa- tion of the standby mode pushbutton, the instrument is either in standby mode (POWER LED is yellow) or it is switched on (POWER LED is green) 2.3 Putting into Operation The following section describes how to put the instrument into operation, connect... -
Page 50: Setting Up The Instrument
® Startup R&S Putting into Operation Packaging material It is recommended to retain the packaging. It is advisable to keep the original packing material in order to prevent control elements and connectors from being damaged in case the instrument is to be transported or shipped at a later date. 2.3.2 Setting Up the Instrument The instrument is intended for indoor use. - Page 51 ® Startup R&S Putting into Operation EMI Suppression To suppress electromagnetic interference (EMI), the instrument may be operated only if it is closed and all covers are in place. The EMC class is listed on the data sheet. The following conditions must be maintained to avoid interference: ●...
-
Page 52: Connecting The R&S Upp To The Ac Supply
® Startup R&S Putting into Operation 2.3.2.2 Rack installation A rack adapter (refer to data sheet for Order No.) is required for installation in a 19" rack. The mounting instructions are supplied with the adapter. Possible damage to the instrument from overheating Restricted airflow at the side wall openings can cause the instrument to overheat. - Page 53 ® Startup R&S Putting into Operation When the instrument is connected to an AC supply, it automatically adjusts to the AC supply voltage (see the labeling for the voltage range). It is not necessary to manually adjust the instrument for a specific voltage or to change the fuse! 2.3.3.1 Switching on the Instrument 1.
- Page 54 ® Startup R&S Putting into Operation the instrument is in the same state as it was before power-off. After booting is com- pleted, the audio analyzer screen is displayed and the instrument can be operated manually via an external keyboard and a mouse or via remote control. 2.3.3.3 Restarting the R&S UPP ●...
-
Page 55: Function Check
® Startup R&S Presets sary, the power switch at the rear of the instrument can now be switched off without any problems to completely disconnect the instrument from the AC supply. ● With connected monitor, ext. keyboard and mouse – Click on Start, Shut Down, OK or the red Shutdown icon. -
Page 56: Windows Operating System
® Startup R&S Windows Operating System Analyzer input impedance 200 kΩ Frequency measurement 2.6 Windows Operating System Possible malfunction of the instrument function due to external software The instrument operates under the Windows operating system. This allows external software programs to be installed on the instrument. The use and installation of com- mercial off-the-shelf (COTS) software may impair the instrument's functionality. -
Page 57: Retrieving Computer Hardware Information And Windows Operating System
® Startup R&S Windows Operating System 2.6.1 Retrieving Computer Hardware Information and Windows Operat- ing System The function of some interfaces depends on which internal computer hardware the R&S UPP has been equipped with. This description makes reference to the computer hardware at some points. -
Page 58: Connecting External Keyboard And Mouse
® Startup R&S Connecting an External Monitor 2.7 Connecting External Keyboard and Mouse 2.7.1 Connecting an External Keyboard. The R&S UPP allows connecting a commercially available, external keyboard with USB interface. A keyboard simplifies the input of list entries, comment texts, file names, etc. -
Page 59: Changing Screen Resolution Of External Monitor Under Windows Xp
® Startup R&S Connecting an External Monitor Connection To prevent damage to the monitor and R&S UPP, the instrument must be switched off before an external monitor is connected. After connection, the external monitor is detected when the instrument is started (but not if it is connected while the instrument is in operation). -
Page 60: Changing Screen Resolution Of External Monitor Under Windows 7
® Startup R&S Installing Options Switching On the External Monitor The external monitor is usually switched on each time the R&S UPP is started to cor- rect any accidental changes to the monitor's starting configuration that may make it impossible to operate the instrument. If this measure does not show the usual user interface, connecting an external keyboard and using the shortcut CTRL + ALT + F4 forces the instrument to connect to the external monitor. -
Page 61: Connect R&S Upp To A Network (Lan)
® Startup R&S Connect R&S UPP to a Network (LAN) Software options These can be installed by the user alone; installation instructions and a unique activation code supplied with the option are required. Hardware options These are installed in the R&S UPP audio analyzer, can be retrofitted only by a Rohde &... -
Page 62: Configuration Of R&S Upp For Network Operation
® Startup R&S Connect R&S UPP to a Network (LAN) 2.10.2 Configuration of R&S UPP for Network Operation The network interface operates with 100-MHz Ethernet IEEE 802.3u. The TCP/IP net- work protocol and the associated network services are preconfigured. In order to exchange data in a local network (LAN), each connected computer or instrument must have a unique IP address or a unique computer name. - Page 63 ® Startup R&S Connect R&S UPP to a Network (LAN) an external keyboard are connected; connection of a mouse is recommended for easy operation. The instrument should be switched off before the monitor, keyboard and mouse are connected. This will ensure that they are correctly detected by the operating system.
- Page 64 ® Startup R&S Connect R&S UPP to a Network (LAN) 4. On the "General" tab in the field "This connection uses the following items:", mark the "Internet Protocol (TCP/IP)" selection and then click on "Properties". 5. In the "Internet Protocol (TCP/IP) Properties" menu, enter the IP address in the "Use the following IP address"...
- Page 65 ® Startup R&S Connect R&S UPP to a Network (LAN) When using Windows 7: 1. Open the Control Panel, then select "Network and Sharing Center". 2. Click on "Change adapter settings" and then right-click on "Local Area Connection" User Manual 1411.1055.32 ─ 10...
- Page 66 ® Startup R&S Connect R&S UPP to a Network (LAN) The "Networking" tabs opens. 3. Select "Internet Protocol Version 4 (TCP/IPv4)" and then click on "Properties". 4. Select "Use the following IP address:" and enter the IP address. 2.10.2.3 Querying the computer name When using Windows XP: 1.
- Page 67 ® Startup R&S Connect R&S UPP to a Network (LAN) When using Windows 7: ► "Click on Start – Control Panel - System" The computer name is displayed and can be changed. 2.10.2.4 Accessing directories in the network Access to network drives depends on access rights and whether the drives in question have been enabled.
-
Page 68: Configuration Via Lxi
® Startup R&S Connect R&S UPP to a Network (LAN) Both the computer and the audio analyzer must have a computer name and an IP address (see Chapter 2.10.2, "Configuration of R&S UPP for Network Operation", on page 46). The menu name may deviate from the name specified in the following operating sequence, depending on the language and on the operating system used on the com- puter. - Page 69 ® Startup R&S Connect R&S UPP to a Network (LAN) ● Class C instruments are characterized by a common LAN implementation, includ- ing an ICMP ping responder for diagnostics. The instruments can be configured via a web browser; a LAN Configuration Initialize (LCI) mechanism resets the LAN configuration.
- Page 70 ® Startup R&S Connect R&S UPP to a Network (LAN) 3) the instrument lost its IP address that was configured with DHCP and switched to Auto IP. This state is called "error state" and normally can be resolved by the LCI mech- anism (LAN reset).
- Page 71 ® Startup R&S Connect R&S UPP to a Network (LAN) The instrument's LXI browser interface works correctly with all W3C compliant brows- ers. To start the instrument home page (welcome page), open a browser on the PC and enter the instrument name or the IP address of R&S UPP in the address field, e.g. http://RSUPP800-180108 or http://10.215.1.100.
- Page 72 ® Startup R&S Connect R&S UPP to a Network (LAN) The left side shows a navigation bar containing the important "LAN Configuration" menu. This page of the LXI Web configuration website enables extensive configuration of all important LAN parameters, which is necessary because the configuration steps mentioned in the next sections cannot be performed as described with a virtual front panel instrument.
- Page 73 ® Startup R&S Connect R&S UPP to a Network (LAN) – are settings that may have to be changed at times compared to the displayed presets if DHCP is switched off. Consult the network administrator for the proper values if it is necessary to modify these settings. ●...
-
Page 74: Configuration For Manual Remote Operation
® Startup R&S Connect R&S UPP to a Network (LAN) VXI-11 is the protocol that is used for discovery of the instrument in the LAN. According to the standard, LXI instruments must use VXI-11 to provide a dis- covery mechanism; other additional search methods are permitted. 2.10.3.7 Ping Client Ping is a utility that verifies the connection between the LXI-compliant instrument and... - Page 75 ® Startup R&S Connect R&S UPP to a Network (LAN) ● the Windows 95 operating system or higher and the Remote Desktop Connection program are installed on the external computer and a LAN interface is configured for the network ● the audio analyzer and the computer are connected via LAN (see Chapter 2.10.2, "Configuration of R&S UPP for Network...
- Page 76 ® Startup R&S Connect R&S UPP to a Network (LAN) 2.10.4.2 Starting manual remote operation at the external computer The Remote Desktop Connection program is already installed in the Windows operat- ing system (program name "mstsc.exe" in "C:\Windows\System32"). . For all other Windows operating systems from Windows 95 and higher, the program can be down- loaded free-of-charge from the Internet (http://www.microsoft.com).
- Page 77 ® Startup R&S Connect R&S UPP to a Network (LAN) Before the program can be used for the first time, the instrument and user ID of the R&S UPP must be entered on the external computer. The instrument ID - the com- puter name of R&S UPP - identify the R&S UPP in the network.
-
Page 78: Firmware Update
® Startup R&S Firmware Update for the connection with R&S UPP is provided in the selection list which is called up by clicking on the button in the "Computer:" entry line. 5. The resolution for the display of the R&S UPP monitor is set to 800 x 600 on the Display tab. -
Page 79: Windows Xp Recovery And Backup
® Startup R&S Windows XP Recovery and Backup ● At the beginning, just before the progress bar starts, the progress window displays the text "InstallShield is preparing InstallScript". Occasionally you then see an error message and installation is canceled. This problem can usually be solved by restarting Windows and carrying out the firmware installation again. -
Page 80: Backup Current System Partition
® Startup R&S Windows XP Recovery and Backup 1. Switch the instrument off and on again Press the cursor keys multiple times during the boot phase to ensure that the Boot menu does not independently close after a short period of time. 2. -
Page 81: Restoring A Selected Version Of The System Partition
® Startup R&S Windows XP Recovery and Backup 3. Select the "Make Backup" button with the TAB keys. 4. Start the backup by pressing the [ENTER] key. After the backup, the "Windows XP Recovery and Backup Partition" menu appears again. 5. -
Page 82: Recover Factory Default
® Startup R&S Windows XP Recovery and Backup 2.12.4 Recover Factory Default 1. Select the "Factory Default" button in the Windows XP Recovery and Backup Parti- tion menu with the cursor keys to recover the factory default version of the system partition. -
Page 83: Windows 7 Recovery And Backup
® Startup R&S Windows 7 Recovery and Backup 3. Select the "Select Backup" button with the TAB keys. 4. Use the cursor keys and the [ENTER] key to select the backup to be removed. 5. Select the "Remove" button with the TAB keys. 6. -
Page 84: Calling Windows 7 Recovery And Backup Partition Menu
® Startup R&S Windows 7 Recovery and Backup During restore, the system partition (C:\) is deleted, formatted and rewritten. This does not apply to the data partition (D:\). 2.13.1 Calling Windows 7 Recovery and Backup Partition Menu If several backups are already stored on the hard disk, the remaining memory capacity might not be sufficient for an additional backup. -
Page 85: Restoring Factory Default
® Startup R&S Windows 7 Recovery and Backup 2.13.2 Restoring Factory Default To restore the "Factory Default" state, select "Factory Default". Using the TAB keys, select "Restore Selected" and confirm with ENTER. 2.13.3 Restoring a "User Backup" To restore a different backup, choose the selection list using the Shift+TAB key combi- nation and select the desired backup using the "up/down"... - Page 86 ® Startup R&S Windows 7 Recovery and Backup 3. Entries must be made in the "Name" and "Description" fields; the entries shown here are intended as examples only (the date and time are entered automatically). Select the "Start Backup" button using the TAB keys. 4.
-
Page 87: Deleting Backups
® Startup R&S Windows 7 Recovery and Backup 2.13.5 Deleting Backups Deleting factory default setting The factory default is treated in exactly the same way as a normal backup. Take care not to inadvertently delete the factory default! Using the TAB keys, select the backup to be deleted. Then select "Delete Selected" and confirm with ENTER. -
Page 88: Getting Started
® Getting Started R&S Important Information for Measurements 3 Getting Started 3.1 Introduction - Getting Started This chapter describes the manual operation of the R&S UPP audio analyzer. The information in this chapter also largely applies to the instrument designed primarily for use in systems provided that an external monitor, keyboard and mouse are connected to the instrument. -
Page 89: Avoiding Hum Loops
® Getting Started R&S Important Information for Measurements Possible Damage or Destruction of Input Circuits The generator of the audio analyzer can generate analog output voltages with an RMS of up to 14 V. These levels can damage or even destroy sensitive input circuits. There is an option in the "Generator Config"... -
Page 90: Help System
® Getting Started R&S Brief Introduction to Operation with the test setup via a standard XLR cable, it is grounded via the analyzer inputs if Pin 1 of the cable is connected with ground of the test setup. 3.2.3 Help System The audio analyzer has a context-sensitive help system. - Page 91 ® Getting Started R&S Brief Introduction to Operation freely choose the number of panels and the number of graphical windows to be shown in the display. The size of the windows can be changed within broad limits, whereby the font size, scaling and so on are adapted automatically (depending on the selected window).
-
Page 92: Panels And Display Windows
® Getting Started R&S Brief Introduction to Operation 3.3.3 Panels and Display Windows The R&S UPP audio analyzer distinguishes between the following panels and display windows: ● Quickstart panel for quick launching of the most commonly used audio measure- ment tasks. ●... -
Page 93: Quickstart Panel
® Getting Started R&S Brief Introduction to Operation 3.3.4 Quickstart Panel 3.3.4.1 Introduction Owing to the large number of measurement functions and setting options, beginners can often find the R&S UPP audio analyzer difficult to operate. The quickstart panel provides assistance – it allows the inexperienced user to specify the outputs and inputs to which he wants to connect his "device under test"... - Page 94 ® Getting Started R&S Brief Introduction to Operation As users become more familiar with the R&S UPP audio analyzer, they can use the expert icon to change over from the quickstart panel to the normal user interface of the audio analyzer in order to access the full range of functions. 3.3.4.3 Description of Quickstart Panel Controls 1.
- Page 95 ® Getting Started R&S Brief Introduction to Operation The available selection depends on the R&S UPP audio analyzer and its options. The entries are self‑explanatory. Each time the generator output is changed, the combo box for selecting the desired measurement task (9) is reset (- - - - - -) and a new measurement task must be selected.
- Page 96 ® Getting Started R&S Brief Introduction to Operation The available selection depends on the settings made in the combo boxes (6) and (7). The entries are self‑explanatory. Example: If the "Analog, balanced" output has been selected in the combo box (6) for signal feed to the DUT, the measurement task "D/A Linearity"...
-
Page 97: Structure Of The Panels And Display Windows
® Getting Started R&S Brief Introduction to Operation 3.3.4.5 Messages During Operation When the "Set to reference" button is clicked, messages that indicate problems can appear. For example, "Set to reference" is only effective if the Y axis of the graphical display is set to the unit dBr. - Page 98 ® Getting Started R&S Brief Introduction to Operation ● Analyzer Function Selection of measurement functions ● Measurement speed and accuracy ● Activation of filter and equalizer ● Activation of Post FFT ● Selection and settings for level monitor ● Selection and settings for input monitor ●...
-
Page 99: Basic Rules Of Operation
® Getting Started R&S Brief Introduction to Operation ● Sweep Graph 1 to 4 Up to four of each of these display windows can be opened (depending on the window type) in order to display the scans of the different measurements FFT Graph 1 to 2 ●... - Page 100 ® Getting Started R&S Brief Introduction to Operation Highlighting Controls Click on the control with the mouse. The entry focus is indicated by a blue, green or magenta border. Activating/deactivating functions A checkbox is used to activate or deactivate functions. If the checkbox is active, the assigned setting is selected or enabled.
- Page 101 ® Getting Started R&S Brief Introduction to Operation Entering a Numeric Value Numeric values can be entered or edited in these fields. The following always applies: Entries outside the possible value range are not accep- ted; an audible warning is issued and the entry is changed to its permissible minimum or maximum value.
- Page 102 ® Getting Started R&S Brief Introduction to Operation ● In Direct mode, the physical value (number with the previously selected unit) is converted to the newly selected unit and adopted as the new numeric value. Information on Using Reference Values The audio analyzer allows reference values to be set in various places.
-
Page 103: Input Help
® Getting Started R&S Brief Introduction to Operation Adopting Parameters In many cases, settings are to apply e.g. to both measurement channels or to both traces. Here the R&S UPP provides multi-column panels which allow settings to be transferred from the left-hand to the right-hand column without the parameter having to be entered a second time. - Page 104 ® Getting Started R&S Brief Introduction to Operation ● What (which measurement function) is measured and how (which measurement method) measurement is performed, is preset in the "Analyzer Function" panel. ● The configuration panels for measured value display are used to determine how the measurement results are presented (i.e.
- Page 105 ® Getting Started R&S Brief Introduction to Operation Combo Display The combo display is used if the numeric value of a measurement result is to be sup- plemented by analog bar graphs, limit monitoring or the storage of maximum and mini- mum values.
- Page 106 ® Getting Started R&S Brief Introduction to Operation Graphical Window The most informative way of displaying measurement results is to use a two-dimen- sional graph. The audio analyzer makes a distinction between the following graphical windows: ● Sweep Graph ● FFT Graph ●...
-
Page 107: Introduction To Instrument Operation Using Examples
® Getting Started R&S Introduction to Instrument Operation Using Examples 3.4 Introduction to Instrument Operation Using Examples 3.4.1 Measuring the Frequency Response of an Amplifier, Equalizer, etc. This example is based on the factory settings of the audio analyzer. It explains the changes made in the individual panels to set up the measurement and describes how to graphically display the measurement results. - Page 108 ® Getting Started R&S Introduction to Instrument Operation Using Examples a) The basic settings for configuring the generator are made in the "Generator Config" panel. The frequency response is usually measured on both channels; this is already configured in the "Channel" field. From serial numbers 120100, 140100, 180100 and depending on the DUT, the "Output Type"...
- Page 109 ® Getting Started R&S Introduction to Instrument Operation Using Examples The parameter list closes and a number of additional fields appear in which fur- ther sweep parameters can be set. e) The "Next Step" field remains set to "Anlr Sync". This setting causes the next sweep step to be triggered as soon as a valid measurement result is available in the analyzer part.
- Page 110 ® Getting Started R&S Introduction to Instrument Operation Using Examples g) The values for the start and stop frequency of the sweep must be entered in the two fields "Start" and "Stop". Highlighting the desired field gives it the green selection frame. The desired fre- quency value can now be entered directly (here: 20 Hz).
- Page 111 ® Getting Started R&S Introduction to Instrument Operation Using Examples a) The basic settings for configuring the analyzer are made in the "Analyzer Con- fig" panel. In order to operate the panel, it must be selected and have the focus. The frequency response is usually measured on all channels;...
- Page 112 ® Getting Started R&S Introduction to Instrument Operation Using Examples c) The following are set in the Analyzer Function panel: ● what is measured (which measurement function) and ● how measurement is performed (which measurement method) The RMS value of the voltage must be measured for the frequency response measurement described here;...
- Page 113 ® Getting Started R&S Introduction to Instrument Operation Using Examples The panels for configuring the measured value display are used to determine how the measurement results are presented (i.e. which unit, how many digits, etc.). A series of panels for the different measurement windows are provided for this pur- pose.
- Page 114 ® Getting Started R&S Introduction to Instrument Operation Using Examples c) The "Single" button of the toolbar (single arrow) or "Ctrl F6" of the external key- board can be used to start the sweep only once; after the sweep cycle is com- plete, the status field indicates "Sweep Terminated".
- Page 115 ® Getting Started R&S Introduction to Instrument Operation Using Examples d) The traces can display the results of the different measurements available in the R&S UPP. For the frequency response measurement, the measurement results for the measurement function selected in the Function field in the Analyzer Function panel (here the RMS measurement) must be displayed graphically.
- Page 116 ® Getting Started R&S Introduction to Instrument Operation Using Examples h) The default settings for the x‑axis are also mostly correct for this example: By selecting a frequency sweep in the Generator Function panel, the x‑axis is automatically defined as the frequency axis with the unit Hz. If "Auto"...
- Page 117 ® Getting Started R&S Introduction to Instrument Operation Using Examples a) A default reference value of 1 V is set in the Reference field. This value must be replaced by the output voltage value of the DUT measured with the reference frequency of 1 kHz. The R&S UPP offers a very simple way of doing this: If the parameter list is opened in the "Reference"...
-
Page 118: Measuring Total Harmonic Distortion (Thd+N) Of A Dut
® Getting Started R&S Introduction to Instrument Operation Using Examples d) If the measurement result of the second channel has been selected for Trace B, the graphical display for the measured frequency response of the DUT may look like the example shown below. 8. - Page 119 ® Getting Started R&S Introduction to Instrument Operation Using Examples a) In the "Generator Config" panel, the basic settings for configuring the generator in this example are the same as those set for the frequency response measure- ment described in the previous section. Depending on the DUT, "Output Type"...
- Page 120 ® Getting Started R&S Introduction to Instrument Operation Using Examples a) The basic settings for configuring the analyzer are again made in the "Analyzer Config" panel. These settings are made in the same way as shown in the previous example. b) Next, the "Analyzer Function"...
- Page 121 ® Getting Started R&S Introduction to Instrument Operation Using Examples a) In the default instrument setup, the numeric measurement display is already open. If the DUT is correctly connected to the audio analyzer, the measured values for the total harmonic distortion can be read off in the first column. In the default setup, THD+N values are given in dB;...
- Page 122 ® Getting Started R&S Introduction to Instrument Operation Using Examples c) Open the menu bar and from the selection list under the "DispConfig" button, select the "FFT Graph 1 Config" panel. As explained in the previous example, the way in which the measurement results are presented is determined in the configuration panels.
- Page 123 ® Getting Started R&S Introduction to Instrument Operation Using Examples The settings for the unit, y‑axis scaling and grid are already preset in the default setup; a result should therefore be visible. If necessary, these settings must be adjusted. The settings for the x‑axis are also mostly correct for this example; they were explained in the previous example.
- Page 124 ® Getting Started R&S Introduction to Instrument Operation Using Examples cursors and markers can only be operated using the softkey bar; the required soft- keys are displayed at the bottom of the screen as soon as the graphical window has the focus. The softkeys are arranged in several levels;...
- Page 125 ® Getting Started R&S Introduction to Instrument Operation Using Examples b) Using cursors: Activating the "Cursor" button displays the cursor softkeys: The audio analyzer uses two cursors which are identified by the symbols ⃝ and X. These symbols are used to mark the measured points in the graph (see the example graph below).
-
Page 126: Loading Predefined Instrument Setups
® Getting Started R&S Loading Predefined Instrument Setups c) With activated markers and a cursor, the graphical display of the output signal with its harmonics may look like the example shown below. 7. Step: Saving this instrument setup This example can also be saved as an instrument setup. Saving is performed as described in the previous example. - Page 127 ® Getting Started R&S Loading Predefined Instrument Setups Basic settings for analog inputs/outputs: ● All channels of the generator and analyzer are active; the unbalanced generator output signal with minimum output impedance and maximum analyzer input impe- dance are used. ●...
-
Page 128: Manual Operation
® Manual Operation R&S Introduction - Manual Operation 4 Manual Operation 4.1 Introduction - Manual Operation The R&S UPP audio analyzer is available in three model variants that differ about the number of analog analyzer channels: The R&S UPP can be ordered with 8 (R&S UPP800), 4 (R&S UPP400) or 2 (R&S UPP200) channels. -
Page 129: Functional Division Of The Audio Analyzer
® Manual Operation R&S Functional Division of the Audio Analyzer the instrument is described in Chapter 6, "Remote Control - Fundamentals", on page 638 and Chapter 7, "Remote Control - Command Description", on page 680. 4.2 Functional Division of the Audio Analyzer 4.2.1 Instrument Concept The audio analyzer combines the following components in a single housing: ●... - Page 130 ® Manual Operation R&S Functional Division of the Audio Analyzer The generators of the R&S UPP are operated in two stages: 1. In the first step, the following settings are made in the "Generator Config" panel: ● the audio interfaces at which the test signals are to be output ●...
-
Page 131: Analyzers
® Manual Operation R&S Functional Division of the Audio Analyzer 4.2.3 Analyzers The R&S UPP performs all measurements using digital signal processing. Here, ana- log signals to be measured are first subjected to complex analog preprocessing on analog measurement modules before they are digitized and fed to the digital measure- ment routines. - Page 132 ® Manual Operation R&S Functional Division of the Audio Analyzer The pre-filter, which can be looped into the signal path before all other analyses, is located in front of the level monitor. Here you can analyze the RMS value, the peak value or the DC voltage component of the signal to be tested.
- Page 133 ® Manual Operation R&S Functional Division of the Audio Analyzer 1. Operation begins in the "Analyzer Config" panel with the selection of: ● analog or digital input connectors ● number of channels ● AC or DC coupling ● IF bandwidth ●...
- Page 134 ® Manual Operation R&S Functional Division of the Audio Analyzer 2. In the second step, the measurements are set at the various analysis levels in the "Analyzer Function" panel. The measurements are set in the order of their importance: ● Measurements at the function level, e.g.
-
Page 135: General Information On Operation
® Manual Operation R&S General Information on Operation 3. If the monitor outputs at the rear of the instrument are to be used, these settings are made in the "Auxiliaries" panel. 4. The following settings can be made in other panels: ●... -
Page 136: Operation Using The Mouse
® Manual Operation R&S General Information on Operation Operation follows the same basic rules which apply to other Windows programs in use today. It is assumed that the user is familiar with these basic rules. This information is therefore not given in detail in this manual. 4.3.2 Operation Using the Mouse Similar to other Windows®... - Page 137 ® Manual Operation R&S General Information on Operation The keys or shortcuts on the external computer keyboard correspond to the following instrument functions: Computer key- Function Computer keyboard Function board F5 to F12 Softkeys 1 to 8 0 to 9; a to z 0 to 9;...
-
Page 138: The Display
® Manual Operation R&S The Display Computer key- Function Computer keyboard Function board PAGE ∆ PAGE UP ALT + P PRESET function switches the instrument to default setting Scroll down in selection lists, var- iation of numeric values in input fields SHIFT+TAB Scroll up in selec-... -
Page 139: Softkeys
® Manual Operation R&S The Display Figure 4-1: R&S UPP display with its 5 screens The user can toggle between the individual screens in the following way: ● Using the PC keyboard using the shortcuts CTRL + PAGE UP or CTRL + PAGE DOWN ●... -
Page 140: Moving And Resizing Panels And Graphical Windows
® Manual Operation R&S The Display If there are more than eight elements to choose from, the hidden elements in the selec- tion list can be displayed by pressing the last softkey containing the >> symbol or the first softkey containing the << symbol. Pressing the respective softkey permits rapid selection. - Page 141 ® Manual Operation R&S The Display 4.4.4.1 Status Displays The status of the R&S UPP is continuously displayed for the generator, analyzer, sweep system and other instrument states at the bottom of the screen above the four right-hand softkeys. Status displays always appear at the same position; they are assigned to the fields above the softkeys as shown below.
-
Page 142: Panels
® Manual Operation R&S Panels 4.4.4.5 Error Messages If faults in the instrument occur during operation, an error message appears in the mid- dle of the screen. This message remains on screen until it is acknowledged with ENTER. 4.5 Panels In the case of the audio analyzer, associated settings and functions are always com- bined in "panels". -
Page 143: Panel Structure
® Manual Operation R&S Panels ● Open panel Panels/display windows are open if they are visible on the currently displayed screen. A panel is opened on the currently displayed screen by activating the menu bar, moving the mouse over the "Instruments", "DispConfig" or "Displays" selection items and clicking on a panel in the pulldown menu that opens. - Page 144 ® Manual Operation R&S Panels on page 135. The panels have the look and feel of the Windows® interface. They dif- fer in detail depending on their function but they consist of the same main elements. Panels consist of up to three columns, depending on the function block on which the panel is based.
- Page 145 ® Manual Operation R&S Panels In panels, parameter fields which belong together with respect to their function are frequently combined in function groups. Gray lines indicate these groups. ● Numeric entry field A numeric value (e.g. the frequency) can be entered in this field. ●...
- Page 146 ® Manual Operation R&S Panels button indicates that a parameter list is available. The pulldown parameter list is displayed below the selection field. Depending on the number of items, the full list or only part of it is shown. Only one item at a time can be selected from the parameter list.
-
Page 147: Navigating In The Panels
® Manual Operation R&S Settings in the Panels In general, an effort has been made to keep the panels as short as possible. For this reason, unneeded fields are hidden. The above example shows this: The fields "Meas Mode", "Trace Length" and "Trigger Source" appear only if the Waveform function is activated. -
Page 148: Focus
® Manual Operation R&S Settings in the Panels 4.7.1 Focus Panels can only be operated if they have the focus (indicated by the blue title bar). Before settings can be made in a panel, the relevant parameter field must be highligh- ted, i.e. -
Page 149: Changing Functions
® Manual Operation R&S Settings in the Panels Example: In the case of analog instruments, all settings for configuring the analog interfaces are available (e.g. coupling); all settings for the other instruments, e.g. the digital sampling rate and so on, do not appear in the panel but remain in the background. -
Page 150: Highlighting Controls
® Manual Operation R&S Settings in the Panels sweep parameter fields are hidden. The user is presented with a shorter panel and is not burdened with parameter fields which are currently not needed. The sequence of the individual parameter fields in the panel is such that changes to parameters usually only cause changes in the fields below. -
Page 151: Toggling Functions - Radio Buttons
® Manual Operation R&S Settings in the Panels 4.7.7 Toggling Functions – Radio Buttons Radio buttons are used for functions which can be toggled between two settings. A black dot in the appropriate button indicates the selected status. Only one of the two options can be active at any one time. To toggle a function, click on the corresponding radio button using the mouse. -
Page 152: Numeric Entries - Numeric Entry Fields
® Manual Operation R&S Settings in the Panels Function Computer keyboard Mouse Open parameter list Press the Enter key. Click button. Scroll Move the displayed section of the Activate the UP or DOWN button list using the up/down cursor in the scrollbar until the desired keys. - Page 153 ® Manual Operation R&S Settings in the Panels The number entry can also be completed with the entry of the unit. Simply entering values such as "m" to the set voltage value to mV or "k" to set a frequency value to kHz is sufficient here.
- Page 154 ® Manual Operation R&S Settings in the Panels This is done differently depending on the selected mode: ● In Edit mode, the newly entered numeric value is adopted and set together with the selected unit. ● In Direct mode, the physical value (number with the previously selected unit) is converted to the newly selected unit and adopted as the new numeric value.
-
Page 155: Alphanumeric Entries - Text Entry Fields
® Manual Operation R&S Settings in the Panels Function Computer keyboard Mouse Entering a new value: Highlight the numeric entry field and enter the new value directly (Edit mode) using the number keys. Changing individual numbers Highlight the numeric entry field, position the digit cursor with the >... -
Page 156: Display Fields
® Manual Operation R&S Settings in the Panels before the first character is entered, the old text will not be deleted). The default setting is insert mode. It is only possible to change between insert and overwrite mode if an external computer keyboard is used. -
Page 157: Adopting Parameters - Track Box
® Manual Operation R&S Settings in the Panels 4.7.12 Adopting Parameters – Track Box In many cases, settings are to apply e.g. to both measurement channels or to both traces. Here the R&S UPP provides multi-column panels which allow settings to be transferred from the left-hand to the right-hand column without the parameter having to be entered a second time. -
Page 158: Completing Settings
® Manual Operation R&S Settings in the Panels Below is an example for entering the generator output voltage: Additional units can be selected with the >> button: 4.7.14 Completing Settings For the entry of numeric values, the R&S UPP distinguishes between Edit mode (iden- tified by a green selection frame) and Direct mode (identified by a magenta selection frame). -
Page 159: Entries During Measurement Or Data Output
® Manual Operation R&S Measurement Displays Function Computer keyboard Mouse Varying numeric values with Highlight the numeric entry field, immediate adoption by hardware switch to Direct mode with the Enter key; position the digit cursor (Direct mode) with the > or < cursor keys. Change the numeric value with the UP/DOWN cursor keys. -
Page 160: Measurement Functions And Displaying Measurement Results
® Manual Operation R&S Measurement Displays 4.8.1 Measurement Functions and Displaying Measurement Results ● What (which measurement function) is measured and how (which measurement method) measurement is performed, is preset in the "Analyzer Function" panel. ● The configuration panels for measured value display are used to determine how the measurement results are presented (i.e. - Page 161 ® Manual Operation R&S Measurement Displays ● Column 3: Measurement results for the "Input Peak" function. ● Column 4: Display of either the frequency measurement result or, if "Freq & Phase" or "Freq & GrpDel" is set, display of the frequency measurement result in the first row and display of the phase or group delay measurement in the second row.
-
Page 162: Combo Display
® Manual Operation R&S Measurement Displays A measured value for a linear unit is displayed with 3 to 7 digits; a measured value for logarithmic units can be displayed with a resolution of 0.1 dB up to 0.00001 dB. If the measured value underruns or overruns the preset limits, it appears red on black. As soon as the measured value is back within the limits, it changes to green again. - Page 163 ® Manual Operation R&S Measurement Displays Function PC keyboard Mouse Activating a Combo Display via a Select the numeric measurement Double-click desired measure- Numeric Display Field display with CTRL+TAB or CTRL ment display in numeric display +SHIFT+TAB. Highlight desired field. measurement display in numeric display field with TAB or SHIFT +TAB and open combo display...
- Page 164 ® Manual Operation R&S Measurement Displays For the analog analyzer instrument, the Config panels are offered as a single column since the settings apply uniformly to all channels. For the other analyzer instruments, the Config panels are offered in two columns since each channel can be configured by itself.
- Page 165 ® Manual Operation R&S Measurement Displays The reference value for relative measured values can be set here. This can be a fixed preset value; however, values measured at a different location or values based on the generator settings and so on can also be adopted automati- cally as reference values.
- Page 166 ® Manual Operation R&S Measurement Displays As soon as one of the limits is exceeded, the measurement display and measure- ment bar changes from green to red. If the measured value is within the limits, the measurement display and measurement bar are displayed in green. In order to monitor limit violations over a long period of time without having to watch the measurement displays continuously, the lower and/or upper limit is dis- played permanently in red as soon as it is exceeded.
-
Page 167: Graphical Window
® Manual Operation R&S Measurement Displays ● Number of displayed digits The "Resolution" field is used to set the number of digits used when displaying the measured values, Min/Max values and limits. Values in linear units can be displayed with 3 to 7 digits; values in logarithmic units can be displayed with a resolution of 0.1 dB to 0.00001 dB. - Page 168 ® Manual Operation R&S Measurement Displays can be recorded along an x-axis. Each trace can consist of a large number of scans. The traces can be saved and saved traces, reference curves and/or limit curves can be imported into the graph. Up to four "sweep graphs"...
- Page 169 ® Manual Operation R&S Measurement Displays 4.8.4.3 Waveform The waveform display is a type of oscillogram in which the signal characteristic of the analyzed audio signal over time is displayed. One or two traces (TRACE A and TRACE B) can be recorded along a time axis. The traces can be saved and saved traces, ref- erence curves and/or limit curves can be imported into the graph.
- Page 170 ® Manual Operation R&S Measurement Displays 4.8.4.4 Bar Graph If one of the functions "THD", "Mod Dist" or "DFD" is selected in the "Analyzer Func- tion" panel, the function measurement result can be displayed broken down into its fre- quency components on a bar graph. The individual distortion products are recorded along a frequency axis.
- Page 171 ® Manual Operation R&S Measurement Displays Alternatively, the graphical windows can also be opened using the associated configu- ration panels (see the following section). The associated graphical window is activated using the "Show" button. In the "Analyzer Function" panel, it is also possible to use the "Show" button to open some graphical or data windows.
- Page 172 ® Manual Operation R&S Measurement Displays Function PC keyboard Mouse Open panel for configuring a Press shortcut CTRL + M, then Open the menu bar by moving to graphical window highlight the Disp Config button the left edge of the screen, acti- using the TAB or SHIFT + TAB vate the Disp Config button and keys, open the pulldown menu...
- Page 173 ® Manual Operation R&S Measurement Displays In all graphical windows, two traces (TRACE A and TRACE B) can be recorded on y- axes along an x-axis. The "Y-Source" parameter field is used to determine which mea- surement functions are mapped to the y-axes. For multi-channel analyzer instruments, the input channel to be mapped can be selected using the "Channel"...
- Page 174 ® Manual Operation R&S Measurement Displays Units of Measured Values This parameter field is used to set the unit for the trace. The units available in the parameter list depend in the type of measurement. Alternatively, if the checkbox is selected, the unit used in the analyzer will be used. An overview with all the units that occur for the audio analyzer and their conversion for- mulas is located in Chapter 4.17,...
- Page 175 ® Manual Operation R&S Measurement Displays Main gridlines which are labeled with the associated numeric values can be added with different intervals. Subgridlines are used for further subdivisions; these lines are not labeled. Limits A lower and/or upper limit can be defined for each measurement result. If the limit is activated, each measured value is compared with the limit.
- Page 176 ® Manual Operation R&S Measurement Displays 4 = Trace 5 = Min value trace 6 = Limit display Extreme values If this checkbox is activated, a Min and Max characteristic is displayed that indicates the lowest and highest measurement results of a measuring sequence. Two additional gray lines which represent the measured extreme values (see the example above) then appear in the graph.
- Page 177 ® Manual Operation R&S Measurement Displays 4.8.4.7 Evaluating Graphical Displays with Cursors and Markers All graphical displays can be evaluated using horizontal and vertical cursors; the X and Y-values shown in the display fields associated with the cursors are always current val- ues.
- Page 178 ® Manual Operation R&S Measurement Displays The softkeys are arranged in several levels; the lower levels are accessed by activat- ing the respective button. Activating the "Back" button redisplays the higher level. At the lowest respective level, the buttons directly trigger the desired function. Showing and hiding traces –...
- Page 179 ® Manual Operation R&S Measurement Displays If, for example, the cursor was activated with the "O-Cursor" button, the following soft- keys appear: For the "O Active" button, a softkey with an additional checkbox is used. The softkey indicates that the O-cursor is active and that further settings for this cursor are availa- ble under the adjacent softkeys.
- Page 180 ® Manual Operation R&S Measurement Displays Sweep graph ● "Next Pixel " Selecting the "Next Pixel" button moves the cursor by one pixel in the graphic with every increment. If there is not a measured value at every pixel in the graphical dis- play (because only a few measurement points were recorded relative to the size of the displayed graph), the cursor value is interpolated linearly at the pixels between the measured values.
- Page 181 ® Manual Operation R&S Measurement Displays Waveform ● "Next Pixel " Selecting the "Next Pixel" button moves the cursor by one pixel in the graphic with every increment. If there is not a measured value at every pixel in the graphical display (because only a few measurement points were recorded relative to the size of the displayed graph), the cursor value is interpolated linearly at the pixels between the measured values.
- Page 182 ® Manual Operation R&S Measurement Displays In order to analyze individual scans with cursors, the cursor is switched to the desired scan in the following way: ● External PC keyboard: with the keys ALT + PAGE UP and ALT + PAGE DOWN ●...
- Page 183 ® Manual Operation R&S Measurement Displays ● "Act Curs In " The "Act Curs In" button zooms in on the section of graph on either side of the active X-cursor. ● "Act Curs Out " The "Act Curs Out" button zooms out from the section of graph on either side of the active X-cursor.
- Page 184 ® Manual Operation R&S Measurement Displays 4.8.4.8 Measured value Display in Lists The measured values can also be displayed in lists instead of or in combination with the graphical windows. Measured values which have violated the preset limits are displayed in red. In addition, a red arrow pointing up/down in the bottom right-hand corner of the graph provides a permanent indication of limit overranging/underranging.
- Page 185 ® Manual Operation R&S Measurement Displays Data list settings Function PC keyboard Mouse Open panel for configuring a data Press shortcut CTRL + M, then Open the menu bar by moving to list highlight the Disp Config button the left edge of the screen, acti- using the TAB or SHIFT + TAB vate the Disp Config button and keys, open the pulldown menu...
-
Page 186: Settings In The Menu Bar
® Manual Operation R&S Settings in the Menu Bar ● only peaks Cursor in lists with several individual scans If a trace consists of several scans, only the values of one scan can be displayed in the list at any one time. The scan number displayed in the bottom left-hand corner of the data list in the respective display field indicates which scan is entered in the list. - Page 187 ® Manual Operation R&S Settings in the Menu Bar cations; these setups are divided into various application areas (AA, AD, DD, DA) depending on whether the generator or analyzer is operated with analog or digital interfaces. ● Save Setup As To save instrument settings under a new name or to overwrite an existing setup (corresponds to [ALT+S] on the external keyboard).
- Page 188 ® Manual Operation R&S Settings in the Menu Bar Instruments To select the panels for configuring the generators, analyzers, filters and supplemen- tary functions. ● The desired panel must first be highlighted and is then displayed on the currently selected screen (see Chapter 4.5.1, "Opening, Operating, Hiding and Closing Pan- els", on page 126)
- Page 189 ® Manual Operation R&S Settings in the Menu Bar Displays ● To select the measurement display windows. ● The desired measurement window must first be highlighted and is then displayed on the currently selected screen (see Chapter 4.5.1, "Opening, Operating, Hiding and Closing Panels", on page 126)
- Page 190 ® Manual Operation R&S Settings in the Menu Bar Utilities ● Diagnostic Panel Opens a panel for entering service settings ● Config panel Opens a panel for entering instrument-wide settings, e.g. IEC bus address, the appearance of the file select box or whether the menu bar or toolbar is perma- nently displayed on the monitor.
- Page 191 ® Manual Operation R&S Settings in the Menu Bar In the text fields, you can enter comments to describe the individual setup/macro; these comments are then displayed when the mouse is moved over the button. If there is an asterisk to the left of the comment, this means that the checkbox on the left side is active and that the setup/macro is executed using the above-mentioned keys.
-
Page 192: Settings On The Toolbar
® Manual Operation R&S Settings on the Toolbar Help ● Contents Calls up the help system of the audio analyzer, see Chapter 4.14, "Help System", on page 179. ● Index Call up of the help system of the audio analyzer with an alphabetically sorted listing of all terms used in the help system. -
Page 193: Settings In The Operating System
® Manual Operation R&S Auxiliaries Panel Symbols for conveniently loading predefined instrument settings or starting macros using the mouse. For the settings for this purpose, see Chapter 4.9, "Settings in the Menu Bar", on page 170. Starts the "R&S UPX Sequencing" software. This is a program that the allows the user to run test sequences. -
Page 194: Trigger Output
® Manual Operation R&S Rapid Deactivation of Outputs The required settings are made in the Auxiliaries panel; the settings described here are intended as examples. An in-depth description of the detailed options can be found in Chapter 5, "Instrument Functions", on page 195. -
Page 195: Help System
® Manual Operation R&S Help System Remote-control command: on page 720 OUTPut 4.14 Help System The R&S UPP has a context-sensitive help system. The help system provides a help page for every parameter and can be called up at any time while the instrument is being operated. -
Page 196: File Management
® Manual Operation R&S File Management 4.15 File Management The R&S UPP uses files to store all instrument data, i.e. system and user data. User data includes stored instrument settings, data for equalizer files, lists for sweeps, and so on. The files are stored on the instrument's hard disk. -
Page 197: List Of File Extensions Used
® Manual Operation R&S File Management 4.15.2 List of File Extensions Used File type File Meaning exten- sion Instrument settings .SET Setup file for saving and loading the instrument parameters set by the user ("complete" setup) .SAC Setup file for saving and loading the instrument parameters set by the user ("current"... -
Page 198: Manual Remote Operation
® Manual Operation R&S Manual Remote Operation 4.16 Manual Remote Operation The R&S UPP permits manual remote operation using an external computer. As a result, the audio analyzer can be operated conveniently from the user's desk even if, for example, the audio analyzer is installed in a rack in a different room. Unlike remote operation where remote-control commands are used, the manual remote operation requires separate Windows software which is installed on the exter- nal computer. -
Page 199: Units
® Manual Operation R&S Units To return to direct operation at the R&S UPP, it is necessary to log off the external user and log on the local user. The external user can be logged off at the external computer in the "Start" menu of the R&S UPP window by clicking on "Disconnect"... - Page 200 ® Manual Operation R&S Units 4.17.1.2 Units for digital level measurement results Basic unit: FS (Full Scale) *) Level measurement result in hex notation All digital analyzer measurement functions usually deliver values ranging from 0 to 1 FS values >1 may occur in the following cases: ●...
- Page 201 ® Manual Operation R&S Units 4.17.1.4 Unit for S/N measurement results 4.17.1.5 Units for frequency measurement results Basic unit: Hz 4.17.1.6 Units for phase measurement results Basic unit: ° (degrees) 4.17.1.7 Units for group delay measurement results Basic unit: s User Manual 1411.1055.32 ─...
-
Page 202: Units For Value Entries
® Manual Operation R&S Units 4.17.2 Units for Value Entries To simplify matters: In the following conversion formulas, the entry values are designa- ted by the unit only. Example: "dBu" means: value in "dBu". Absolute analog level units (without reference) Relative analog level units (with reference) Absolute digital level units (without reference) User Manual 1411.1055.32 ─... - Page 203 ® Manual Operation R&S Units Relative digital level units (with reference) Absolute time units Absolute frequency units Relative frequency units (with reference) Absolute phase units Deviations (tolerance) relative to previous measured values in settling function User Manual 1411.1055.32 ─ 10...
-
Page 204: Overview Of Keys
® Manual Operation R&S Overview of Keys Step size of a logarithmic level sweep Absolute resistance unit 4.18 Overview of Keys The following table provides an overview of the shortcuts of the PC keyboard and the mouse operation and its function. Table 4-1: Softkeys Key of the PC keyboard Function... - Page 205 ® Manual Operation R&S Overview of Keys Table 4-3: Navigation keys Key of the PC keyboard Function Operation with mouse CTRL+PAGE UP / Switches to the previous / next display setting (screen) CTRL + PAGE DOWN CTRL+SHIFT+TAB (left) / Switches the focus to the previous / next panel open in the visible screen (the panel with the focus is active) CTRL+TAB (right) ALT+PAGE UP /...
-
Page 206: Overview Of Panels And Measurement Displays (Graphical Windows)
® Manual Operation R&S Overview of Panels and Measurement Displays (Graphical Windows) Key of the PC keyboard Function Operation with mouse UP/DOWN cursor keys Move the focus in the panels, selection windows and tables Change the entry value at the cursor position LEFT/RIGHT cursor keys Moves the active cursor inside the graphical windows Move the cursor position in entered values... - Page 207 ® Manual Operation R&S Overview of Panels and Measurement Displays (Graphical Windows) ● Analyzer Function Selection of measurement functions ● Measurement speed and accuracy ● Activation of filter and equalizer ● Activation of Post FFT ● Selection and settings for level monitor ●...
- Page 208 ® Manual Operation R&S Overview of Panels and Measurement Displays (Graphical Windows) ● Waveform Config Setting of all details for graphical display of waveform analyzer, e.g. number of curves, units, scaling, gridlines, etc. ● Entry of limit curves ● Settings for cursors and markers ●...
-
Page 209: Overview Of Status Messages
® Manual Operation R&S Overview of Status Messages ● Sweep Graph 1 to 4 Up to four of these display windows can be open simultaneously to display scans from sweep measurements ● One-channel or two-channel graphical display ● The measurement results are displayed in the way defined in the respective "Sweep Graph 1 to 4 Config"... - Page 210 ® Manual Operation R&S Overview of Status Messages Number in red Measuring range has been overranged; this can occur if: ● Range Fix setting is being used ● A signal with a level at range limit is applied with a crest factor > 2 ●...
-
Page 211: Instrument Functions
® Instrument Functions R&S Selecting the Generator 5 Instrument Functions 5.1 Selecting the Generator 5.1.1 Generator Configuration Panel The Configuration panel allows settings for the analog and digital generators. To adapt the R&S UPP generator to the measurement task at hand, first define the settings in the Generator Config panel. -
Page 212: Configuring Analog Generator
® Instrument Functions R&S Configuring Analog Generator 5.2 Configuring Analog Generator 5.2.1 Analog Generator Config Panel Figure 5-1: Analog generator configuration panel The "Analog" generator instrument does not require any options for 2‑channel genera- tion and requires the R&S UPP‑B8 option (multichannel audio generator) for eight‑channel generation. - Page 213 ® Instrument Functions R&S Configuring Analog Generator "Multi" Opens a free selection option of up to 8 generator channels, if the R&S UPP‑B8 option (multichannel audio generator) is installed. With the "Universal" generator function, the signals can be set individually for each channel.
- Page 214 ® Instrument Functions R&S Configuring Analog Generator Impedance From serial numbers 120100, 140100, 180100 and higher, an output impedance of either 25 Ω or 600 Ω can be set in this field (previously, the impedance was perma- nently set at 25 Ω). If the eight-channel generator is used, the output impedance of the generator outputs is set permanently to 25 Ω.
- Page 215 ® Instrument Functions R&S Configuring Analog Generator "Fix" The analog hardware is permanently set to the specified maximum voltage. The actual output voltage is obtained by controlling the level of the D/A converter; the analog hardware settings remain unchanged. Advantage: Faster level changes and better settling characteristics.
-
Page 216: Outputs Of The Universal Generator
® Instrument Functions R&S Configuring Analog Generator The relative frequency of the generator signal remains unchanged. By varying the ref- erence frequency, the fundamental of a distortion spectrum set using a multi-sinewave, for example, can thus be shifted without the harmonics having to be calculated and set again by the user. - Page 217 ® Instrument Functions R&S Configuring Analog Generator Unbalanced Output (Output Type "Unbal") Figure 5-2: Unbalanced Output As can be seen in the circuit diagram, the two generator outputs are supplied by two independent sources. The selected output impedance is retained even if the output is deactivated; XLR Pin 3 is set to 0 V, electronically floating.
- Page 218 ® Instrument Functions R&S Configuring Analog Generator In the schematic circuit diagrams, the ground symbol represents the R&S UPP housing ground. Figure 5-3: Balanced Output As can be seen in the circuit diagram, the two generator outputs are supplied by two independent sources.
-
Page 219: Output Power Of The Universal Generator
® Instrument Functions R&S Configuring Analog Generator 5.2.3 Output power of the universal generator The output amplifier, attenuator and all internal resistors are short-circuit-proof. The peak value of the current is limited to approx. 250 mA. For a maximum RMS value of 14 V (balanced mode) and 7 V (unbalanced mode), the maximum power dissipation in the load resistor (with a short circuit in the internal resistor) is 2.5 W or 1.25 W. -
Page 220: Output Power Of The Analog Multichannel Generator
® Instrument Functions R&S Configuring Analog Generator Figure 5-4: Unbalanced Output The selected output impedance is retained even if the output is deactivated. "Cold" is set to approx. 0 V, electronically floating. Accordingly, if a breakout cable is connected (R&S UP‑Z8A option, see data sheet for order number), Pin 3 of all 8 XLR connectors is also electronically floating. -
Page 221: Configuring The Digital Generator
® Instrument Functions R&S Configuring the Digital Generator 5.3 Configuring the Digital Generator 5.3.1 Digital Generator Configuration Panel The "Digital Audio" generator instrument requires the options ● R&S UPP-B2 (digital audio interfaces) for 2-channel generation or ● R&S UPP-B4 (HDMI and digital audio interfaces) for 2-channel generation or ●... - Page 222 ® Instrument Functions R&S Configuring the Digital Generator "Multi" This option is offered only if the ● option R&S UPP-B4 (HDMI and digital audio interfaces) for the 8- channel "Digital Audio" generation is installed. ● option R&S UPP-B8 (multichannel audio generator) is installed. "Multi"...
- Page 223 ® Instrument Functions R&S Configuring the Digital Generator "Ext DARS" Synchronizes to a digital audio signal. If the R&S UPP-B2 option (digital audio interfaces) is installed for the digital audio interfaces, the synchronization to a digital audio signal is done either at the asymmetrical "Sync In" BNC jack or on the 9-pin "DIGITAL BAL"...
- Page 224 ® Instrument Functions R&S Configuring the Digital Generator Remote command: on page 692 SOURce:SYNC:TERMination Audio Bits If the word width is decreased, the values of the audio samples are rounded to the specified word width. Unused data bits are encoded as zeroes in the digital audio sig- nal.
- Page 225 ® Instrument Functions R&S Configuring the Digital Generator Sink ARC With the installed R&S UPP-B4 option (HDMI and digital audio interfaces), the audio return channel of the HDMI analyzer can be supplied either via direct looping of the audio signal present at the Sink socket or optionally through the SPDIF output of the digital audio generator.
-
Page 226: Interface Assignment
® Instrument Functions R&S Configuring the Digital Generator Setting range: 0 V to 2,125 V This voltage is linked to the setting for the BAL amplitude and is always a quarter of this amplitude. Remote command: on page 691 OUTPut:SIGNal:LEVel Ref Voltage Reference value for the relative amplitude units. - Page 227 ® Instrument Functions R&S Configuring the Digital Generator DIGITAL BAL plug (9-pin D-Sub connector) Connection Signal Input (I) Description Output (O) Transmitter output Bal+ Ground terminal SYNC IN- Synchronization input Bal- Receiver input Bal+ Ground terminal Transmitter output Bal- SYNC IN+ Synchronization input Bal+ Receiver input Bal- 5.3.2.2...
-
Page 228: Configuring The I S Generator
® Instrument Functions R&S Configuring the I S Generator As an accessory for the optional R&S UPP-B8 (multichannel audio generator), a break- out cable with a 9-pin D-Sub connector on the one side and five BNC connectors on the other side is available (optional R&S UP-Z8D, refer to data sheet for Order No.) 5.4 Configuring the I S Generator 5.4.1 I... - Page 229 ® Instrument Functions R&S Configuring the I S Generator A difference in the Config panel due to the installation of the R&S UPP-B2 (digital audio interfaces) or R&S UPP-B4 (HDMI and digital audio interfaces) options applies only to the "Channel" command with the "Multi" option, which is offered only for 8-chan- nel "I S"...
- Page 230 ® Instrument Functions R&S Configuring the I S Generator "Intern" The generator uses the instrument's internal clock signal. The sampling rate of the generator is based on the configured value. "Ext Mclk" Synchronization to the external master clock fed in at the [SYNC IN] BNC jack on the front of the R&S UPP-B2 (digital audio interfaces) or B4 (HDMI and digital audio interfaces) option.
- Page 231 ® Instrument Functions R&S Configuring the I S Generator The sampling frequency corresponds to the frequency of the FSYNC signal. All fre- quency information of generated audio data relates to this setting. If the I S generator is operated with external wordclock synchronization and the frequency of the external clock signal does not correspond to the set sampling frequency, the I S generator gen- erates audio data with an incorrect frequency.
- Page 232 ® Instrument Functions R&S Configuring the I S Generator Remote command: on page 692 OUTPut:BCLK:FREQuency? MClk Ratio Ratio between MCLK and FSYNC. Value range: 64, 96, 128, 192, 256, 384, 512 The value range of the MClk ratio (and thus the selection available in the combo box) varies based on "Word Length"...
- Page 233 ® Instrument Functions R&S Configuring the I S Generator Fsync Shape Selection of the FSYNC signal form. "Square Pulse" The FSYNC signal is transmitted as a symmetrical rectangle. "Bit Pulse" The FSYNC signal is transmitted as a bit pulse. Remote command: on page 693 OUTPut:FSHape Fsync Polarity...
-
Page 234: Timing Diagrams
® Instrument Functions R&S Configuring the I S Generator Ref Frequency Reference value for the relative frequency units. If case of a change, all frequency settings linked to the reference frequency also change. Remote command: on page 689 SOURce:FREQuency:REFerence 5.4.2 Timing Diagrams The timing diagrams below show a number of configuration examples that illustrate the effect of the parameters. -
Page 235: Interface Assignment
® Instrument Functions R&S Configuring the I S Generator 5.4.3 Interface Assignment S plug (25-pin D-Sub connector) of the R&S UPP-B2 (digital audio interfaces) option. Connection Signal (I)nput Description (O)utput Ground terminal Ground terminal Ground terminal Ground terminal Ground terminal Ground terminal Ground terminal Ground terminal... - Page 236 ® Instrument Functions R&S Configuring the I S Generator Connection Signal (I)nput Description (O)utput Ground terminal Ground terminal Ground terminal Ground terminal Ground terminal not connected RX_SCK Serial Clock Analyzer RX_FSYNC Frame Sync Analyzer RX_DATA Serial Data Analyzer not connected +3.3 V (500 mA) Power Supply +5 V (500 mA)
- Page 237 ® Instrument Functions R&S Configuring the I S Generator Connection Signal (I)nput Description (O)utput Ground terminal TX FSYNC Frame Sync Generator TX DATA Ch 1,2 Serial Data Generator Ch1,2 TX DATA Ch 3,4 Serial Data Generator Ch3,4 TX DATA Ch 5,6 Serial Data Generator Ch5,6 TX DATA Ch 7,8 Serial Data Generator Ch7,8...
-
Page 238: Configure Hdmi Generator
® Instrument Functions R&S Configure HDMI Generator face) option. The desired clock is selected in the parameter field "Sync To " with "Extern Masterclk " or "Ext Wordclk ". 5.5 Configure HDMI Generator 5.5.1 HDMI Generator Configuration Panel The "HDMI" generator instrument requires the R&S UPP-B4 (HDMI and digital audio interfaces) options. - Page 239 ® Instrument Functions R&S Configure HDMI Generator Source Selection of the video source. In the HDMI generator, the video data and test patterns can be generated either internally or supplied via the AUX IN socket, combined with the audio signals and output at the SOURCE socket. In this mode, all info frames are also copied to the SOURCE socket, with the exception of the internally generated audio info frames.
- Page 240 ® Instrument Functions R&S Configure HDMI Generator Depending on the selected resolution in the parameter field above, one or several ver- tical frequencies can be selected. The resulting video identification code according to CEA-861 is shown in the "Format No" field. Remote command: on page 696 SOURce:HDMI:VIDeo:FREQuency...
- Page 241 ® Instrument Functions R&S Configure HDMI Generator "Pattern" Available only with the R&S UPP-K45 (expanded audio/video mea- surements) option. Generation of test patterns. Remote command: on page 695 SOURce:HDMI:VIDeo:CONTent Pattern Config Editor for generating test patterns. Color Depth Selection of color depth of the picture data in bit. Remote command: on page 695 SOURce:HDMI:VIDeo:COLor:DEPTh...
- Page 242 ® Instrument Functions R&S Configure HDMI Generator Opens a dialog in which the currently set SPD Info Frame of the generator is shown. The data structure of this Info Frame is specified in the CEA-861 standard. E-EDID Opens a dialog displaying the data structure of one of the HDMI loads connected to the SOURCE socket.
- Page 243 ® Instrument Functions R&S Configure HDMI Generator "PCM 8Ch Lay 8-channel PCM data. In addition to the 2-channel settings, the "Chan- 1" nel" parameter field underneath it also offers the "Multi" option which enables the open configuration of up to 8 channels. "Dolby Digital"...
- Page 244 ® Instrument Functions R&S Configure HDMI Generator All audio clocks are generated internally. The selection of the sam- "Intern" pling rate is not affected by external signals. "Aux In" The audio master clock is determined by the audio signal supplied at the [AUX IN] socket, regardless of whether the sampling rate is sup- ported by the video format selected in the HDMI generator or not.
- Page 245 ® Instrument Functions R&S Configure HDMI Generator Sample Freq Value Variable entry of a sampling frequency in Hz or kHz, if "Value" was selected in the input field above. Entry values from -4% to +4% of the allowed standard sampling frequencies are per- missible and are copied without changes.
-
Page 246: Signal Flow Between R&S Upp And Dut
® Instrument Functions R&S Configure HDMI Generator 5.5.2 Signal Flow between R&S UPP and DUT 5.5.3 Interface Assignment of HDMI All HDMI sockets follow the standard assignment for HDMI 1.4. Signal Signal TMDS Data2+ TMDS Clock Shield TMDS Data2 TMDS Clock– Shield TMDS Data2–... -
Page 247: Heac Support
® Instrument Functions R&S Configure HDMI Generator Signal 5.5.5 HEAC Support The HDMI generator supports the Audio Return Channel (ARC) as well as the HDMI Ethernet Channel (HEC). The following block diagram illustrates the internal wiring: User Manual 1411.1055.32 ─ 10... -
Page 248: Generator Signals
® Instrument Functions R&S Generator Signals For the analysis of the Audio Return Channel fed into the generator socket at the rear side, the "Input" audio can be set to "Source ARC" in the Analyzer Config Panel. To test the Ethernet functionality of a device under test, the HEC (Source) RJ-45 socket can be used. -
Page 249: Sine
® Instrument Functions R&S Generator Signals The panels for the analog and digital generator are almost identical; the settings are therefore described together. Any differences are indicated. With an activated multichannel generator (requires optionR&S UPP‑B8, multichannel audio generator), individual signals can be configured for all selected channels using the "Universal"... - Page 250 ® Instrument Functions R&S Generator Signals Sweep points: Linear or logarithmic between Start and Stop or read out of the file. Forwarding: Automatic in a defined timeframe or synchronized to the measurement time of the analyzer. All setting parameters of the sweep system are described in detail Chapter 5.9, "Sweeps", on page 285.
-
Page 251: Stereo Sine
® Instrument Functions R&S Generator Signals The generator signal is equalized in the frequency domain using the file selected in the "Equal File" parameter field, see Chapter 5.7, "Equalization", on page 279. DC Offset A DC offset is superimposed on the generator signal. The DC offset decreases the maximum AC voltage. - Page 252 ® Instrument Functions R&S Generator Signals "Ch1&2" The frequency can be entered separately for Channel 1 and 2. There is no fixed phase relationship between the channels. With the frequency sweep, the frequency of Channel 1 is swept but Channel 2 remains unchanged. Note: If Gen Track is selected as the measurement time in the ana- lyzer, measurement channel 1 follows the frequency of generator channel 1 and measurement channel 2 follows the frequency of gen-...
- Page 253 ® Instrument Functions R&S Generator Signals Freq Ch1 Frequency of Channel 1 (Freq Mode Ch1&2). Note: If Gen Track is selected as the measurement time in the analyzer, measurement channel 1 follows the frequency of generator channel 1. If necessary, the generator fre- quency is modified slightly so that the signal periods measured during the measure- ment time contain a sufficient number of samples.
- Page 254 ® Instrument Functions R&S Generator Signals Filter The filter can be selected for both channels together (Track) or separately from each other (Split). Remote command: on page 701 SOURce:FILTer:CHANnels Filter / Filter Ch1 Common filter for channel 1 and channel 2, if "Track" filter was selected. Filter for channel 1, if "Split"...
- Page 255 ® Instrument Functions R&S Generator Signals button opens a browser in which you can select the equalizer file, refer also to Chapter 5.7, "Equalization", on page 279. Remote command: on page 699 SOURce:VOLTage:EQUalize on page 697 MMEMory:LOAD:OEQualize Equalizer Ch2 Equalizer for channel 2, if "Split" equalizer was selected. The generator signal is equalized in the frequency domain using the file selected in the ""Equal File CH2""...
-
Page 256: Multisine
® Instrument Functions R&S Generator Signals 5.6.3 Multisine The generator generates a multitone signal with up to 32 sine‑wave tones. The fre- quency, level and phase can be selected for each tone. However, it is also possible to optimize the phase so that the ratio of peak value to RMS value is minimal. Optimiza- tion is often required in the case of noise-like signals. - Page 257 ® Instrument Functions R&S Generator Signals No of Sine Used to set the number of sine-wave tones of the multisine‑wave signal. Remote command: on page 704 SOURce:MULTisine:COUNt Freq No i Sets the frequency of the sine wave number i of the multisine‑wave signal. Based on the internal programming, several sine waves of the same frequency cannot have different phase references.
-
Page 258: Sine Burst
® Instrument Functions R&S Generator Signals Filter The generator signal is filtered in the time domain. One of the user‑definable filters in the Filter panel or a weighting filter can be selected. All level settings apply to the unfil- tered signal. Remote command: on page 776 SOURce:FILTer... - Page 259 ® Instrument Functions R&S Generator Signals When generator settings have been changed or a measurement has been started, the burst starts with the positive sinusoidal half-wave of the burst duration ("On Time"). The "Burst On Delay" parameter is used to set a defined delay time. Function Selects the sine burst signal.
-
Page 260: Mod Dist
® Instrument Functions R&S Generator Signals Burst on Delay Used to set the delay time which must expire before the generator can start the burst with the high level ("Voltage"). During this time, the signal is output with the zero level. The delay time takes effect after generator settings have been changed or a measure- ment has been started. - Page 261 ® Instrument Functions R&S Generator Signals The signal consists of 2 sine waves: a low-frequency unwanted signal and a high-fre- quency wanted signal. The level of the unwanted signal is 1 to 10 times as high as the level of the wanted signal. According to IEC 268‑3, the frequency of the unwanted signal is between 0.5 and 1.5 octaves above the lower cutoff frequency of the DUT (60 Hz according to SMPTE).
- Page 262 ® Instrument Functions R&S Generator Signals Sweep points: Linear or logarithmic between Start and Stop or read out of the file. Forwarding: Automatic in a defined timeframe or synchronized to the measurement time of the analyzer. All setting parameters of the sweep system are described in detail Chapter 5.9, "Sweeps", on page 285.
-
Page 263: Dfd
® Instrument Functions R&S Generator Signals A DC offset is superimposed on the generator signal. The DC offset decreases the maximum AC voltage. The checkbox enables or disables this function. The value con- figured for the offset voltage is always displayed. Remote command: on page 700 SOURce:VOLTage:OFFSet<n3>:STATe... - Page 264 ® Instrument Functions R&S Generator Signals Dither In the digital generator, a noise component with adjustable amplitude can be superim- posed on the signal. The checkbox enables or disables this function. The parameter fields for Dither do not appear in the analog generator. Remote command: on page 698 SOURce:SINusoid:DITHer:STATe...
-
Page 265: Random
® Instrument Functions R&S Generator Signals Filter The generator signal is filtered in the time domain. One of the user‑definable filters in the Filter panel or a weighting filter can be selected. All level settings apply to the unfil- tered signal. Remote command: on page 776 SOURce:FILTer... - Page 266 ® Instrument Functions R&S Generator Signals Several thousand equidistant sine-wave lines in a selectable frequency domain Special application: If the frequency grid of the sine-wave lines generated here is identical to the analysis grid of the FFT, analysis can be performed without leakage in the FFT. It is therefore possible to obtain a selectivity of one line with the square‑wave window.
- Page 267 ® Instrument Functions R&S Generator Signals "Pink" Time domain: WAV files for generating broadband pink noise that is free of perio- dicity, for the fixed frequencies between 11.025 kHz and 192 kHz (and thus for all configurable generator bandwidths) are available in the "User"...
- Page 268 ® Instrument Functions R&S Generator Signals Example: rs_exam.ftf in the directory D:\UPV\User In addition to this file format, an equalization file (example: rs_exam.veq in the direc- tory D:\UPV\User) can be loaded as a shape file. The amplitudes of individual fre- quency lines are set regarding to the equalization frequency response.
- Page 269 ® Instrument Functions R&S Generator Signals "Anl Trk" The frequency grid is adopted from the FFT set in the analyzer. This value depends on the sampling rate and the size of the FFT. This set- ting is only possible if an FFT or Post FFT is selected in the analyzer. The parameter field where a value would be entered for this setting is grayed out and the value is displayed.
- Page 270 ® Instrument Functions R&S Generator Signals Volt RMS Used to enter the RMS value of the noise signal (only in the analog generator). The peak value to RMS value ratio of the signal (crest factor) is minimized. If the noise is defined in the time domain, the selected distribution function for amplitude determines the crest factor.
-
Page 271: Arbitrary
® Instrument Functions R&S Generator Signals 5.6.8 Arbitrary The generator generates a freely definable curve shape which is read out from a file as a sequence of samples. The maximum length is 262144 (256 k) samples. When out- put, the curve is repeated continuously in an unbroken sequence. If a measurement is restarted (Start button), the curve starts again from the beginning of the file. -
Page 272: Play
® Instrument Functions R&S Generator Signals Volt Peak Used to enter the peak value of the arbitrary signal. The maximum value depends on the configured DC offset. In the analog generator, the maximum total voltage also depends on the settings "Output Type "... - Page 273 ® Instrument Functions R&S Generator Signals ● Playing back specific speech and music signals for special measurements in mobile radio or for gearing aids, ● Playing back specific test sequences, such as for external sweeps. ● Data source for coded audio signals that are intended to be decoded by a connec- ted DUT.
- Page 274 ® Instrument Functions R&S Generator Signals Since the file is read online during playback, only data media having a high transfer rate are suitable. Suitable data media includes the data partition of the hard drive or a network drive with at least 100 Mbit/s. USB flash drives and drives can be used only for files of less than 0.5 Msamples.
- Page 275 ® Instrument Functions R&S Generator Signals This selection is not available for mono WAV files; they are always output on both gen- erator channels. Note: Whether a signal is actually output at both generator channels depends, as for all generator signals, on the menu item of the same name in the Generator Config panel.
- Page 276 ® Instrument Functions R&S Generator Signals "Off" The signal is muted immediately. If the level changes, the playback of the play file is not interrupted. Level changes include the settings "Volt Peak Ch1", "Volt Peak Ch2", "Volt Ch2/1", "Filter" and "DC Offset". For all other generator settings that change the physical properties of the signal, the signal is muted.
- Page 277 ® Instrument Functions R&S Generator Signals Depending on the selected Play Mode, the playback duration can be ● displayed ("Play Mode Total …") if the intention is to play back the WAV file in full; ● entered ("Play Mode Time …") to reset or prematurely interrupt playback. Note: If the sampling rate is increased afterwards, the playback duration may be reduced.
- Page 278 ® Instrument Functions R&S Generator Signals This parameter field does not appear if coded audio formats are played back; see note "Audio Format" on page 226. Remote command: on page 702 SOURce:VOLTage:RATio Filter The filter can be selected for both channels together (Track) or separately from each other (Split).
-
Page 279: Polarity
® Instrument Functions R&S Generator Signals DC Offset A DC offset is superimposed on the generator signal. The DC offset decreases the maximum AC voltage. The checkbox enables or disables this function. The value con- figured for the offset voltage is always displayed. This parameter field does not appear if coded audio formats are played back;... -
Page 280: Dc (Direct-Current Voltage)
® Instrument Functions R&S Generator Signals Remote command: on page 704 SOURce:VOLTage:TOTal 5.6.11 DC (Direct-Current Voltage) The generator generates a DC voltage signal. Unlike the DC offset, it is possible to sweep this DC voltage. Function Selects a DC voltage signal. Remote command: on page 697 DC SOURce:FUNCtion... -
Page 281: Chirp
® Instrument Functions R&S Generator Signals 5.6.12 Chirp The generator generates a logarithmic sine‑wave sweep, i.e. a signal whose the fre- quency changes regarding time with each sample. The use of this signal is a require- ment for the chirp‑based measurement (Chapter 5.29, "Chirp‑Based Measurement", on page 423). - Page 282 ® Instrument Functions R&S Generator Signals "Total Cont" The chirp is played back in a loop; after the "Interval" time expires, playback jumps back to the beginning of the signal without interrup- tion. Cannot be selected if the analyzer function is set to "Chirp Based Measurement".
- Page 283 ® Instrument Functions R&S Generator Signals Interval Time interval between the individual chirps. The "Interval" is 150 ms in the figure above. The pause between the chirps is therefore calculated as follows: "Interval" ‒ "Sweep Time". "Interval" does not influence "Volt RMS". Selectable only with Play Mode set to "Total Cont".
-
Page 284: Universal
® Instrument Functions R&S Generator Signals 5.6.13 Universal The "Universal" generator function is available ● in the 2‑channel "Analog" generator instrument, with installed 8‑channel R&S UPP‑B8 option (multichannel audio generator). ● with installed R&S UPP‑B2 option (digital audio interfaces) in the 2‑channel "Digi- tal Audio"... - Page 285 ® Instrument Functions R&S Generator Signals The overall signal for every individual channel in the case of ● digital generator is limited to 1 FS with "Limit to FS" or leveled to a maximum of 1 FS by entering an attenuation or gain. ●...
- Page 286 ® Instrument Functions R&S Generator Signals A noise component with adjustable amplitude can be superimposed on the overall signal. This setting reduced the maximum level of the other signal components that can be entered. The checkbox enables or disables this function. Remote command: on page 698 SOURce:SINusoid:DITHer:STATe...
- Page 287 ® Instrument Functions R&S Generator Signals "Time Manual" The combined playback time of all active arbitrary signal components (including delay) can be selected in the "Time" parameter field. Lon- ger arbitrary files are clipped; shorter files are attached in a loop. After this time expires, the arbitrary components are muted.
- Page 288 ® Instrument Functions R&S Generator Signals Forwarding: Automatic in a defined timeframe or synchronized to the measurement time of the analyzer. All setting parameters of the sweep system are described in detail Chapter 5.9, "Sweeps", on page 285. This parameter field appears only if the checkmark of "All Chan Sine" is set in the "All Channel Settings"...
- Page 289 ® Instrument Functions R&S Generator Signals Track to other channels "Deactivated:" The "Channel" parameter field underneath it can be edited, and the change of a parameter underneath it exclusively affects the channel identified by "Channel". "Activated:" At the time of switching from deactivated to activated, all parameters of the currently displayed channel are copied to all the other chan- nels.
- Page 290 ® Instrument Functions R&S Generator Signals Remote command: on page 714 SOURce:MCHannel<n2>:SINE:STATe Frequency Frequency of the channel-based sine-wave signal Remote command: on page 714 SOURce:MCHannel<n2>:SINE:FREQuency Phase For signals with the exact same frequency and activated higher-level sine-wave sig- nal, a two‑tone signal is generated in every channel at which the channel‑based sine wave has the specified phase regarding the higher‑level sine‑wave signal.
- Page 291 ® Instrument Functions R&S Generator Signals Remote command: on page 714 SOURce:MCHannel<n2>:SINE:OFFSet:STATe on page 714 SOURce:MCHannel<n2>:SINE:OFFSet:VOLTage Arbitrary A signal with random frequency and shape and the level specified in "Volt Peak" is added to the overall signal. The signal is determined by the "File" waveform file. The checkbox enables or disables this function.
- Page 292 ® Instrument Functions R&S Generator Signals Only available if "Arbitrary Mode" in the upper part of the panel is set to "Time manual". Whenever parameters of the "Universal" generator function are modified, time‑inten- sive signal processing processes which would significantly impede operation would have to be initiated in the firmware of the R&S UPP.
-
Page 293: Lip Sync
® Instrument Functions R&S Generator Signals Remote command: on page 713 SOURce:MCHannel<n2>:LIMittofs Total Gain This parameter field can be edited only if "Limit to FS" or "Limit to Max" is deactivated and permits the overall signal to be leveled. The upper limit is calculated so that the level of the overall signal cannot exceed 1 FS for digital generators or the maximum voltage for analog generators. - Page 294 ® Instrument Functions R&S Generator Signals Based on the fixed time relationship of audio and video data, the delay of the picture compared to the sound and vice versa can be measured within a DUT in the analyzer. Function Selects a sine burst signal of variable frequency, length, periodicity and amplitude. Remote command: on page 697 LIPSync SOURce:FUNCtion...
-
Page 295: Equalization
® Instrument Functions R&S Equalization RGB String Color to be output if no audio data are present. The color selection from the above color selection dialog above is mapped as RGB string and can be configured here, if necessary. In each case, the decimal equivalent of 12-bit long numeric values is mapped. -
Page 296: Protocol Generator
® Instrument Functions R&S Protocol Generator The table must be saved in a file in a particular format (see example RS_EXAM.VEQ in the d:/upv/user folder), which can be loaded in the "Equalization" parameter field in the Generator Function panel. The file can also be created from a measured curve or a curve imported from a file by storing the trace as Equalization List in the Display Config panel. - Page 297 ® Instrument Functions R&S Protocol Generator or in the Generator Config panel of the "Digital Audio" generator instrument with the button and in the Generator Config panel of the "HDMI" generator instrument with the button Coding Mode This is for setting the input dialog for channel status data to Consumer or Professional. "Automatic"...
- Page 298 ® Instrument Functions R&S Protocol Generator "Channel Sta- The channel status bytes are read from a text file, set in the hardware tus File" and back-translated into the corresponding entry masks. User entries are not possible. To change settings, the loaded file must be edited. Remote command: on page 716 SOURce:PROTocol:MODE...
-
Page 299: Setting Bytes As Numerical Values
® Instrument Functions R&S Protocol Generator 5.8.2 Setting Bytes as Numerical Values A byte can be set to any value in this entry block. It is even possible to set bit combina- tions that are not yet defined in the standard. Byte Number Selects the byte, 0 to 4. -
Page 300: Displaying And Setting Parameters In Plain Text
® Instrument Functions R&S Protocol Generator <n> → 0 to 255 (decimal) 5.8.4 Displaying and Setting Parameters in Plain Text Parameters can be entered here as defined in the standard. This is possible only for manual operation, not in remote-control mode. The bit combination and meaning are displayed. -
Page 301: Sweeps
® Instrument Functions R&S Sweeps . The hardware remains unchanged and the prior status is displayed. 5.9 Sweeps With many generator functions, it is advisable to output the signal parameters (level and frequency) not only statically but also to vary them over time. Varying one or more of the signal parameters is referred to as a (generator) sweep. -
Page 302: Activating / Deactivating The Sweep System
® Instrument Functions R&S Sweeps ● According to the sweep axis division into linear, logarithmic and list-controlled sweeps. ● According to the sweep direction into upward and downward sweeps. ● According to the physical basic unit of the Sweep parameter into Frequency, level and phase sweeps. - Page 303 ® Instrument Functions R&S Sweeps explained in greater detail there (see Chapter 5.21.3, "RMS Measurement, Selective", on page 363). The sweep system can be activated and configured separately in each generator func- tion. If the function (or instrument) is changed, the sweep system is reconfigured, acti- vated or deactivated implicitly.
-
Page 304: One-Dimensional Sweep
® Instrument Functions R&S Sweeps "Auto Sweep" The generator sweep system is activated; the sweep stepping is per- formed automatically; the sweep axis is calculated from the start value, stop value and step size or point number. The stepping condition (fixed time grid or synchronized to the ana- lyzer) is determined in the "Next Step"... -
Page 305: Two-Dimensional Sweep
® Instrument Functions R&S Sweeps "Voltage" Used to activate a level sweep. Which signal parameter is actually swept (e.g. the level of a single sine-wave line or the total level of a multi-tone signal) depends on the respective generator function. "Frequency"... -
Page 306: Automatic Sweep
® Instrument Functions R&S Sweeps Note: When switching on the Z-sweep, the Sweep Graph Config panel is switched over to Multi Scan, provided the "X-Source " of the respective window is set to Sweep. At the same time, the number of points on the z-axis (20 maximum) is copied to the Sweep Graph Config panel as "History"... - Page 307 ® Instrument Functions R&S Sweeps The automatic sweeps are selected in the "Sweep Ctrl" parameter field, whereby the sweep axis ● is calculated from user entries ("Auto Sweep") or ● is loaded with a predefined list (e.g. from a file) ("Auto List") Next Step Used to select the sweep stepping.
-
Page 308: Linear And Logarithmic Sweep
® Instrument Functions R&S Sweeps "Dwell File" The sweep stepping is time-controlled in individually set intervals, i.e. a new sweep point is set automatically if the associated time has expired, irrespective of whether the measurements activated in the analyzer have been completed. A new measurement is started at the same time. - Page 309 ® Instrument Functions R&S Sweeps ● the start and stop value ("Start" and "Stop"), which implies the sweep direction If no logarithmic spacing was selected, the DC generator function for "Start", "Stop" and "Halt" can be assigned a negative level. The start and stop value mark the region of interest of the x-axis and thus are used as the x-axis scaling in the sweep graphs if the "Scaling "...
- Page 310 ® Instrument Functions R&S Sweeps Start Used to enter the start value for the sweep parameter set in the parameter field above. Only visible for activated generator sweep system. It is set separately for each sweep parameter. The start and stop value implicitly determine the sweep direction: If the start value is less than the stop value, an upward sweep is performed, otherwise a downward sweep will be performed.
-
Page 311: List Sweep
® Instrument Functions R&S Sweeps Note: The number of points on the z-axis (20 maximum) is copied to the Sweep Graph Config panel as "History" if it is larger than the value specified there and the X-Source of the respective window is set to Sweep. Remote command: on page 719 SOURce:SWEep:FREQuency:POINts... - Page 312 ® Instrument Functions R&S Sweeps The sweep points are processed by the sweep system in the order in which they are listed. To define the list sweep as an upward or downward sweep, the sweep points must be entered in the appropriate order. Whereas in a normal sweep each sweep point is measured once only within a scan, the list sweep also offers the ability to mea- sure individual sweep points a multiple number of times.
-
Page 313: Behavior After Sweep End
® Instrument Functions R&S Sweeps Phase File Entry of file name for the phase sweep list. Only visible with generator list sweep acti- vated. Reference Remote command: on page 718 MMEMory:LOAD:PHASe 5.9.7 Behavior after Sweep End The behavior after sweep end determines which signal the generator outputs after a completed sweep or if the generator is muted. -
Page 314: Sweep Speed
® Instrument Functions R&S Sweeps Remote command: on page 719 SOURce:SWEep:FREQuency:HALT:VALue on page 719 SOURce:SWEep:PHASe:HALT:VALue on page 719 SOURce:SWEep:VOLTage:HALT:VALue 5.9.8 Sweep Speed The time required for a sweep cycle is only relevant for automatic sweeps and is deter- mined by the following factors: ●... - Page 315 ® Instrument Functions R&S Sweeps ● Synchronization of the generator to the analyzer when using an internal analyzer. If the generator and analyzer of the R&S UPP are operated together, a generator sweep should always be synchronized to the analyzer. This ensures that the gen- erator is advanced precisely at the point when all measurement results are availa- ble and have settled (where applicable also frequency, level monitor and input measurements on the active channels).
- Page 316 ® Instrument Functions R&S Sweeps measure a signal with a low level (noise). Even if there is a signal on the other channels, the measurement time will still be at least slightly longer than for single- channel mode, since the other channels must be fully evaluated and displayed. ●...
-
Page 317: Selecting The Analyzer
® Instrument Functions R&S Selecting the Analyzer ● Deactivating the settling functions. The settling function does not need to be activa- ted for the majority of measurement signals. If a stable signal is present at the DUT, the R&S UPP delivers measured values in settled state even without Settling. The settling (or averaging) increases the measuring time by a factor of at least the num- ber of configured samples. -
Page 318: Configure Analog Analyzer
® Instrument Functions R&S Configure Analog Analyzer "Analog" Up to 8 channels with different bandwidths can be synchronously measured, see Chapter 5.11, "Configure Analog Analyzer", on page 302. "Digital Audio" Audio data can be measured, see Chapter 5.12, "Configuring the Dig- ital Analyzer", on page 311. - Page 319 ® Instrument Functions R&S Configure Analog Analyzer reasons, the inactive channels are set to the least sensitive measurement range (50 V). Risk of electric shock The instrument complies with measuring category I; make sure that the input voltage at the sockets of the analog analyzers does not exceed 50 V (RMS, sine wave) and 70 V (peak value).
- Page 320 ® Instrument Functions R&S Configure Analog Analyzer Figure 5-6: UPP variants from top to bottom: R&S UPP800, R&S UPP400, R&S UPP200 If the signal is to be supplied via unbalanced analyzer inputs, it is advisable to use the R&S UP-Z1M or R&S UP-Z1MF XLR/BNC adapter. The internal wiring of this adapter is shown in the figure below.
- Page 321 ® Instrument Functions R&S Configure Analog Analyzer "Track mode" If Track is selected in the operator field above, the following field is visible: The reference channel for the Track function is always the reference channel. The cou- pling of the inactive channels does not change. "Split mode: "...
- Page 322 ® Instrument Functions R&S Configure Analog Analyzer "22 kHz" The maximum signal frequency is 22 kHz. The signal is sampled at 48 kHz. "40 kHz" The maximum signal frequency is 40 kHz. The signal is sampled at 96 kHz. "80 kHz" The maximum signal frequency is 80 kHz.
- Page 323 ® Instrument Functions R&S Configure Analog Analyzer Range The possibility of selecting the measurement range allows optimum adaptation to a voltage range required for a specific measurement task. As with the switch-over between AC and DC coupling, it is also possible to select between two options for range setting: either a common setting function for all ranges of the active channels or independent setting of individual channels.
- Page 324 ® Instrument Functions R&S Configure Analog Analyzer If the Fix and Lowest modes are selected, the set nominal range value appears in the next field, where a new range can be set by opening the selection window. The ranges are graduated in steps of 12 dB from 200 mV to 50 V and allow very good dynamic range when measuring nonlinear distortion.
- Page 325 ® Instrument Functions R&S Configure Analog Analyzer Reference impedance for the indicated power in the units dBm, W, Δ%W, ΔW, P/Pr and %P/Pr. The power is calculated using the following formula: where U is the measured voltage and R is the set reference impedance. The indicated power is only correct if the reference impedance is identical to the resistance of the DUT.
- Page 326 ® Instrument Functions R&S Configure Analog Analyzer If a measurement channel which was inactive is selected as a trigger channel it is auto- matically switched on. A warning appears if the channel selected as a trigger channel is switched off. Switching off the measuring channel, which was selected as the trigger channel, there- fore changes the trigger channel after this warning has been acknowledged.
-
Page 327: Configuring The Digital Analyzer
® Instrument Functions R&S Configuring the Digital Analyzer The limit to the FFT size is particularly useful for external sweeps for adapting the mea- surement time to the time frame of an external time tick. A limit is usually associated with degradation in measuring accuracy since incidents such as carrier-level noise can no longer be completely recorded. - Page 328 ® Instrument Functions R&S Configuring the Digital Analyzer Channel Used to set the active measurement channel. Used to select the audio data for the left channel (Channel = 1), right channel (Channel = 2) or both channels (Channel = Both). If a single-channel measurement is selected (Ch1 or Ch2), the data content of the other channel is not taken into consideration.
- Page 329 ® Instrument Functions R&S Configuring the Digital Analyzer "Auto" The sampling rate is measured, set and displayed in the following line. If the applied sampling rate is changed the set value is automati- cally updated. Note: The digital analyzer must re-initialized for each new sampling frequency.
-
Page 330: Interface Assignment
® Instrument Functions R&S Configuring the Digital Analyzer After the Start Cond has been selected, measurement either begins immediately (Auto) or only when the desired trigger condition is fulfilled; for details see Chapter 5.16, "Start Conditions", on page 342. Delay Delay for Start Cond. - Page 331 ® Instrument Functions R&S Configuring the Digital Analyzer Connection Signal Input (I) Description Output (O) Transmitter output Bal+ Ground terminal SYNC IN- Synchronization input Bal- Receiver input Bal+ Ground terminal Transmitter output Bal- SYNC IN+ Synchronization input Bal+ Receiver input Bal- Use of the R&S UPP-B4 (HDMI and digital audio interfaces) option for 2-channel and analysis.
-
Page 332: Configuring The I S Analyzer
® Instrument Functions R&S Configuring the I S Analyzer 5.13 Configuring the I S Analyzer 5.13.1 I S Analyzer Configuration Panel The "I S" analyzer instrument requires the R&S UPP-B2 option (digital audio interface) or the R&S UPP-B4 option (HDMI and digital audio interfaces) for 2-channel and 8- channel "I S"... - Page 333 ® Instrument Functions R&S Configuring the I S Analyzer "Multi" This selection item is offered only if the R&S UPP-B4 (HDMI and digi- tal audio interface) option for 8-channel "I S" analysis is installed and enables the free configuration of up to 8 channels in the following parameter fields.
- Page 334 ® Instrument Functions R&S Configuring the I S Analyzer The sampling frequency corresponds to the frequency of the FSYNC signal. All fre- quency information of measured audio data relates to this setting. If the selected frequency does not correspond to the applied frequency, all filters and frequency measurements are shifted accordingly with respect to frequency.
- Page 335 ® Instrument Functions R&S Configuring the I S Analyzer "Intern" The internal generator is selected as the input. A loop measurement can be performed without a connected cable being required (loop- back test). Remote command: on page 727 INPut[1]:INPut Format Selection of the I S analyzer format "Standard I...
- Page 336 ® Instrument Functions R&S Configuring the I S Analyzer Word Offset By using Word Offset, you can set the number of the SCK cycles by which the Fsync signal is analyzed with delay with respect to the audio data. Value range: -Word Length to 0 to +Word Length-1 Remote command: on page 727 INPut<n1>:WOFFset...
-
Page 337: Timing Diagrams
® Instrument Functions R&S Configuring the I S Analyzer The limit to the FFT size is particularly useful for external sweeps for adapting the mea- suring time to the time frame of an external time tick. A limit is usually associated with degradation in measuring accuracy since incidents such as carrier-level noise can no longer be completely recorded. -
Page 338: Interface Assignment
® Instrument Functions R&S Configuring the I S Analyzer 5.13.3 Interface Assignment S plug (25-pin D-Sub connector) when using the R&S UPP-B2 (digital audio interfaces) option for 2-channel analysis. Connection Signal (I)nput Description (O)utput Ground terminal Ground terminal Ground terminal Ground terminal Ground terminal Ground terminal... - Page 339 ® Instrument Functions R&S Configuring the I S Analyzer Connection Signal (I)nput Description (O)utput Ground terminal Ground terminal Ground terminal Ground terminal Ground terminal not connected RX_SCK Serial Clock Analyzer RX_FSYNC Frame Sync Analyzer RX_DATA Serial Data Analyzer not connected +3.3 V (500 mA) Power Supply +5 V (500 mA)
- Page 340 ® Instrument Functions R&S Configuring the I S Analyzer Connection Signal (I)nput Description (O)utput Ground terminal TX SCK Serial Clock Generator Ground terminal TX FSYNC Frame Sync Generator TX DATA Ch 1,2 Serial Data Generator Ch1,2 TX DATA Ch 3,4 Serial Data Generator Ch3,4 TX DATA Ch 5,6 Serial Data Generator Ch5,6...
-
Page 341: Configuring The Hdmi Analyzer
® Instrument Functions R&S Configuring the HDMI Analyzer An external master clock or an external word clock is fed in at the [SYNC IN] BNC jack of the R&S UPP-B2 (digital audio interfaces) or R&S UPP-B4 (HDMI and digital audio interface) option. - Page 342 ® Instrument Functions R&S Configuring the HDMI Analyzer Format No Video identification code of the supplied video signal according to CEA-861. The ID code is extracted directly from the AVI Info Frame of the connected HDMI source. Remote command: on page 730 SENSe[1]:HDMI:VIDeo:FORMat? Color Depth Color depth of the supplied video format.
- Page 343 ® Instrument Functions R&S Configuring the HDMI Analyzer The "Show" button opens a measurement display in which the frequencies of Pixel Clock, HSync and VSync as well as their time reference are displayed. Deviations of these parameters from the values specified for this format are highlighted in color as errors based on the CEA-861 standard.
- Page 344 ® Instrument Functions R&S Configuring the HDMI Analyzer Vendor Info Frame Opens a window in which the content of the Vendor-Specific Info Frame of a connected HDMI source is shown. The data structure of this Info Frame is specified in the CEA-861 standard.
- Page 345 ® Instrument Functions R&S Configuring the HDMI Analyzer "PCM Lay 1" 8 channels with PCM data. Remote command: on page 729 SENSe[1]:HDMI:AUDio:FORMat:MODE on page 729 SENSe[1]:HDMI:AUDio:FORMat Coding Selection of the decoder functionality. The analysis of Dolby formats is available with the R&S UPP-K41 option (Dolby decoding) only.
- Page 346 ® Instrument Functions R&S Configuring the HDMI Analyzer According to the HDMI 1.4 specification, the N parameter is calculated according to the following relationship: Remote command: on page 729 SENSe[1]:HDMI:AUDio:N The parameter CTS is required by an HDMI load for the regeneration of the audio mas- ter clock.
- Page 347 ® Instrument Functions R&S Configuring the HDMI Analyzer Depending on the number of channels of the supplied audio format, the options of these checkboxes change. Remote command: on page 722 INPut[1]:MCHannels<n2> Audio Bits Word length used. Value range: 8 ... 24 Remote command: on page 725 INPut[1]:AUDiobits...
- Page 348 ® Instrument Functions R&S Configuring the HDMI Analyzer The selected prefilter affects all measurement functions. This permits desired prefilter- ing without selecting appropriate filters for the individual measuring functions. Remote command: on page 773 INPut[1]:FILTer For a description of the filters and their setting parameters, see Chapter 5.39.4, "Filter Table", on page 468.
- Page 349 ® Instrument Functions R&S Configuring the HDMI Analyzer Remote command: on page 723 SENSe[1]:REFerence:CHANnel Trigger Chan Used to select the channel whose event triggers a measurement. If a measuring channel which was inactive is selected as a trigger channel, it is auto- matically switched on.
-
Page 350: Signal Flow Between Dut And R&S Upp
® Instrument Functions R&S Configuring the HDMI Analyzer Max FFT Size Specifies the limit of the automatic zoom fitting for the FFT size for all FFT-supported measurement functions (e.g. THD, THD+N, DFD, each with Post FFT), thus increasing measurement speed. The limit to the FFT size is particularly useful for external sweeps for adapting the mea- suring time to the time frame of an external time tick. -
Page 351: Interface Assignment Of Hdmi
® Instrument Functions R&S Configuring the HDMI Analyzer 5.14.3 Interface Assignment of HDMI All HDMI sockets follow the standard assignment for HDMI 1.4. Signal Signal TMDS Data2+ TMDS Clock Shield TMDS Data2 TMDS Clock– Shield TMDS Data2– TMDS Data1+ Reserved (HDMI 1.0-1.3c), HEC Data- (Optional, HDMI 1.4+ with Ethernet) TMDS Data1 SCL (I²C Serial Clock for DDC) Shield... -
Page 352: Heac Support
® Instrument Functions R&S Configuring the HDMI Analyzer Signal 5.14.5 HEAC Support The HDMI analyzer supports the Audio Return Channel (ARC) and the HDMI Ethernet Channel (HEC). The following block diagram illustrates the internal wiring: The settings for "Sink ARC" are performed in the Config panel for the "Digital Audio" generator instrument, see "Sink ARC"... -
Page 353: Starting Measurements
® Instrument Functions R&S Starting Measurements 5.15 Starting Measurements Measurements are started - and stopped - in manual mode using the keys CTRL+F5 (Start), CTRL+F6 (Single) or CTRL+F7 (Stop/Cont) on the external keypad, or by using the buttons "Start ", "Single " and "Stop/Cont " on the toolbar. The effect of these keys or buttons depends on whether or not the sweep system is active: ●... -
Page 354: States Of The Measurement System
® Instrument Functions R&S Starting Measurements It is also possible to record a large number of data sets which can also be displayed numerically and/or graphically: ● Post FFT and/or bar graph for all channels with distortion measurements; fre- quency band analysis; FFT as measurement function, ●... - Page 355 ® Instrument Functions R&S Starting Measurements Table 5-2: The following states are possible: Channel is deactivated; measured values are not recorded on this channel. Single Single measurement in progress Cont Continuous measurement is being performed Terminated (Single) measurement terminated Stopped Measurement has been terminated;...
- Page 356 ® Instrument Functions R&S Starting Measurements Remote command: on page 731 INITiate:CONTinuous STOP/CONT [STOP/CONT] stops the current measurement immediately and causes the measure- ment system to enter the "Stop" state. Continuous measurement can be reactivated either with [START ] or by pressing [STOP/CONT ] again. Remote command: on page 732 INITiate:FORCe...
- Page 357 ® Instrument Functions R&S Starting Measurements STOP/CONT [STOP/CONT] stops the current measurement immediately and causes the measure- ment system to enter the "Stop" state. Reactivating the single measurement with [SINGLE ]. Remote command: on page 732 INITiate:FORCe Break event .. stops the current measurement immediately and starts a new single measurement (see Chapter 5.15.1, "Overview of the Measurement System",...
-
Page 358: Start Conditions
® Instrument Functions R&S Setting Start Condition 5.15.3.4 Stopped measurement The measurement system only assumes this state when [STOP/CONT ] is pressed while a measurement is being performed. No currently valid measured values or data sets are available. Measured values should not be read out via the remote-control sta- tion when the system is in this state. - Page 359 ® Instrument Functions R&S Setting Start Condition The "Ref Channel" is the reference channel for measurements between two channels. They include the following measurements: ● Phase and group-delay measurement (the frequency measurement result is shown on the reference channel) ● Crosstalk measurements (ratio of two level measured values) ●...
- Page 360 ® Instrument Functions R&S Setting Start Condition Remote command: on page 734 TRIGger:CHANnel Start Cond Specifies the event which triggers a measurement. Depending on the "Start Cond" selected, the measurement starts either immediately (Auto) or only once the required trigger condition is met. Note: With the two-channel analyzers, the trigger conditions appear together with the possible trigger channels in the parameter list;...
- Page 361 ® Instrument Functions R&S Setting Start Condition "Time Tick" Time-controlled measured value recording; measured value triggering at fixed intervals. In the gap between time ticks, measurements are started, the measurement results are entered in the measured value buffer and displayed in the measurement results panel. This start condition cannot be combined with a time-triggered genera- tor sweep.
- Page 362 ® Instrument Functions R&S Setting Start Condition "Time Chart" Time-controlled measured value recording; measured value acquisi- tion at fixed intervals; not available in the multichannel analyzers. Measured values (from the currently running continuous measure- ment) are entered in a time chart in the timescale that can be entered under "Time."...
- Page 363 ® Instrument Functions R&S Setting Start Condition "Freq ..." Externally controlled measured value recording; measured value trig- gering when a significant frequency change occurs on the trigger channel (external frequency sweep); available on multichannel ana- lyzers only if the trigger channel is switched on. The measurement results are entered in the measured value buffer and displayed in the measurement results panel.
- Page 364 ® Instrument Functions R&S Setting Start Condition "Edge ..." Measured value triggering due to a voltage edge detected at the ana- lyzer input on the trigger channel; can only be selected in the multi- channel analyzers if the trigger channel is switched on. This start condition can be combined with any sweep and has no effect on the sweep x-axis.
-
Page 365: Time-Controlled Measured Value Recording
® Instrument Functions R&S Time-Controlled Measured value Recording Remote command: on page 734 TRIGger:DELay 5.18 Time-Controlled Measured value Recording In time-controlled measured value recording, the estimated total recording time is derived from the product of the time interval per measurement and the number of mea- sured value acquisitions. -
Page 366: External Sweeps And Level-Controlled Measured Value Triggering
® Instrument Functions R&S External Sweeps and Level-Controlled Measured value Triggering Note: If the start condition "Time Tick" is combined with the frequency sweep of the selective RMS measurement or a synchronous generator sweep, the number of sweep points is taken from there and cannot be entered separately. Remote command: on page 734 TRIGger:COUNt... - Page 367 ® Instrument Functions R&S External Sweeps and Level-Controlled Measured value Triggering The sweep x-axis is always predefined by the external sweep, even if it is the internal generator that generates the sweep signal. The start and stop values determine the sweep direction for external sweeps: If the start value is less than the stop value, an upward sweep is performed, otherwise a downward sweep will be performed.
- Page 368 ® Instrument Functions R&S External Sweeps and Level-Controlled Measured value Triggering If the present stop value is entered as the start value, the sweep direction is automati- cally reversed and the stop value is given the old start value. Remote command: on page 735 ARM:FREQuency:STARt on page 736...
-
Page 369: Sweep Options
® Instrument Functions R&S Sweep Options The lower entry value takes account of the current start and stop values and is auto- matically limited so that regardless of the sweep direction a maximum of 1024 mea- sured values can be recorded. Values of less than 0.1% cannot generally be entered. Remote command: on page 734 TRIGger:FREQuency:VARiation... -
Page 370: Activating And Deactivating Sweeps
® Instrument Functions R&S Sweep Options event activates the continuous measurement (see Chapter 5.20.3.3, "Terminated sweep", on page 357). The R&S UPP offers many different sweep options, which are briefly summarized here: ● Generator sweep system: Time-synchronous sweeps (DWELL sweeps) and ana- lyzer-synchronous sweeps (AUTO sweeps) and manual sweeps (MANU sweeps). - Page 371 ® Instrument Functions R&S Sweep Options Table 5-3: The following states are possible: Sweep is deactivated; the measurement system is controlled directly by the user. Single Single sweep is being performed Cont Continuous sweep is being performed Waiting Sweep is waiting for a (re)start; has been reactivated or has been run at least once as a single sweep.
- Page 372 ® Instrument Functions R&S Sweep Options Termination event … stops the current sweep immediately and causes the continuous sweep to be restar- ted (see Chapter 5.20.1, "Overview of Sweep Options", on page 353). Z stop value reached The continuous sweep is stopped; the sweep system changes to the "Sweep Waiting" state (only with 2-dimensional generator sweeps, see Chapter 5.9.3, "Two-Dimensional Sweep",...
- Page 373 ® Instrument Functions R&S Sweep Options Termination event … stops the current sweep immediately and causes the single sweep to be restarted (see Chapter 5.20.1, "Overview of Sweep Options", on page 353). X stop value reached The single sweep is stopped; the sweep system changes to the "Sweep Waiting" state. Remote command: 5.20.3.3 Terminated sweep...
-
Page 374: Several Sweep Traces In One Diagram
® Instrument Functions R&S Sweep Options 5.20.3.4 Stopped sweep The measurement system only assumes this state when the [STOP/CONT] key is pressed while a measurement is being performed. Valid measured values and data sets from the sweep point last set are available. However, only some of the measured values of the sweep trace are available. -
Page 375: Level Measurements
® Instrument Functions R&S Level Measurements Since only a finite number of traces (i.e. the last 20 traces) can be stored in multi-scan mode, all the traces only remain visible until rescaling is performed. When rescaling is performed, the graphical display is deleted and the most recent traces are replotted making the graph easier to read. - Page 376 ® Instrument Functions R&S Level Measurements With the level measurements "RMS" and "RMS Selective", the user can decide whether DC levels are to be taken into consideration or suppressed in the RMS. This parameter field is not available in the analog analyzer because the suppression function is already provided by the AC coupling, which can be set up using the hard- ware.
-
Page 377: Rms Measurement, Broadband
® Instrument Functions R&S Level Measurements 5.21.2 RMS Measurement, Broadband Method used to measure the RMS of an AC voltage, either taking account of or disre- garding a superimposed DC voltage. Any given signal shape can be measured. Analog operation: Depending on the selected coupling, a superimposed DC component is measured (DC coupling) or suppressed (AC coupling). - Page 378 ® Instrument Functions R&S Level Measurements "Auto Fast" Where possible, the RMS measurement is performed over entire AC periods; with high frequencies, the measurement time is increased so that the maximum algorithmic error does not exceed 1 %. With very weak, low-frequency or pure DC signals, the maximum measurement time is limited to 100 ms (corresponding to 1 period at 10 Hz).
-
Page 379: Rms Measurement, Selective
® Instrument Functions R&S Level Measurements "Gen Track" The RMS measurement is performed over (at least) 1 whole period of the generator signal; to allow this, the generator frequency is adapted to the sampling rate of the analyzer, if necessary. In the case of high frequencies, the measurement time is extended to several periods in order to increase the measurement accuracy. - Page 380 ® Instrument Functions R&S Level Measurements depending on whether "DC Suppress" is activated or deactivated, a superimposed DC component is measured (deactivated) or suppressed (activated). If a bandpass filter is used, the desired frequency component is measured; if a band- stop filter is used, this component is suppressed.
- Page 381 ® Instrument Functions R&S Level Measurements "Auto" Where possible, the RMS measurement is performed over entire AC periods; with medium or high frequencies, the measurement time is increased so that the maximum algorithmic error does not exceed 0.05 %. With very weak, low-frequency or pure DC signals, the maximum measurement time is limited to 200 ms (corresponding to 2 periods at 10 Hz).
- Page 382 ® Instrument Functions R&S Level Measurements "Gen Track" The RMS measurement is performed over (at least) 1 whole period of the generator signal; to allow this, the generator frequency is adapted to the sampling rate of the analyzer, if necessary. In the case of high frequencies, the measurement time is extended to several periods in order to increase the measurement accuracy.
- Page 383 ® Instrument Functions R&S Level Measurements "BP 1 % ""BS 1 %" Bandpass filter / bandstop filter with relative width of 1 % (geometri- cally symmetrical about the center frequency). (Bandpass filter) (Bandstop filter) "BP 3 % ""BS 3 % " Bandpass filter / bandstop filter with relative width of 3 % (geometri- cally symmetrical about the center frequency).
- Page 384 ® Instrument Functions R&S Level Measurements "BP 1/3 Oct Fast""BS 1/3 Oct Fast" Very fast settling third-octave filter (see above) with only 40 % attenuation. (Bandpass filter) (Bandstop filter) "BP Fix""BS Fix" Bandpass filter / bandstop filter with selectable, arithmetically sym- metrical bandwidth which must be entered in the parameter field below.
- Page 385 ® Instrument Functions R&S Level Measurements "Off" The bandpass sweep / bandstop sweep is deactivated; the band cen- ter frequency can be specified in the "Freq Mode" parameter field. If the generator sweep system is also deactivated, [START ], [SINGLE ] and [STOP/CONT ] affect the measurement system: ●...
- Page 386 ® Instrument Functions R&S Level Measurements Start Used to enter the start value for the bandpass / bandstop center frequency. Only visi- ble for activated bandpass / bandstop sweep. The start and stop value implicitly determine the sweep direction: If the start value is less than the stop value, an upward sweep is performed, otherwise a downward sweep will be performed.
- Page 387 ® Instrument Functions R&S Level Measurements With linear step, the size of the step must always be entered, i.e. the numeric value is positive even if the start value is greater than the stop value. The physical unit is the same as that used when specifying "Start"...
- Page 388 ® Instrument Functions R&S Level Measurements "Fix" Fixed bandpass / bandstop center frequency. The center frequency must be entered in the parameter field below. Note: For infrasound measurements, the center frequency can be reduced down to a sampling rate/48000 (but at least 1 Hz). As very long filter settling times occur in the range below 10 Hz, measure- ment results can only be viewed after several seconds.
-
Page 389: Peak Measurement
® Instrument Functions R&S Level Measurements Remote command: on page 755 SENSe[1]:FREQuency:SELect on page 755 SENSe[1]:FREQuency Factor Used to enter the factor by which the center frequency of the bandpass filter or band- stop filter is to be higher than the generator frequency. Only visible in "Freq Mode Gen Track". - Page 390 ® Instrument Functions R&S Level Measurements Meas Mode Used to select the measurement mode. Result of Peak measurement on 2 example signals depending on selected measure- ment mode "Pos Peak" The highest positive voltage value is measured. "Neg Peak" The (numerically) highest negative voltage value is measured. "Peak to Peak"...
-
Page 391: Dc Voltage Measurement
® Instrument Functions R&S Signal-to-Noise Measurements Remote command: on page 756 SENSe[1]:VOLTage:INTVtime:MODE on page 756 SENSe[1]:VOLTage:INTVtime 5.21.5 DC voltage measurement Measurement of the DC voltage component of an analog or digital signal. The "DC measurement" is not a separate measurement function, but a measurement method that can be selected under "Level Monitor"). - Page 392 ® Instrument Functions R&S Signal-to-Noise Measurements For signal-to-noise measurements, the internal Universal Generator must be used, since an external generator cannot be controlled by the measurement function. If the DUT is inadvertently not connected to the internal generator, measured values of around 0 dB would be determined.
-
Page 393: S/N Measurement Function
® Instrument Functions R&S Signal-to-Noise Measurements 5.22.1 S/N Measurement Function Measurement function for determining the signal to noise of a DUT. For more settings, see Chapter 5.21, "Level Measurements", on page 359. Function (S/N) Selection of S/N measurement. Remote command: SENSe[1]:FUNCtion Meas Mode Used for choosing the level weighting method for signal and noise measurement. - Page 394 ® Instrument Functions R&S Signal-to-Noise Measurements You can decide whether any DC level which may be present in the RMS value should be taken into account or suppressed. This parameter field is not available in the analog analyzer because the suppression function is already provided by the AC coupling which can be set up using the hard- ware.
- Page 395 ® Instrument Functions R&S Signal-to-Noise Measurements Remote command: on page 773 SENSe[1]:FILTer<n2> For a description of the filters and their setting parameters, see Chapter 5.39.4, "Filter Table", on page 468. Meas Time This is used for choosing the measurement time for the purpose of adapting the mea- surement speed to the waveform or, in the case of single tone signals, to the signal fre- quency.
-
Page 396: S/N Sequence In Level Measurements
® Instrument Functions R&S Signal-to-Noise Measurements "Gen Track" For use with the RMS measurement mode only. Level measurements are performed over at least 1 whole period of the generator signal. For this purpose the generator frequency is adapted as necessary to the sampling rate of the analyzer. In the case of high frequencies, the measurement time is extended to sev- eral periods in order to increase the measurement accuracy. -
Page 397: Distortion Measurements
® Instrument Functions R&S Distortion Measurements For more settings, see Chapter 5.21, "Level Measurements", on page 359. S/N Sequence Used for activating the S/N sequence in order to determine the signal to noise. Signal-to-noise measurement can thus be performed in the "RMS" and "Peak" level measurement modes. -
Page 398: General Settings
® Instrument Functions R&S Distortion Measurements ● The digital generator should use all available audio bits; the (overall) signal should have a level of 1.0 FS and as little dither as possible. ● The analog analyzer should be operated in the optimum range, preferably in the "Auto"... - Page 399 ® Instrument Functions R&S Distortion Measurements In this way, the frequency response of a transmission link can be precorrected, for example, and in so doing the measurement point is transformed into another reference point. When precorrection is enabled, the computed FFT bins are multiplied by a frequency- dependent factor, after which they are used to calculate the distortion measurement and applied to the display.
-
Page 400: Thd
® Instrument Functions R&S Distortion Measurements "activated" Bargraph computation (and update) enabled. The remaining settings dynamically define the associated measurement function. Remote command: on page 758 SENSe[1]:FUNCtion:BARGraph Post FFT Activation of the Post FFT; furthermore, the graphics window "FFT Graph1" can be opened from here. - Page 401 ® Instrument Functions R&S Distortion Measurements Figure 5-9: THD measurement of a 1 kHz sine-wave signal with two harmonics of -60 dB and -80 dB Function (THD) Selection of THD measurement. Remote command: SENSe[1]:FUNCtion Meas Mode Used to select the harmonics to be taken into consideration in the THD measured value and to select the calculation formula for the measured value.
- Page 402 ® Instrument Functions R&S Distortion Measurements "Select di" The distortion of any given combination of harmonics d2 to d9 (root from the square sum of the selected harmonics) is measured relative to the total RMS value. ...
- Page 403 ® Instrument Functions R&S Distortion Measurements "Level even di" The distortion voltage of all even harmonics d2 to d8 (root from the square sum of the even harmonics) is measured. The measured value is displayed in voltage units (volts or FS). "Level odd di"...
- Page 404 ® Instrument Functions R&S Distortion Measurements "Auto" The fundamental frequency is determined (separately for each chan- nel) by means of internal frequency measurement. Recommended for use with an external signal source. "Value " Fixed fundamental frequency; the value must be entered in the parameter field below.
-
Page 405: Thd+N & Sinad
® Instrument Functions R&S Distortion Measurements 5.23.3 THD+N & SINAD THD+N & SINAD (total harmonic distortion + noise) is a distortion measurement that measures and displays the energy of the broadband noise without the fundamental (residual signal) within a selectable frequency band (optionally, the energy can also be displayed relative to the total energy). - Page 406 ® Instrument Functions R&S Distortion Measurements Here a compromise must be made between measurement speed and measurement accuracy: ● A small (initial) FFT length and a large rejection bandwidth ("Rejection Bandwidth") mean a short measurement time; the filtered-out sideband of the fundamental is, however, relatively large.
- Page 407 ® Instrument Functions R&S Distortion Measurements For alternative distortion measurement, see Chapter 5.23.2, "THD", on page 384. For more distortion measurements, see Chapter 5.23, "Distortion Measurements", on page 381. Function (THD+N & SINAD) Selection of THD+N & SINAD measurement. Remote command: SENSe[1]:FUNCtion THDNsndr Meas Mode...
- Page 408 ® Instrument Functions R&S Distortion Measurements "THD+N" The total distortion – broadband noise and harmonic – is measured relative to the total RMS value. Noise TotalRMS The total RMS value is band-limited to Frq Lim Upp. The measured value can be displayed in % as well as in dB.
- Page 409 ® Instrument Functions R&S Distortion Measurements Remote command: on page 760 SENSe[1]:THDN:REJection Reject Bandw Used to select the suppression bandwidth ("Rejection Bandwidth") by implicitly enter- ing the initial FFT value. Only functions with deactivated Post FFT; with activated Post FFT, the initial FFT value must be specified explicitly by the user.
- Page 410 ® Instrument Functions R&S Distortion Measurements Fundamental Used to determine the fundamental frequency. "Auto" The fundamental frequency is determined (separately for each chan- nel) by means of internal frequency measurement. Recommended when using an external signal source "Value " Fixed fundamental frequency; the value of which must be entered in the parameter field below Recommended for signals with a high noise component if an external generator is used as the signal source...
- Page 411 ® Instrument Functions R&S Distortion Measurements Reference value is the unweighted input signal, band-limited to Frq Lim Upp (such as R&S UPL / UPD without weighting filter). ● Scenario 2 – Prefilter off, function filter on: Reference value is the unweighted broadband input signal. ●...
-
Page 412: Mod Dist
® Instrument Functions R&S Distortion Measurements Post FFT ← Fnct Settling See section Chapter 5.26, "FFT Analysis", on page 408 for description of the settings and associated remote control commands. Avg Mode ← Fnct Settling See chapter Chapter 5.26.4, "FFT Measurement Function", on page 412 for descrip- tion of the settings and associated remote control commands. - Page 413 ® Instrument Functions R&S Distortion Measurements Equation 5-1: 2nd order intermodulation product Equation 5-2: 3rd order intermodulation product ...
-
Page 414: Dfd
® Instrument Functions R&S Distortion Measurements 5.23.5 DFD DFD is a difference-tone factor analysis which determines the intermodulation products generated by two sine-wave signals of the same amplitude. Depending on the selected measurement mode, the R&S UPP measures the 2nd or 3rd order intermodulation products selectively in accordance with DIN IEC 60268 Part 3. - Page 415 ® Instrument Functions R&S Distortion Measurements IEC 60268 applies the measured intermodulation products to the double upper fre- quency; IEC 60118 applies them to the single upper frequency only. The results according to IEC 60268 are therefore approx. 6 dB better than the results according to IEC 60118.
-
Page 416: Polarity Measurement
® Instrument Functions R&S Polarity Measurement "d2 (IEC 118)" Measurement of the 2nd-order intermodulation product referenced to the single amplitude at the upper frequency (acc. to IEC 60118): Figure 5-12: DFD-d2 measurement in accordance with IEC 60118 "d3 (IEC 118)"... -
Page 417: Frequency Band Analysis
® Instrument Functions R&S Frequency Band Analysis The signal applied to the DUT must therefore fulfill the following requirements: ● The positive amplitude must be greater than the negative amplitude. ● The repetition rate must be 50 Hz or an integer multiple thereof. The "Polarity"... - Page 418 ® Instrument Functions R&S Frequency Band Analysis Nth octave analysis is a selective level measurement performed simultaneously in a number of adjacent frequency bands. The levels of the individual frequency bands are, however, not measured by narrow bandpass filters as in the case of conventional octave or third analysis, but instead with the aid of a special high-resolution FFT by integration of the FFT bins (frequency lines) in the respective band.
- Page 419 ® Instrument Functions R&S Frequency Band Analysis Since nth octave analysis is usually performed in the audio range only, the bandwidth in the analog analyzer should be set to 22 kHz. This avoids not only needlessly large FFTs but also long computation times. A good candidate for use as the excitation signal in the nth octave analysis is the fre- quency-defined Pink Noise that can be created with the R&S UPP Generator (see Chapter 5.6.7,...
- Page 420 ® Instrument Functions R&S Frequency Band Analysis "Critical The audio range is divided into "critical bands" according to the Bark Bands" scale. The band limits are on the Bark scale and the center frequen- cies are 0.5 Bark above the lower band limit in each case. Due to the division into "critical bands"...
- Page 421 ® Instrument Functions R&S Frequency Band Analysis Only two filters are offered for the R&S UPP. The user-definable filters are configured as filters 01 to 09 in the filter panel (see Chap- ter 5.40, "User-Definable Filters", on page 469) and can then be used (repeatedly if necessary) in the analyzer.
- Page 422 ® Instrument Functions R&S Frequency Band Analysis Note: The precorrector table is created after acquiring or reading in the trace data from the "DUT" in the "DispConfig" panels. The precorrector is disabled. The FFT bins are used and displayed "deactivated" without change.
- Page 423 ® Instrument Functions R&S Frequency Band Analysis Configuration of the bar graphs is reserved for the "Bargraph1 Config" and/or "Bar- graph2 Config" windows. The actual display takes place in the "Bargraph1" or "Bar- graph2" windows. "deactivated" Bargraph computation (and update) disabled. Only the band-limited total RMS value is measured.
-
Page 424: Fft Analysis
® Instrument Functions R&S FFT Analysis When using manual selection the FFT size should not be less than the recommended value (which is produced when Post FFT is activated), otherwise there will be too few FFT bins in the lower subbands. With every increase in FFT size the measurement accuracy and stability increase, par- ticularly in the relatively narrow lower subbands. -
Page 425: Size Of The Fft
® Instrument Functions R&S FFT Analysis ● The "FFT as measurement function" (Function FFT) is, like the Post FFT, also cal- culated with double precision but additionally allows a number of other functions such as averaging and undersampling (limiting the frequency range to increase the frequency resolution) as well as free selection of the FFT size and window. -
Page 426: Window Function
® Instrument Functions R&S FFT Analysis 5.26.2 Window Function According to system theory, the FFT analysis requires a periodic signal which contin- ues continuously beyond the observed time period. Normally, however, there is no con- tinuous continuation (even with periodic signals). The FFT would interpret any disconti- nuity at the boundaries of the signal section as a pulse whose (white) spectrum would be superimposed on the wanted signal spectrum. -
Page 427: Post Fft
® Instrument Functions R&S FFT Analysis "Rife Vincent The suppression of far-off interference is very good for all 3 windows. x" The width of the bell-shaped curve at the bottom of the individual lines drops and the width at the top increases as the Rife Vincent number increases. -
Page 428: Fft Measurement Function
® Instrument Functions R&S FFT Analysis Note: In measurement functions for which users cannot select Post FFT, this menu line is grayed out. In this case, there are two options: 1. FFT is not needed by any currently selected measurement and is therefore not com- puted in order to save time. - Page 429 ® Instrument Functions R&S FFT Analysis ● Averaging Measurement is performed in the same level as the other measurement functions, i.e. downstream of all filters. The Function FFT is calculated with double precision using up to 256 k points, thus ensuring a very high frequency resolution and dynamic range.
- Page 430 ® Instrument Functions R&S FFT Analysis The time by which the channel specified as the "Ref Channel" in the Analyzer Config Panel is to be offset relative to the other channels. If the delay of the other channels is shorter than that of the "Ref Channel ", this can be compensated by entering a nega- tive time.
- Page 431 ® Instrument Functions R&S FFT Analysis Remote command: on page 773 SENSe[1]:FILTer<n2> Equalizer Used for activating/deactivating a equalizer table for the FFT bins. In this way the frequency response of a transmission link can be equalized, for exam- ple, and in so doing the measurement point is transformed into another reference point.
- Page 432 ® Instrument Functions R&S FFT Analysis Freq Limit RMS value calculation on the basis of the FFT bins between frequency marks "deactivated" The frequency limits for calculating the RMS value from the FFT bins is based on the Start and Stop values of the FFT (shown but not accessible), i.e.
- Page 433 ® Instrument Functions R&S FFT Analysis FFT Mode The time alignment between subsequent FFT acquisition periods can be set. Available for FFT and all FFT-based measurement functions. Requires R&S UPP-K602 option (Overlapping FFT Analysis). "Normal" A continuously running FFT has gaps in between the acquisition peri- ods.
- Page 434 ® Instrument Functions R&S FFT Analysis "Exponential" Averaging is performed continuously and displayed. When the current result is calculated, the previous measurements are taken into con- sideration using a constant factor. The weighting of the current mea- surement (n) and of the previous measurements (n-1) is determined by the selectable average count (k);...
-
Page 435: Noise Voltage Density
® Instrument Functions R&S Noise Voltage Density Start Start value of the FFT frequency band (display only) Remote command: on page 763 SENSe[1]:FUNCtion:FFT:STARt? Stop End value of the FFT frequency band (display only) In the case of a broadband FFT in the digital analyzer, this is 23 or 48 times the sam- pling frequency;... - Page 436 ® Instrument Functions R&S Noise Voltage Density The Noise Voltage Density is displayed at the cursor position and is activated with the appropriate setting for Reference in the FFT Graph Config Panel (see setting 'Noise Density, Noise Density dB' for parameter "Reference"...
-
Page 437: Delay Measurement
® Instrument Functions R&S Delay Measurement 5.28 Delay Measurement With the "Delay" measurement function it is possible to determine the delay time between analog signals. When the measurement starts, the observed signals must have a low level; therefore a suitable sample signal would be, for example, the burst signal generated by the R&S UPP. - Page 438 ® Instrument Functions R&S Delay Measurement "Value " The RMS measurement is performed over a preset time which must be entered in the parameter field below. Numeric input of the measurement time. All desired signals (including the reference signals) must have occurred within this time. Channels with a longer delay time are labeled as invalid after this time expires and the user info line displays a short note.
-
Page 439: Chirp-Based Measurement
® Instrument Functions R&S Chirp‑Based Measurement 5.29 Chirp‑Based Measurement Evaluation of the impulse response of a DUT for the stimulus signal generated by the "Chirp" generator function. When the DUT is excited by a logarithmic sine‑wave sweep as a stimulus signal by means of the "Chirp"... - Page 440 ® Instrument Functions R&S Chirp‑Based Measurement Remote command: on page 764 MMEMory:STORe:PWAVeform Delay Comp For the calculation of the measurement results, the time shift between the signals before and after the DUT must be compensated. "Manual" If the delay of the DUT is known and constant, the entry of this known delay value reduces the calculation time.
- Page 441 ® Instrument Functions R&S Chirp‑Based Measurement Fct SwpXTrY Evaluation of the impulse response with respect to the desired measurement result. The title of the 8 combo boxes indicates in which of the sweep graphic subsystems and with which trace the measurement result is shown. Swp1 to 4 designates sweep sub- system Sweep Graph 1 to 4, and TrA and TrB designate trace A (green) and B (yellow) used in this sweep subsystem to represent the desired measurement result.
- Page 442 ® Instrument Functions R&S Chirp‑Based Measurement "Level THD" RMS value of the selected harmonic distortion products (distortion value) over frequency THD = Total Harmonic Distortion. Distortion is measured as an RMS value using the harmonics to be set in the panel shown below. For details on the calculation, see Chapter 5.23.2, "THD",...
-
Page 443: Data Buffers
® Instrument Functions R&S Chirp‑Based Measurement Note: Regardless of the digital filters selected here, a further input filter ("prefilter") can be looped into the measurement path. Moreover, the analog bandwidth can be restric- ted with the aid of the "Bandwidth" parameter field, which corresponds to an additional lowpass filter. - Page 444 ® Instrument Functions R&S Chirp‑Based Measurement addressed with the suffix 1, the values on the y‑axis (trace data) with the suffix 2 to 9 and the raw data with 10 to 89. The "Example for reading in raw data" given below shows how the suffix is calculated for a certain data set.
- Page 445 ® Instrument Functions R&S Chirp‑Based Measurement Table 5-4: Meaning of suffixes Suffix Content of data buf- Description Frequency values Raw data: X values, given in the basic unit Hz, to which all levels or degree values of the raw data from suffix 10 and higher refer. The SCPI command "TRACe:SWEep<i>:LOAD:AX?"...
-
Page 446: Analysis In The Time Domain
® Instrument Functions R&S Analysis in the Time Domain Suffix Content of data buf- Description CH2 d7 CH2 d8 CH2 d9 30 to 39 Raw data for Ch3 Raw data for Ch3 to Ch8, as described for Ch1. 40 to 49 Raw data for Ch4 50 to 59 Raw data for Ch5... - Page 447 ® Instrument Functions R&S Analysis in the Time Domain Waveform Used to activate the waveform monitor; the graphic is configured and displayed in the Waveform ("Config") configuration and graphical window. Click the "Show" button to open the Waveform graphic. As with any other window, the graphic can be closed by clicking the title bar button , provided it is the active win- dow.
- Page 448 ® Instrument Functions R&S Analysis in the Time Domain "Compressed" Compressed recording of the samples produced by peak value rectifi- cation. Specifying a value (n) for the "Comp Fact" (compression fac- tor) in the next operator field means that the highest value out of every n consecutive samples is determined and this peak value is used as the input signal for the waveform function.
- Page 449 ® Instrument Functions R&S Analysis in the Time Domain A maximum of 48000 samples can be stored. Apart from the bandwidth (analog) and sampling rate (digital), the possible recording length also depends on the selected operating mode (the compression factor): ●...
- Page 450 ® Instrument Functions R&S Analysis in the Time Domain Note: If Undersample FFT is enabled, the waveform trigger source cannot be selected. Instead, it is automatically set to Manual. Selects the source (usually one of the measurement channels) which is to trigger mea- surement recording if the trigger threshold is overranged or underranged.
- Page 451 ® Instrument Functions R&S Analysis in the Time Domain Remote command: on page 767 SENSe7:TRIGger:SOURce Trigger Level Entering the trigger level Recording is triggered according to the ""Trigger Slope"" when this level is overranged or underranged. When measurement has been started or recording has been triggered (in the case of continuous measurement), a new recording cycle is not armed again until the trigger threshold is violated in the opposite direction.
-
Page 452: Delay Measurement
® Instrument Functions R&S Analysis in the Time Domain The pretrigger memory is filled from the start of the measurement and always contains the latest samples of the time frame selected as the pretrigger, before triggering occurs. For so long as the pretrigger is not completely full, triggering remains locked. It is only armed when the pretrigger memory is full and is at least one sample below the trigger threshold. - Page 453 ® Instrument Functions R&S Analysis in the Time Domain input of the DUT and the time required for the signal to appear at the output of the DUT is measured. With this type of measurement, it is essential for the time measurement to be started exactly when the signal appears at the input of the DUT, i.e.
- Page 454 ® Instrument Functions R&S Analysis in the Time Domain ● The "Filter" and "Equalizer" should not be used unless absolutely necessary. If a filter or filters are used, it must be borne in mind that the settling of the filter will be visible in the waveform trace, since in this case the start of the measurement can- not be delayed by the filter settling time as is otherwise usual.
- Page 455 ® Instrument Functions R&S Analysis in the Time Domain ● Generally, the "generator function" should be set to "Sine Burst"; it is, however, also possible to use other signals from the internal generator to perform single measurements. ● The "Low Level" of the burst signal must be set to 0.0 (V or FS), especially for con- tinuous measurements, so that the burst pause can arm the trigger for the next measurement.
-
Page 456: Protocol Analysis
® Instrument Functions R&S Protocol Analysis 5.31 Protocol Analysis R&S UPP-K21 (digital audio protocol) or R&S UPP-K45 (expanded audio/video mea- surements) option has to be installed to be able to select the protocol analysis in the digital audio instrument or in the HDMI instrument. The HDMI instrument is option R&S UPP-B4. - Page 457 ® Instrument Functions R&S Protocol Analysis Click the Show button to open the "Dig Analyzer Protocol" window. You can close the window, as with any other, by means of clicking on the title bar button "deactivated" The protocol analyzer is off. This setting is recommended for increasing the measurement speed (e.g.
- Page 458 ® Instrument Functions R&S Protocol Analysis "Consumer" The channel-status bits are always interpreted in Consumer format in accordance with the IEC 60958-3 standard regardless of the state of bit #0. This avoids the possibility that a bit error in bit #0 might cause the display format to switch over.
-
Page 459: Channel-Status Information Display
® Instrument Functions R&S Protocol Analysis Remote command: on page 768 SENSe8:PROTocol:PERSistence View Mode For defining how the channel-status information should appear. "Binary+Text" The bit fields are displayed both as binary values (MSB first) and in plain text. "Binary" The bit fields are displayed only as binary values (MSB first). This reduces the space required by the "Dig Analyzer Protocol"... -
Page 460: Error Flag Display
® Instrument Functions R&S Protocol Analysis When the format is predefined the meaning of the individual bit fields, as well as the interpretation of the content and even of the position and length of the bit fields depend on other, preceding bit fields. These formats are continually being developed by the IEC standardization committee, for which reason new and previously reserved bit com- binations are added. -
Page 461: Lip Sync Analysis
® Instrument Functions R&S Lip Sync analysis Error Flags Meaning of error flags: Note: All error flags will be set (red) if a Lock error occurs. "PCM" indicates whether the signal is Linear PCM-coded (green) or not (red). This error flag corresponds to audio mode (bit #1 of the chan- nel-status data). - Page 462 ® Instrument Functions R&S Lip Sync analysis The "Lip Sync" generator function creates such a signal with user-configurable Active and Mute Color pattern and a time offset of 0 (see also Chapter 5.6.14, "Lip Sync", on page 277). The Lip Sync analyzer operates internally with two trigger events: The video trigger is initiated as soon as a certain color value has been detected.
- Page 463 ® Instrument Functions R&S Lip Sync analysis With a "Color Depth" of 12, the Video Trigger is activated without any problems, since the "Mute Color" is still outside of the threshold range: "Mute Color" = (1000,2000,3000), "Active Color Low" = (1005,2005,3005), "Active Color High" = (1015,2015,3015) With a "Color Depth"...
- Page 464 ® Instrument Functions R&S Lip Sync analysis The two thresholds "Active Color Low" and "Active Color High" define the condition of the video trigger for the Lip Sync measurement. The trigger condition is considered met if the individual values of the color components all fall within the two limits: (Active_Color_Low.Red ≤...
-
Page 465: Bert Analysis
® Instrument Functions R&S BERT analysis The color selection from the above color selection dialog above is mapped as RGB string and can be configured here, if necessary. In each case, the decimal equivalent of 12-bit long numeric values is mapped. With a lower color depth in the "Color Depth" selection field in the Config range of the generator, the corresponding LSBs are not transmitted, but set to 0. -
Page 466: Frequency, Phase And Group Delay Measurement
® Instrument Functions R&S Frequency, Phase and Group Delay Measurement The "BERT" analyzer function enables measuring the bit error rate across an HDMI transmission path by sending defined bit patterns in the picture content. The measure- ment can be selected only if the settings "Source" = "Intern" and "Pattern" = "BERT" have been selected in the generator, otherwise a corresponding message appears. - Page 467 ® Instrument Functions R&S Frequency, Phase and Group Delay Measurement With 2-channel or multichannel measurements, the frequency on the other channels is often the same as the frequency on the reference channel. In such cases, it is advisa- ble to display a frequency-related measured value instead of the frequency in the mea- surement window of the other channels.
- Page 468 ® Instrument Functions R&S Frequency, Phase and Group Delay Measurement "Freq & Grp Only available for two-channel measuring mode or in a multichannel Del" analyzer. Frequency measurement is performed on the reference channel; the measurement windows of the other channels contain the group delay of the respective channel referenced to the reference channel.
- Page 469 ® Instrument Functions R&S Frequency, Phase and Group Delay Measurement "Freq & Sam- Only available for two-channel or multichannel measuring mode in ple Freq" the digital analyzer. The sampling frequency is measured on the channel last activated. On all other channels (i.e. channel 1 in two-channel analyzers), a fre- quency measurement is performed.
- Page 470 ® Instrument Functions R&S Frequency, Phase and Group Delay Measurement "Fast" The frequency and (if applicable) phase measurement is optimized with respect to speed. A 4 k FFT is used as the measurement basis for high frequencies and the phase; low frequencies are determined by means of an evaluation of period (with interpolation).
-
Page 471: Input Monitor
® Instrument Functions R&S Input Monitor depending on whether degrees or RAD has been selected for the phase unit. "0..360°" The phase is displayed in the range 0° to 360°; only available if "°" has been selected for the phase unit. "-180..180°"... -
Page 472: Level Monitor
® Instrument Functions R&S Level Monitor For other level measurement options, see Chapter 5.21, "Level Measurements", on page 359, and Chapter 5.36, "Level Monitor", on page 456. Input Monitor Used to activate the input level meter and to select the measurement method. "Off"... -
Page 473: Second Monitor
® Instrument Functions R&S Second Monitor "RMS" A broadband RMS measurement is performed which – with the fre- quency measurement switched on – uses automatic period detection. (The measurement method in this case corresponds to the "RMS measurement function " in the "Meas Time Auto mode "). With weak signals, measurement is performed over a fixed period of 100 ms. -
Page 474: Settling Methods
® Instrument Functions R&S Settling Methods "Off" Second Monitor is switched off. "Input Monitor" Settings and remote commands are the same as for Input Monitor, Chapter 5.35, "Input Monitor", on page 455. "Level Monitor" Settings and syntax of remote commands are the same as for Level Monitor, see Chapter 5.36, "Level Monitor",... - Page 475 ® Instrument Functions R&S Settling Methods onds, depending on the sampling rate. What may actually cause problems are delays and settling times that occur in the "DUT" and, possibly, also on the transmission lines from the generator to the "DUT" and from the "DUT" to the analyzer. If they are known and constant for all signal changes that occur, the total delay may be entered as "Start Condition Delay", and is then treated as a waiting time prior to the start of the measurement –...
-
Page 476: Settling Algorithms
® Instrument Functions R&S Settling Methods 5.38.2 Settling Algorithms The R&S UPP offers two different settling algorithms. As a feature common to both algorithms, each current measured value is compared with up to five of the immedi- ately preceding measured values and is accepted as valid only if the differences between the current value and the preceding values are within specified tolerances. - Page 477 ® Instrument Functions R&S Settling Methods Results of measurement functions are not valid until the selected settling condition is fulfilled. With the S/N measurement function and with level measurement functions in the S/N mode, the instrument determines the settling times separately for the useful signal plus noise and for the noise signal only.
- Page 478 ® Instrument Functions R&S Settling Methods Remote command: on page 771 SENSe[1]:FUNCtion:SETTling:MODE Samples Designates the number of measured values to be covered by the settling algorithm, i.e. it defines how many measured values are to be used in the settling measurement or for averaging.
-
Page 479: Settling For Start Conditions (Event-Triggered Measurements)
® Instrument Functions R&S Settling Methods If no stable measured value is detected during this time, the measurement is aborted. An invalid measured value is output in the numeric display, the sweep and also via the remote line. Defining a timeout is important especially with the "true" settling methods, because, with these methods, a settled value may never be detected if tolerance limits are too narrow. - Page 480 ® Instrument Functions R&S Settling Methods Settling Used to activate the settling measurement for the frequency/level monitoring routine in the case of external sweeps and external level/edge triggering, and to select the "set- tling" method. Results of trigger signal measurements are valid only if the selected "settling "condition is fulfilled.
- Page 481 ® Instrument Functions R&S Settling Methods With "n" samples set, the following number of trigger-value measurements are to be expected: ● With frequency triggering and flat settling: n or n+1 ● With level triggering and exponential settling: > n Note: In this exceptional case, the term "sample" is used to designate an internal mea- surement result instead of a digital sample.
-
Page 482: Examples Of Settling
® Instrument Functions R&S Filter 5.38.5 Examples of Settling The examples below are based on the following settings: With the above settings, the current measured value may deviate: ● from the last measured value by a max. of +/- 1% (or +/- 0.086 dB), ●... -
Page 483: Analyzer Prefilter
® Instrument Functions R&S Filter Here, there is an overview of the filters which can be set up in the analyzer and gener- ator, together with the remote-control parameters, see Chapter 5.39.4, "Filter Table", on page 468. 5.39.1 Analyzer Prefilter A filter which influences all measurement functions can be selected in the Analyzer Config panel. -
Page 484: Filter Table
® Instrument Functions R&S Filter Analog generator: In the Generator Config panel, set "Voltage Range" to "Fix", and in the Generator Function, panel set the level low enough to ensure that the amplified level will always be less than the selected fixed voltage range. Example: Here the maximum allowable gain of the filter is 4 (12 dB). -
Page 485: User-Definable Filters
® Instrument Functions R&S User-Definable Filters Table 5-7: Weighting Filters Display in Selection Field Remote-Control Parameter A Weighting C Weighting CCIR 1k wtd CCIR CCIR 2k wtd CARM CCIR unwtd CCIU CCITT CCIT C Message CMES DC Noise HP Deemph J.17 DEMP17 Deemph 50/15 DEMP5015... -
Page 486: Filters 01 To 09
® Instrument Functions R&S User-Definable Filters These filters are implemented as recursive, elliptical eighth-order digital filters (excep- tion: fourth order is also possible for lowpass and highpass filters). All filters are calcu- lated by means of frequency transformation from a database with standardized refer- ence lowpass filters. -
Page 487: Lowpass Filter And Highpass Filter
® Instrument Functions R&S User-Definable Filters 5.40.2 Lowpass Filter and Highpass Filter Figure 5-17: Lowpass and highpass frequency response with filter parameters Order Used to specify the filter order. Only available for lowpass and highpass filters. Low- order filters have edges with a lower rate of rise, but settle more quickly. "4"... -
Page 488: Bandpass Filters And Bandstop Filters
® Instrument Functions R&S User-Definable Filters Remote command: on page 775 SENSe[1]:UFILter<n2>:PASSb Stopband Displays the cutoff frequency of the stopband in the case of lowpass and highpass fil- ters; the cutoff frequency is derived from the selected passband and the stopband attenuation. -
Page 489: Notch Filter, Third-Octave Filter And Octave Filter
® Instrument Functions R&S User-Definable Filters Remote command: on page 775 SENSe[1]:UFILter<n2>:PASSb:LOWer Passb Upp Used to specify the lower corner frequency (- 0.1 dB) of the passband for bandpass or bandstop filters. Remote command: on page 775 SENSe[1]:UFILter<n2>:PASSb:UPPer Stopb Low Displays the lower cutoff frequency of the stopband in the case of bandpass and band- stop filters;... - Page 490 ® Instrument Functions R&S User-Definable Filters Third- Passband CenterFreq octave fil- ter: Bandwidth 2315 Octave fil- Passband CenterFreq ter: Bandwidth 7071 With the third-octave and octave filters, the 0.1 dB bandwidth is reduced until an attenuation of approx.
-
Page 491: File-Defined Filter
® Instrument Functions R&S User-Definable Filters Remote command: on page 776 SENSe[1]:UFILter<n2>:STOPb:UPPer 5.40.5 File-Defined Filter If the filters installed on the instrument do not satisfy the requirements of the applica- tion concerned, it is possible to read in a filter from a file. Two file formats are suppor- ted in which the filter is described either by the coefficients of the transfer function (*.coe) or by the poles and zeros (*.zpz or *.npz and *.xpz) in the z level. - Page 492 ® Instrument Functions R&S User-Definable Filters The coefficient file *.COE is only valid for the sampling rate determined during the design stage, i.e. the frequency response of the filter is standardized to this sampling rate. If a different sampling rate is set in the R&S UPP, the frequency response changes accordingly.
-
Page 493: Parameters Common To All Filters
® Instrument Functions R&S User-Definable Filters response of the filter remains within the specified tolerance. This file format allows fil- ters with tight tolerances to be used over a wide range of sampling frequencies. Poles and zeros in the *.XPZ file are normalized to the sampling frequencies specified for the individual parameter sets. -
Page 494: Weighting Filters
® Instrument Functions R&S Weighting Filters lated time is too short, the filters cannot settle properly before the measurement is star- ted. This can result in unstable measured values. The following trick can be used to remedy this problem: If the DELAY.COE file-defined filter (in the D:\UPV\USER directory) is selected, a set- tling time can be entered there, which is added to the settling time of the other filters when measurement is performed. - Page 495 ® Instrument Functions R&S Weighting Filters Filters: C Weighting Standards: IEC 179, IEC 651 ANSI S1.4 Application: Weighted noise measurement Filters: CCIR 1k wtd Standards: Standards: CCIR Rec. 468-4 DIN 45405 CCITT Rec. N21 CISPR 6-76 ITU-T J.16 Application: Weighted noise measurement Filters: CCIR 2k wtd...
- Page 496 ® Instrument Functions R&S Weighting Filters Filters: CCITT Standards: Standards: ITU-T Rec. O. CISPR 6-76 ITU-T Rec. P.53 Application: Psophometric weighting Filters: C Message Standards: IEEE 743-1995 Application: Weighted noise measure- ment Filters: DC Noise HP Standards: Standard: ARD Spec. 3/4 ARD Spec.
- Page 497 ® Instrument Functions R&S Weighting Filters Filters: Deemph J.17 Standards: ITU-T J.17 Application: Weighted noise measure- ment Filters: Deemph 50/15 Standards: CCIR Rec. 651 Application: Compact disc Filters: Deemph 50 Standards: ARD Spec. 5/3.1 Application: Weighted noise measure- ment Filters: Deemph 75 Standards: ARD Spec.
- Page 498 ® Instrument Functions R&S Weighting Filters Filters: IEC Tuner Standards: DIN/IEC 60315-4 Application: Measurements on FM tuners Filters: Jitter wtd Standards: AES 3 Application: Application: Weighting of jitter transfer function 1st order HP -3 dB at 700 Hz -20 dB at 70 Hz Filters: Preemph 50/15 Standards:...
- Page 499 ® Instrument Functions R&S Weighting Filters Filters: Preemph 50 Standards: ARD Spec. 5/3.1 Application: Weighted noise measure- ment Filters: Preemph 75 Standards: ARD Spec. 5/3.1 Application: Weighted noise measure- ment Filters: Rumble unwtd Standards: Standards: DIN 368.3 DIN 45539 Application: Unweighted noise mea- surement User Manual 1411.1055.32 ─...
-
Page 500: Highpass And Lowpass
® Instrument Functions R&S Highpass and Lowpass Filters: Rumble wtd Standards: DIN 45539 Application: Weighted noise measure- ment 5.42 Highpass and Lowpass In addition to the user-definable filters and the weighting filters, the R&S UPP also offers a selection of preset highpass and lowpass filters. The weighting filters and the fixed highpass and lowpass filters are not selected in the Filter panel. -
Page 501: Auxiliaries Panel
® Instrument Functions R&S Auxiliaries Panel 5.43 Auxiliaries Panel Figure 5-21: Auxiliaries panel In the "Auxiliaries " Panel, the additional function "Audio Monitor " can be selected. The monitor outputs (BNC sockets on the rear panel) permit the monitoring of analog or digital input signals (referred to as "Monitoring"... - Page 502 ® Instrument Functions R&S Auxiliaries Panel Audio Monitor Activates/deactivates the monitoring function. The monitoring signal level is adjusted in the "Volume " parameter field or by pressing CTRL+F9 on the external keypad. The audio monitor is not available for the "HDMI" analyzer instrument in the coding = "Auto Detect"...
- Page 503 ® Instrument Functions R&S Auxiliaries Panel "DC" Starting with serial numbers 120100, 140100, 180100, the supply of external instruments of the R&S UPP can be handled by outputting two DC voltages in the range from -5 V to +5 V which can be set independent of each other.
- Page 504 ® Instrument Functions R&S Auxiliaries Panel Range from -120 dB (lowest level) up to 120 dB (highest level). Note: Volume settings above 0 dB may cause the enlarged digital signal to be over- driven and thus the monitoring signal to be distorted. If "Signal Source"...
-
Page 505: Switcher Panel
® Instrument Functions R&S Switcher Panel Remote command: on page 778 AUXiliaries:TRIGger:OUTPut:MODE on page 778 AUXiliaries:TRIGger:OUTPut:DELay 5.44 Switcher Panel This section describes how to connect and operate the R&S UPZ switcher on the R&S UPP. 5.44.1 Connecting Switcher to R&S UPP The R&S UPZ audio switchers can be connected to the R&S UPP. -
Page 506: Default Setting
® Instrument Functions R&S Switcher Panel COM Port Selecting the COM port sets the RS232 parameter in such a way as to guarantee the connection to the switcher without any further settings. The easy to handle setting "Auto" is recommended. After installing the USB driver or changing the COM port, the R&S UPP must be restar- ted. -
Page 507: Operation
® Instrument Functions R&S Switcher Panel 5.44.3 Operation Open the panel for operating the switcher as follows: "Menu – Instruments – Switcher Panel " Switcher The checkbox activates or deactivates the operation of the switcher. This status is not dependent on whether the panel itself is open or not. Remote command: on page 780 SWITcher:STATe... - Page 508 ® Instrument Functions R&S Switcher Panel B vs A For entering the channel offset between the busbars A and B, in common for input and output switchers. This operator field only appears when tracking "B vs A" or "All" is selected. Remote command: on page 780 SWITcher:OFFSet:BVSA...
-
Page 509: Config Panel
® Instrument Functions R&S Config panel It is not possible to set this channel to busbar A. If this is attempted, a correction is made to the next higher or next lower channel number. Remote command: on page 780 SWITcher:OUTB 5.45 Config panel This section describes the Config panel of the R&S UPP where settings are made that affect the behavior of the instrument (partly across all panels). - Page 510 ® Instrument Functions R&S Config panel The IEC/IEEE bus address of the instrument is factory-set to 20 and can be modified here. Addresses from 0 to 30 are permissible. For more information, see Chap- ter 6.3.1, "Remote Control by IEC/IEEE Bus ", on page 640.
- Page 511 ® Instrument Functions R&S Config panel "UPx Window" This setting outputs the entire screen of the R&S UPP as a bitmap. This is the default after firmware installation. "Act. Graphics" This setting outputs the momentarily active graphical window as a vector graphic.
- Page 512 ® Instrument Functions R&S Config panel Remote command: on page 829 HCOPy:GSIZe Orientation Selection of the orientation required on the Windows printer (only if "Destination" is configured as "Printer"). "Portrait" Output on the printer is in portrait format. "Landscape" Output on the printer is in landscape format. Remote command: on page 830 HCOPy:PRINter:ORIentation...
- Page 513 ® Instrument Functions R&S Config panel Store Mode Selection of the mode for output to a file. Only available if "Destination" is set to File. "New" Pressing [H Copy] opens the file selection box in which you enter the name of the destination file. See also the section Chapter 5.58.1, "Saving Setups",...
- Page 514 ® Instrument Functions R&S Config panel The R&S UPP allows you to have the toolbar displayed at the edge of the screen all the time. This feature is primarily intended in the case of mouse operation. "activated" The toolbar is permanently displayed at the edge of the screen. "deactivated"...
-
Page 515: Curve, Spectrum And Bar Graph Display
® Instrument Functions R&S Curve, Spectrum and Bar Graph Display The labeling of the display fields in the Numeric Display is generally Ch1, Ch2, Ch3, etc., but it can be changed with the "Channel Descr." parameter field. The respective string is called: "Ch-A;;Ch-B;;Ch-C;;Ch- D;;Ch5;;Ch6;;Ch7;;Ch8;;Ch9;;Ch10;;Ch11;;Ch12;;Ch13;;Ch14;;Ch15;;Ch16". -
Page 516: Graphical Display, Explanation Of The Elements
® Instrument Functions R&S Curve, Spectrum and Bar Graph Display and modified using the associated configuration panel and displayed as traces or bar graphs. 5.46.1 Graphical Display, Explanation of the Elements Whether a graphical display is shown as a trace or a bar graph depends on the selected display configuration panel. - Page 517 ® Instrument Functions R&S Curve, Spectrum and Bar Graph Display 1: Name of the graphical window To be set via the menu bar "Displays" or "Disp Config" and the "Display Show" button in the corresponding panel 2: Additional cursor values ∆X, ∆Y, ol, or, o∆X xl, xr, x∆X ∆X: Difference between the X values if the O and X cursors are both activated as the vertical cursor at the same time.
- Page 518 ® Instrument Functions R&S Curve, Spectrum and Bar Graph Display Y value on the Y1 and/or Y2 axis. 7, 16: Labeling of y-axis Consists of the label and unit; set with Chapter 5.46.3, "Parameter Fields of the Panel", on page 508. 8, 15: Scaling of y-axis Automatic ( "Auto Scale ") or scaling ( "Top, Bottom ") of the y-axis to be set manually, to be set using...
- Page 519 ® Instrument Functions R&S Curve, Spectrum and Bar Graph Display in which the desired scan can be selected by clicking the appropriate number. The cur- sors, markers, limit values and so on are then referenced to this scan. 11: Softkey bar The softkey menu for the graphical window allows quick configuration of all the impor- tant and frequently used settings, especially cursor, marker, and zoom functions, or by clicking with the mouse.
- Page 520 ® Instrument Functions R&S Curve, Spectrum and Bar Graph Display 14: Scaling of x-axis Only for displaying curves, not in graphic system Bargraph1 | 2: Automatic or manually set scaling of the x-axis; set with Chapter 5.46.3, "Parameter Fields of the Panel", on page 508.
- Page 521 ® Instrument Functions R&S Curve, Spectrum and Bar Graph Display The harmonic markers are activated using the softkeys: Available in the graphics subsystems 20: Graphical window The graphical window to each graphics subsystem is opened from each Display Config Panel using or directly from the menu bar Figure 5-22: Display menu for two and multichannel instruments 21: Marker...
-
Page 522: Calling Up
® Instrument Functions R&S Curve, Spectrum and Bar Graph Display The marker is set using the softkeys: Available in the graphics subsystems Sweep, FFT, Waveform 23: Cursor intersection points The O or X at which the cursor line intersects the trace / lines identify the cursor so that a reference to the labels in the softkey bar, such as O Vert A or X Hor A, is provided. - Page 523 ® Instrument Functions R&S Curve, Spectrum and Bar Graph Display A number of different display configuration panels can be selected simultaneously, some of them in two or four windows, e.g. the measurement data sets for the analyzer measurement function RMS and the measurement data sets for the additional measurement functions Level Moni- tor, Input Monitor, Freq/Phase Measurement and Waveform can be displayed at the same time.
-
Page 524: Parameter Fields Of The Panel
® Instrument Functions R&S Curve, Spectrum and Bar Graph Display The panel is used to configure the display of a waveform (trace of the signal over time) if Waveform is selected as the additional measurement function in the ana- lyzer panel. ●... - Page 525 ® Instrument Functions R&S Curve, Spectrum and Bar Graph Display A duplicate of this "Show button" can also be found in the Analyzer Function panel so that you can conveniently call up the graphic display for Bar Graph, FFT, or Waveform from there.
- Page 526 ® Instrument Functions R&S Curve, Spectrum and Bar Graph Display Available in the graphics subsystems Sweep If a Z sweep is set in the generator, Scan will automatically be set to Multi, provided that X-Source = Sweep is set in the display panel. Refer also to Chapter 5.51, "Measured value Sequences",...
- Page 527 ® Instrument Functions R&S Curve, Spectrum and Bar Graph Display History Only available if "Scan" is set to "Multi" and therefore only for the graphic systems Sweep Graph 1 to 4. Available in the graphics subsystems Sweep History determines how many scans are stored in the memory or saved in the file. It is not possible to select "1"...
- Page 528 ® Instrument Functions R&S Curve, Spectrum and Bar Graph Display Upon activating this function, the "Channels" parameter field and the option for Trace B disappear in the corresponding Config panel. In the graphical window of the FFT, up to 8 curves are displayed above each other in the same color, in the graphical window of the bar graph display, the bars are shown with a slight offset.
- Page 529 ® Instrument Functions R&S Curve, Spectrum and Bar Graph Display For more information on Y Source, see Chapter 5.51, "Measured value Sequences", on page 601. For displaying the traces, refer also to "X-axis " on page 288. "Off" No trace is displayed or an available trace is deleted. "Funct Chx, Function"...
- Page 530 ® Instrument Functions R&S Curve, Spectrum and Bar Graph Display "Frequency Chx, Frequency" The Frequency measurement result for the additional Freq/Phase measurement function. ● channel 1 or ● channel 2 or ● the channel number specified under the following "Channel" parameter field in the case of a multichannel instrument is displayed as Trace A or Trace B over a basic physical quantity selected under x-axis.
- Page 531 ® Instrument Functions R&S Curve, Spectrum and Bar Graph Display "LevMon Peak Chx, LevMon Peak" The Peak measurement result of the additional LevelMonitor = Peak measurement function for ● channel 1 or ● channel 2 or ● the channel number specified under the following "Channel" parameter field in the case of a multichannel instrument is displayed as Trace A or Trace B over a basic physical quantity selected under x-axis.
- Page 532 ® Instrument Functions R&S Curve, Spectrum and Bar Graph Display "Group Delay" The Group Delay measurement result of the additional measurement function. Freq/Phase = Freq & Grp Del If you are using a multichannel instrument, set the channel reference by means of the following "Channel" parameter field. is displayed as Trace A or Trace B over a basic physical quantity selected under x-axis.
- Page 533 ® Instrument Functions R&S Curve, Spectrum and Bar Graph Display "FFT Phase Chx, FFT Phase" The FFT phase is the phase characteristic versus the frequency of ● channel 1 or ● channel 2 or ● the channel number specified under the following "Channel" parameter field in the case of a multichannel instrument of the FFT or Post FFT analyzer measurement function which is dis- played as Trace A or Trace B over a frequency x-axis.
- Page 534 ® Instrument Functions R&S Curve, Spectrum and Bar Graph Display "FFT Phase Ch2-Ch1, FFT Phase to Refch" The phase difference between the phase characteristic obtained from the calculation of the complex FFT for ● channel 2 and channel 1 ● the channel number specified under the following "Channel"...
- Page 535 ® Instrument Functions R&S Curve, Spectrum and Bar Graph Display Remote command: on page 797 DISPlay:FFT<n2>:A:YSOurce on page 797 DISPlay:FFT<n2>:B:YSOurce Y-Source Waveform graphic system Used to select which measurement results obtained with the additional measurement function Waveform are displayed graphically as TRACE A or as TRACE B and dis- played graphically on the left-hand or right-hand y-axis.
- Page 536 ® Instrument Functions R&S Curve, Spectrum and Bar Graph Display Used to select whether the measurement result for channel 1 or channel 2 obtained with the analyzer measurement function THD, THD+N & SINAD, Mod Dist, and DFD are collected as TRACE A or as TRACE B and displayed graphically on the left-hand or right-hand y-axis.
- Page 537 ® Instrument Functions R&S Curve, Spectrum and Bar Graph Display Remote command: on page 798 DISPlay:SWEep<n2>:A:YSOurce:FILE on page 798 DISPlay:SWEep<n2>:B:YSOurce:FILE Channel Channel number for multichannel instrument For multichannel instruments it is no longer possible to show the source of the mea- surement results and the channel numbers in a combined display, due to the large number of possible combinations in the selection list for the Y-source.
- Page 538 ® Instrument Functions R&S Curve, Spectrum and Bar Graph Display "activated" The contents of the parameter fields for "TRACE A" are transferred to "TRACE B". The parameter fields for "TRACE B" then appear grayed out and cannot be accessed. Setting changes in "TRACE A" are immediately applied to "TRACE B".
- Page 539 ® Instrument Functions R&S Curve, Spectrum and Bar Graph Display "deactivated" A user-definable label appears on the y-axis of the graphical display. Figure 5-25: Here rotated by 90°. Remote command: on page 790 DISPlay:SWEep<n2>:A:LABel:AUTO on page 791 DISPlay:SWEep<n2>:A:LABel:USER on page 790 DISPlay:SWEep<n2>:B:LABel:AUTO on page 791 DISPlay:SWEep<n2>:B:LABel:USER...
- Page 540 ® Instrument Functions R&S Curve, Spectrum and Bar Graph Display The Reference parameter field is hidden if you select the function measurement result with Funct Ch1 | Funct Ch2 | Function under Y-source and if an intermodulation mea- surement is set in the analyzer function panel. Intermodulation measurement results are measurement results that have already been referenced and cannot be referenced again.
- Page 541 ® Instrument Functions R&S Curve, Spectrum and Bar Graph Display "Max " The maximum Y value of the measurement sequence is actuated once as the reference value. The display then returns to Value and the maximum Y value is displayed as the new reference value in the parameter field below.
- Page 542 ® Instrument Functions R&S Curve, Spectrum and Bar Graph Display "Noise Density, Noise Density dB" Noise density measurement. Offered only in the FFT subsystem. If you perform an FFT analysis via a noise signal, the level of a bin will change with respect to its width. The width of a bin, which is also called analysis bandwidth, depends on the FFT size.
- Page 543 ® Instrument Functions R&S Curve, Spectrum and Bar Graph Display Negative reference values < -1.0E-12 are computed using their magnitude, that is, they are made into positive values. As a result, trace displays in the referenced unit dBr, for instance, at a reference value of 0.0 V have very high values for the upper limit, since the trace data is computed internally using the reference value 1.0E‑12.
- Page 544 ® Instrument Functions R&S Curve, Spectrum and Bar Graph Display The "Normalize" parameter field is hidden if you select the function measurement result with Funct Ch1 | Funct Ch2 | Function under Y-source and if an intermodulation measurement is set in the analyzer function panel. Intermodulation measurement results are measurement results that have already been referenced and cannot be ref- erenced again.
- Page 545 ® Instrument Functions R&S Curve, Spectrum and Bar Graph Display Example: In the sweep subsystem, "y-source" is set to "Funct Ch1". In the Analyzer panel, RMS has been set as measurement function for which dBV has been selected as the unit in the Function Config panel. The dBV display unit for the RMS measurement function can be transferred to the Dis- play panel which is indicated by the "Unit Fnct Track"...
- Page 546 ® Instrument Functions R&S Curve, Spectrum and Bar Graph Display "activated" The unit selected in the analyzer is used for the measurement data displayed on the y-axis and for the displayed top, bottom and limit values. It is displayed in gray (cannot be accessed) next to the checkbox and also on the y-axis of the graphical display.
- Page 547 ® Instrument Functions R&S Curve, Spectrum and Bar Graph Display If a logarithmic unit (dBu, dBV, dBr, dBm, dBFS) is selected, or a linear unit in which negative numbers can occur (e.g. ∆V, ∆W), the following parameter field Spacing is displayed as not user-accessible and its parameter is set to Lin since it makes no sense to display measured values with a logarithmic unit or negative values on a loga- rithmically scaled axis.
- Page 548 ® Instrument Functions R&S Curve, Spectrum and Bar Graph Display "deactivated" A user-defined unit label can be entered. Example: The output level U which is output at a sound pressure of 0dBspl 0 dBspl (spl = sound pressure level) is specified for high-quality microphones.
- Page 549 ® Instrument Functions R&S Curve, Spectrum and Bar Graph Display "Auto" Automatic engineering assignment from p to M. The cursor and scal- ing values are displayed with the engineering symbol. The y-axis is labeled with the unit without engineering. "Off" Engineering is deactivated.
- Page 550 ® Instrument Functions R&S Curve, Spectrum and Bar Graph Display For logarithmic units (dB units) and linear units in which negative numbers can occur (e.g. ∆V, ∆W), this parameter field is displayed as not user-accessible and is set to "Lin", since it makes no sense / is not possible to display dB values or negative values logarithmically.
- Page 551 ® Instrument Functions R&S Curve, Spectrum and Bar Graph Display Available in the graphics subsystems Sweep, FFT, Waveform, Bar Graph Remote command: on page 790 DISPlay:SWEep<n2>:A:BOTTom on page 790 DISPlay:SWEep<n2>:B:BOTTom Main Grid Division of the graphical display with horizontal main gridlines. Available in the graphics subsystems Sweep, FFT, Waveform, Bar Graph "Off"...
- Page 552 ® Instrument Functions R&S Curve, Spectrum and Bar Graph Display If, for example, 2 is entered, the y-axis is divided into two sections, i.e. one main grid- line is displayed. Available in the graphics subsystems Sweep, FFT, Waveform, Bar Graph Steps With the setting Spacing = Lin: Used to enter the main gridline step size for a y-axis.
- Page 553 ® Instrument Functions R&S Curve, Spectrum and Bar Graph Display Limit violations are marked by red dots on a curve or by red bars on a bar graph. An additional display in the bottom right corner of the graphical display with an arrow pointing upward marks the overranging of the upper limit or limit line.
- Page 554 ® Instrument Functions R&S Curve, Spectrum and Bar Graph Display "File" Available in the graphics subsystems Sweep, FFT, Waveform, Bar Graph Limits are checked by using a limit file. The name of the limit file is entered in the parameter field below. This limit file contains reference values for a limit curve in a special format (see Chapter 5.54.4, "Limit...
- Page 555 ® Instrument Functions R&S Curve, Spectrum and Bar Graph Display Sweep, FFT, Waveform, Bar Graph Remote command: on page 794 DISPlay:SWEep<n2>:A:LIMUpper:SOURce:VALue on page 794 DISPlay:SWEep<n2>:B:LIMUpper:SOURce:VALue Source Filename File name for an upper limit curve if "File" has been selected under "Source". Available in the graphics subsystems Sweep, FFT, Waveform, Bar Graph Remote command:...
- Page 556 ® Instrument Functions R&S Curve, Spectrum and Bar Graph Display Source Used to determine how the lower limit is set. "Value " Available in the graphics subsystems Sweep, FFT, Waveform, Bar Graph Input of a fixed limit value for the Source = Value setting. In the parameter field below, a lower limit constant for all X values is entered in the unit which has been selected in the Unit Funct Track parameter field.
- Page 557 ® Instrument Functions R&S Curve, Spectrum and Bar Graph Display "File Intern" Available in the graphics subsystems Sweep, FFT, Bar Graph Sweep, FFT, Bar Graph, PESQ/POLQA, Impulse Response Sweep, FFT, Bar Graph "File Intern" has to be offered and displayed only if "File:Trace A or File: Trace B is set at "Y-Source"...
- Page 558 ® Instrument Functions R&S Curve, Spectrum and Bar Graph Display This enables limit lines or limit curves to be shifted according to the parameters in the subsequent parameter fields "Parallel" and "Symmetrical". If the Limit Shift function is enabled without activating limit monitoring, the subsequent parameter fields should be regarded as default settings.
- Page 559 ® Instrument Functions R&S Curve, Spectrum and Bar Graph Display Although a single limit curve may be symmetrically shifted it is not very meaningful, and would be better done using the "Parallel" parameter field. The limit curves that are separated by 40 dBV, such as after loading a file, are in each case to be shifted by 10 dBV and their signs are to be reversed.
- Page 560 ® Instrument Functions R&S Curve, Spectrum and Bar Graph Display "Replace" Replace. The scan (selected using [Next Scan] or by means of the scan num- ber in the graphical display) is replaced by the scan from a measure- ment or from the trace file specified in the "Import from" parameter field below.
- Page 561 ® Instrument Functions R&S Curve, Spectrum and Bar Graph Display "Sweep " The following x-axis parameter field is not available in a sweep that is switched on in the Generator Function panel; as a result, the x-axis in the DispConfig panel sweep is adapted to the x-axis sweep setting in the generator automatically.
- Page 562 ® Instrument Functions R&S Curve, Spectrum and Bar Graph Display "Manual" The following x-axis parameter field is operable and completely inde- pendent of a sweep setting in the generator. It is reserved for the spe- cial case of graphically displaying self-generated or manipulated trace data records that are transferred from the controller via the IEC bus to the R&S UPP.
- Page 563 ® Instrument Functions R&S Curve, Spectrum and Bar Graph Display In contrast, for the graphic subsystem Sweep Graph1 … 4, the functionality of this parameter field is determined by the "X-Source " parameter field above it, which is only offered in the display configuration panel Sweep Graph1 … 4, and by the sweep set- ting of the generator.
- Page 564 ® Instrument Functions R&S Curve, Spectrum and Bar Graph Display "Phase" Depending on the current sweep setting, the x-axis is displayed as the phase axis. Only available if the generator function Stereo Sine is selected. "Voltage Dig" Depending on the current sweep setting in the digital generator instruments, the x-axis is displayed as the digital phase axis.
- Page 565 ® Instrument Functions R&S Curve, Spectrum and Bar Graph Display "Auto" Automatic engineering assignment from p to M. The cursor and scal- ing values are displayed with the engineering symbol. The x-axis is labeled with the unit without engineering. "Off" Engineering is deactivated.
- Page 566 ® Instrument Functions R&S Curve, Spectrum and Bar Graph Display Unit Auto Used to determine whether the unit label displayed on the x-axis is the same as the unit set in the Unit parameter field or whether it can be user-selected. Available in the graphics subsystems Sweep, FFT, Waveform "activated"...
- Page 567 ® Instrument Functions R&S Curve, Spectrum and Bar Graph Display Sweep, FFT, Waveform "Manual" Manual scaling The scaling of a graphical display is determined using the "Left " and "Right " parameter fields below. Each time the "Manual " parameter is set, the graphical display is deleted and then replotted with the scale end values entered under "Left "...
- Page 568 ® Instrument Functions R&S Curve, Spectrum and Bar Graph Display Used to set the right-hand value on the x-axis. This parameter field can only be accessed if "Scaling" = "Manual" is selected. This value must always be higher than the Left value. Negative values or the value 0.0000 are not permitted if "Spacing"...
- Page 569 ® Instrument Functions R&S Curve, Spectrum and Bar Graph Display Used to enter the number of main gridline divisions for an x-axis. If, for example, 2 is entered, the y-axis is divided into two sections, i.e. one main grid- line is displayed. Available in the graphics subsystems Sweep, FFT, Waveform Step...
- Page 570 ® Instrument Functions R&S Curve, Spectrum and Bar Graph Display Show Title, Show Leg A, Show Leg B Permits or prevents the display of free texts in the graphical displays. Available in the graphics subsystems Sweep, FFT, Waveform, Bar Graph "activated"...
- Page 571 ® Instrument Functions R&S Curve, Spectrum and Bar Graph Display Store Trace as This specifies the format in which the current trace is to be stored. Depending on this setting, further command lines for modifying the data set that has to be stored are added or removed.
- Page 572 ® Instrument Functions R&S Curve, Spectrum and Bar Graph Display "DataList Select" The filtered data of a trace is stored complete with all its scans, X and Y data, limit data and reference values. Data filtering is set in the measured value list via softkey menu item "Selection".
- Page 573 ® Instrument Functions R&S Curve, Spectrum and Bar Graph Display Application: Constant (i.e. frequency response independent) power output, preempha- sis/deemphasis. If there is no check in the box, the equalization data set that is acquired corresponds to the frequency response of the DUT. If the DUT is removed and a generator sweep is carried out using this equalization data set, the DUT can be simulated since a frequency response arises as if the DUT were present.
- Page 574 ® Instrument Functions R&S Curve, Spectrum and Bar Graph Display When a limit file is generated, an offset value is added to the Y data. This value is specified in the following parameter field. Offset allows, for example, two limit files to be generated from a "golden unit", together forming a tolerance band, by generating a limit file for Upper Limit with an offset value of say 10 dBV and a limit file for Lower Limit with an offset value of -10 dBV.
- Page 575 ® Instrument Functions R&S Curve, Spectrum and Bar Graph Display "3 dig. / 0.1 dB, 4 dig. / 0.01 dB, 5 dig. / 0.001 dB, 6 dig. / 0.0001 dB, 7 dig. / 0.00001 dB" Significance of the parameter list using an example: 5 dig.
-
Page 576: Softkey Menu
® Instrument Functions R&S Curve, Spectrum and Bar Graph Display 5.46.4 Softkey Menu Using an extensive softkey menu the display can be, among other things, ● automatically scaled (Autoscale) ● expanded (Zoom) ● measured using vertical and horizontal cursors (Cursor) or ●... - Page 577 ® Instrument Functions R&S Curve, Spectrum and Bar Graph Display "Level 1 " "Level 2 " "Level 3 " "Level 4 " Brief description "O Vert A-B " Ditto on Trace A and Trace B and shows dif- ference between Y val- ues.
- Page 578 ® Instrument Functions R&S Curve, Spectrum and Bar Graph Display "Level 1 " "Level 2 " "Level 3 " "Level 4 " Brief description "Next Peak " Movement between par- tial curve peaks "Next Harmonic " FFT display: movement between harmonics "Back "...
- Page 579 ® Instrument Functions R&S Curve, Spectrum and Bar Graph Display "Level 1 " "Level 2 " "Level 3 " "Level 4 " Brief description "Set to Value " Set marker to a value that can be entered later "Track to Max" Set marker to maximum of Trace A.
- Page 580 ® Instrument Functions R&S Curve, Spectrum and Bar Graph Display "Level 1 " "Level 2 " "Level 3 " "Level 4 " Brief description "Betw V Curs " Zooming between two vertical cursors "Betw H Curs " Zooming between two horizontal cursors "Unzoom "...
-
Page 581: Single Scan
® Instrument Functions R&S Curve, Spectrum and Bar Graph Display "Level 1 " "Level 2 " "Level 3 " "Level 4 " Brief description "Lim Viol B " Ditto for Trace B "Lim Viol A+B " Ditto for Trace A and Trace B "Back "... - Page 582 ® Instrument Functions R&S Curve, Spectrum and Bar Graph Display between 2 and 20 in the appropriate configuration panels. In addition the setting produces two further scans in which the Min and Max curves are generated. A trace group with Min/Max curves is shown as the graphical display. All of the recorded measurement sequences are saved (both internally and, if the user requires, as a file) and can be displayed, rescaled and reloaded as a single unit.
- Page 583 ® Instrument Functions R&S Curve, Spectrum and Bar Graph Display If History is set to the maximum value of 20 and "Show Min Max" is activated: a maxi- mum of 44 scans are displayed Trace A Scans Trace A Min trace Trace A Max trace Trace B...
-
Page 584: Interpolation On The Common X-Axis
® Instrument Functions R&S Result List displays for graphic systems that allow multiscan recording (Sweep Graph 1 to 4) the current value, the so-called scan index. Number 0 means the most recent scan. The lower the negative number, the older the scan. Scans identified as Min and Max are available to all graphic systems, provided they are activated. -
Page 585: Graphical Display, Explanation Of The Elements
® Instrument Functions R&S Result List 5.47.1 Graphical Display, Explanation of the Elements 1: Columns with measured values Trace A, Trace B and the associated x-axes are displayed as numeric values in a maximum of four columns. 2: Arrow Colored arrow symbols indicate the direction in which a cursor left the display window. 3: Measured value with limit violation A limit violation, which is identified by red dots / red bars on the traces and bar graphs, is indicated by red measured values in the result list. - Page 586 ® Instrument Functions R&S Result List Pressing the "Find Cursor "softkey adjusts the display window so that the data set appears together with the cursor at the center of the display. 5: Numbering of measured values The individual measured values are numbered consecutively from 1 to n. 6: Scan number If a trace consists of several scans, the desired scan can be selected here by pressing the [Next Scan ] rocker key or using the mouse.
-
Page 587: Calling Up
® Instrument Functions R&S Result List 10: Config Right-clicking anywhere opens a context menu, left-clicking opens the corresponding DispConfig panel. 5.47.2 Calling Up A data list button can be found in the first line of every display configuration panel and can be used to open a measured value list for each graphic system or for addi- tional graphic display. - Page 588 ® Instrument Functions R&S Result List Engineering The measured values for Trace A or Trace B and the values on the x-axis are dis- played with the engineering selected in this parameter field: Unit Auto Used to determine whether the unit label displayed above the measurement result col- umn for Trace A, Trace B or above the values on the x-axis is the same as the unit set in the "Unit Funct Track"...
- Page 589 ® Instrument Functions R&S Result List Used to set the number of digits used to display the measurement results for Trace A and Trace B and the values on the x-axis. Selection Harmonics If harmonics are shown in the graphical display (activated using the softkey menu), a display filter which only shows the values of the harmonics can be applied to the list display by setting "Harmonics "...
-
Page 590: Softkey Menu
® Instrument Functions R&S Numeric display Number 0 means the most recent scan. The lower the negative number, the older the scan. 5.47.4 Softkey Menu Explanation of the individual menu items: Level 1 Level 2 Brief description "Close " Used to close the result list. "Find Cursor "... -
Page 591: Graphical Display, Explanation Of The Elements
® Instrument Functions R&S Numeric display If certain analyzer measurement functions in the Analyzer Function panel are deactiva- ted, the associated measurement results are hidden. The name of the measurement function, however, clearly indicates which column refers to which measurement func- tion. - Page 592 ® Instrument Functions R&S Numeric display 1: Name of measurement function Name of the current measurement function from left to right: Function, Level Monitor, Input Monitor, Freq/Phase If the measurement function is changed in the analyzer panel, the labels here also change.
- Page 593 ® Instrument Functions R&S Numeric display 8: Selection frame If the numeric display has the focus, measurement results can be selected by moving the blue selection frame with the rotary knob or by clicking with the mouse. Double- clicking with the mouse opens the associated combo display (see Chapter 5.49, "Combi Display",...
-
Page 594: Calling Up
® Instrument Functions R&S Combi Display 5.48.2 Calling Up The numeric display field is opened via the menu bar. 5.48.3 Parameter Fields of the Panel The numeric display does not have its own panel; however, a number of settings made in the measurement result configuration panels in the combo displays affect the way in which the measurement results are displayed: Unit... -
Page 595: Graphical Display, Explanation Of The Elements
® Instrument Functions R&S Combi Display 5.49.1 Graphical Display, Explanation of the Elements 1: Measuring function Measuring function in the combo display title field 2: Minimum value / maximum value Highest/lowest value measured since the [START] key was pressed; set with 3: Measurement display Current measured value. - Page 596 ® Instrument Functions R&S Combi Display 6: Lower / Upper Limit Numeric displays of the lower/upper limit specified under If the value changes to red, this means that a violation of the lower/upper limit occurred after [START]. This limit violation is indicated until the hold function is reset by [START] or by entering a new lower/upper limit.
-
Page 597: Calling Up
® Instrument Functions R&S Combi Display 5.49.2 Calling Up There are several ways to open the combo display: ● Open the Display menu. Select the Numeric Display menu item. Double-click the desired measurement result in the numeric display. ● Open the combo display directly via the menu bar. The menus differ slightly in two-channel or multichannel instruments. -
Page 598: Parameter Fields Of The Panel
® Instrument Functions R&S Combi Display measured and how measurement is performed is configured in the analyzer panel. The measurement result configuration panels are opened in the menu. 4 different measurement result configuration panels are available. ● Function Config The panel is used to configure how the measurement results for the analyzer mea- surement function "Function"... - Page 599 ® Instrument Functions R&S Combi Display For the configuration of the measurement result displays of Function, Level Monitor and Input Monitor in the case of multichannel instruments, all channels are config- ured fully identically, therefore, only one column is provided. For two and multichan- nel instruments, the configuration panel of the pure frequency measurement always has one column.
- Page 600 ® Instrument Functions R&S Combi Display For two and multichannel instruments, the configuration panel for the Freq/Phase measurement results in operating mode "Freq & Phase" and "Freq & Grp Del" always features two columns. Display Only for two-channel instruments: Clicking the Show button activates the combo display for a measured value. To close it, provided it has the focus, press [CLOSE] or click the button in the title bar.
- Page 601 ® Instrument Functions R&S Combi Display Unit This parameter field is used to determine the unit in which the measurement results are to be displayed. The parameter list available in this parameter field depends on whether the analog or digital analyzer instrument has been selected and under which of the 4 analyzer mea- surement functions the panel was opened.
- Page 602 ® Instrument Functions R&S Combi Display "deactivated" A user-definable unit label can be entered. Example: The output level U0dBspl which is output at a sound pressure of 0 dBspl (spl = Sound pressure level) is specified for high‑quality microphones. If the measured microphone output level is displayed in the refer- enced unit dBr and entered for the reference value U0dBspl, the level displayed on the R&S UPP will be in dBr, but corresponds to the sound pressure in dBspl.
- Page 603 ® Instrument Functions R&S Combi Display "Off" Engineering is deactivated. Measurement result, limits and Min/Max values are always displayed in the format 1.0 E "µ, m, k" Engineering fixed to µ, m or k. The values to be displayed are multiplied by the factor 1.0 E , 1.0 E or 1.0 E Measurement results, limits and Min/Max values are displayed with...
- Page 604 ® Instrument Functions R&S Combi Display Reference Figure 5-28: Reference menu for two and multichannel instruments Used to select the reference for referenced units for the measurement result. "Value " A numeric value with unit must be entered as the reference value in the parameter field below.
- Page 605 ® Instrument Functions R&S Combi Display "Gen Track" The currently valid and every newly set generator voltage is stored as the reference value and can then be used for referenced display (by all channels). If a referenced unit has been selected in the "Unit" parameter field, the measurement result is referenced to this refer- ence value and displayed.
- Page 606 ® Instrument Functions R&S Combi Display Left Used to set the left-hand value on the bargraph. Negative values or the value 0.00000 are not allowed when "Spacing " "Log ", in which case they cannot be entered. Remote command: on page 808 SENSe<1|2|6>:LEFT on page 806 SENSe3:FREQuency:LEFT...
- Page 607 ® Instrument Functions R&S Combi Display "Divisions" With the setting "Spacing" = "Lin": Preset division of a bargraph with main gridlines. The desired number of divisions is set in the parameter field below. These main gridlines are not hidden if the combo display is reduced in size.
- Page 608 ® Instrument Functions R&S Combi Display "Coarse, Fine " With the setting "Spacing" = "Log": Coarse or fine subdivision of the main gridlines of a logarithmically divided bargraph with subgridlines. Figure 5-29: Coarse: Subgridlines 2 and 5 only Figure 5-30: Fine: All subgridlines Limit Lower Used to activate/deactivate the lower limit check.
- Page 609 ® Instrument Functions R&S Combi Display "activated" The lower limit check is activated. The parameter field below is used to enter a lower limit in the units selected in the Unit parameter field. A lower limit can be defined for the measurement result; every mea- sured value is then compared with this limit.
- Page 610 ® Instrument Functions R&S Combi Display on page 806 SENSe3:FREQuency:LIMLower:VALue SENSe3 = Frequency, phase or group delay measurement on page 810 SENSe3:PHASe:LIMLower on page 810 SENSe3:PHASe:LIMLower:VALue SENSe3 = Frequency, phase or group delay measurement Limit Upper Used to activate/deactivate the upper limit check. User Manual 1411.1055.32 ─...
- Page 611 ® Instrument Functions R&S Combi Display "activated" The upper limit check is activated. The parameter field below is used to enter an upper limit in the unit selected in the Unit parameter field. An upper limit can be defined for the measurement result; every mea- sured value is then compared with this limit.
-
Page 612: Softkey Menu
® Instrument Functions R&S Combi Display on page 806 SENSe3:FREQuency:LIMUpper:VALue SENSe3 = Frequency, phase or group delay measurement on page 810 SENSe3:PHASe:LIMUpper on page 810 SENSe3:PHASe:LIMUpper:VALue SENSe3 = Frequency, phase or group delay measurement Show Min Max Used to activate/deactivate the Min/Max display. Two numeric values and the ends of the blue bar inside the green bar indicate the low- est and highest values measured. -
Page 613: Limit Monitoring
® Instrument Functions R&S Limit Monitoring "Store Reference " The current measured value is stored as a reference value. If, for exam- ple, the reference unit dBr is selected as the unit, the next measured value is 0.0 dBr. "Autoscale " One-time scaling of the bargraph on the basis of the minimum and maxi- mum values. - Page 614 ® Instrument Functions R&S Limit Monitoring Limit entered as a curve: A limit curve can be entered only for the graphic systems Sweep, FFT Function and Bar Graph. A limit curve makes no sense for the Waveform graphic system and is not offered.
- Page 615 ® Instrument Functions R&S Limit Monitoring Each measured value is compared with the limit value or the limit curve and in the event of a limit violation is identified as a red dot in the trace display or as a red bar in the bar graph.
-
Page 616: Measurement Results
® Instrument Functions R&S Limit Monitoring In addition to the red dots in the trace or the red bars in the bar graph, in the lower right corner of the graphic display and the measured value list there is an indicator of limit violations, so that it is possible to see at a glance whether any limit violation exists. -
Page 617: Measured Value Sequences
® Instrument Functions R&S Measured value Sequences A red measured value and bar indicate that there is a limit violation: A red measured value in the numeric display also indicates a current limit violation: In order to indicate that the lower or upper limit was violated in the past, the lower or upper limit is displayed in red until the [START] key is pressed, which resets the hold function and restarts monitoring of the measured values: This hold function is not visible in the numeric display. -
Page 618: Store
® Instrument Functions R&S Store 5.52 Store 5.52.1 Trace Files When a Trace list is saved no distinction is made between Trace A or Trace B. Both traces are always stored to the file, provided that both traces are switched on. In the multiscan mode, all scans selected by means of the "History"... -
Page 619: Sweep Lists
® Instrument Functions R&S Store An equalization list in ASCII format is generated from the current measured value sequence, taking into account the settings made under "Trace ", "Norm Freq ", "Invert " and "Modify Equ. ". The list is stored to a file, which can be loaded by selecting it in the "Equalizer"... -
Page 620: Limit Files
® Instrument Functions R&S Load 5.52.4 Limit Files A Limit list contains X and Y data that has been extracted from the current measured value sequence. When it is saved, no distinction is made about whether the file will be used later as an Upper Limit or as a Lower Limit. - Page 621 ® Instrument Functions R&S Load All trace files have the file name extension *.TRC as a default setting, that is, if the file name only is specified, without an extension, this extension is automatically added. Other extensions are allowed. Clicking on the … button opens the file selector with all known properties.
- Page 622 ® Instrument Functions R&S Load If the file contains both reference traces and limit traces, File Intern is displayed in the corresponding parameter fields. "File Intern" means that there is no individual value (for example in the case of a "Reference", this would be "Limit Upper" or "Limit Lower" with the setting Value) but instead a trace, and that this trace has been taken from a file loaded at Y-Source = File: Trace A or File: Trace B.
- Page 623 ® Instrument Functions R&S Load If Hold is selected in the parameter fields "Reference", "Limit Upper " and/or "Limit Lower ", the current settings remain unchanged and are not altered by loading a trace file. Switching the Y-Source: The display and deletion of traces largely depends on switching the "Y-Source", that is, the source of the traces.
- Page 624 ® Instrument Functions R&S Load Example: Basic unit changes: The RMS measurement function is set in the analyzer. The selected display unit is dBV. "Funct CH1" is set in the Sweep Graph Config panel as the "Y-Source", which means that the results of the RMS measurement are displayed on the y-axis. Also in the analyzer the phase measurement is set with the display unit Rad.
- Page 625 ® Instrument Functions R&S Load "Scan " = Multi If a trace is loaded from a file which contains a multiscan, either all scans are taken from the file or only as many as the number specified in the "History" parameter field. If the file contains only a single scan, this scan is interpreted as a multiscan with only one scan.
- Page 626 ® Instrument Functions R&S Load ● Which scans and how many scans are stored in a file? ● Does the scan from the file suit the current setting? The following section should cover the most important possibilities. 5.53.1.7 Appending Measurement Scans to Existing Scans parameter field "New Scan "...
- Page 627 ® Instrument Functions R&S Load ● If Trace A and Trace B are both activated and the file to be imported contains only one trace, and it does not matter whether it is Trace A or Trace B, this trace is imported to Trace A and Trace B.
-
Page 628: Equalization Files
® Instrument Functions R&S Load ● If Trace A and Trace B are both activated and the file to be imported contains a stereo trace, then both traces are imported, namely A to A and B to B. The following applies to all the cases listed: If the file contains more than one scan a warning is given and the first scan from the file is taken for the Replace function. -
Page 629: Format
® Instrument Functions R&S Format 5.54 Format 5.54.1 Trace Files All trace data is stored in plain text in ASCII format. The format has been selected so that the data can be processed without a problem in EXCEL. Structure of the trace file: The individual parameters are TAB separated. - Page 630 ® Instrument Functions R&S Format User Manual 1411.1055.32 ─ 10...
- Page 631 ® Instrument Functions R&S Format User Manual 1411.1055.32 ─ 10...
- Page 632 ® Instrument Functions R&S Format Example of a trace data set: The trace data set was generated from the FFT Graph subsystem. UPV FFT TRACE FILE Heading String R&S UPP800 Serial no: 123456, 2012/24/5, 9:51:42 X Axis Trace A Trace B Frequency FFT Level Ch1 FFT Level Ch2 Frequency / Hz FFT Level Ch1 / dBV FFT Level Ch2 / V Hz dBV V...
-
Page 633: Equalization Files
® Instrument Functions R&S Format 1.87e+002 -1.01e+002 VOID VOID 1.00e+000 VOID VOID VOID VOID VOID 2.37e+004 -1.36e+002 VOID VOID 1.00e+000 VOID VOID VOID VOID VOID 2.38e+004 -1.37e+002 VOID VOID 1.00e+000 VOID VOID VOID VOID VOID 2.39e+004 -1.34e+002 VOID VOID 1.00e+000 VOID VOID VOID VOID VOID The individual parameters are stored in the original with a considerably greater number of points. -
Page 634: Sweep Lists
® Instrument Functions R&S Format Normalization frequency A comment which states the frequency whose voltage value has been used for normalization. Normalization value A comment which states the normalization value with which the Y values were computed as factors. X/Y pairs Frequency value in Hz followed by the normalization factor. -
Page 635: Limit Files
® Instrument Functions R&S Format Table 5-11: Explanation of terms: Identifier Identifies the file as a sweep list. During loading this identification is used to decide whether the file concerned can be loaded. Number of following X Self-explanatory values Basic unit The X values in the sweep list are always stored in the basic unit. - Page 636 ® Instrument Functions R&S Format Black: Explanation of fields. These explanations are not stored in the sweep list. Green: Fixed entries in ASCII format. Red: Entries which change depending on the settings in the corresponding DispConfig panel. Table 5-12: Explanation of terms: Identifier Identifies the file as a limit file.
-
Page 637: Editing
® Instrument Functions R&S Editing If a data set is subsequently edited manually, comment lines (which can be identified by a '#' at the beginning of the line) can be inserted at any position ahead of the X/Y pairs. A data set must never be interrupted by comments. 5.55 Editing The editing of trace files, equalization files, sweep lists and limit files is always carried out in the same way and is illustrated by two examples. - Page 638 ® Instrument Functions R&S Editing However, the limit curve derived from a measured value sequence is unsuitable as the upper limit of a tolerance band, since horizontal lines should appear to left and right of the passband in the bandpass display. This makes it necessary to modify the limit file. For this purpose, the file named LH_30_up.lim is loaded into an ASCII editor, such as the Windows Editor, which is present as an accessory on every Windows operating system for the R&S UPP.
- Page 639 ® Instrument Functions R&S Editing When altering the number of X/Y values it is important to make sure that the Datacount entry is adapted accordingly. The identifier UPV LIMIT FILE must not be changed. If the tabulator (TAB) is used as a separator between various entries in a line, the file can be processed in EXCEL without any problem.
- Page 640 ® Instrument Functions R&S Editing The data sets are displayed in abbreviated form. Explanation of the changes: User Manual 1411.1055.32 ─ 10...
- Page 641 ® Instrument Functions R&S Editing In order to make the changes, the waveform trace file (e.g. mywav.trc) is loaded into an ASCII editor, such as the Windows Editor, which is present as an accessory on every Windows operating system for the R&S UPP. The editor displays a data set as shown in the left column above.
-
Page 642: Export
® Instrument Functions R&S Export 5.56 Export The most frequent reason for needing to export trace files, equalization files, sweep lists and limit files is without doubt so that they can be further processed in Microsoft Excel. The procedure is explained in broad terms in the following example. The examples are really intended for the trained user. - Page 643 ® Instrument Functions R&S Export This conversion ensures that in Excel the decimal separator within numbers is interpre- ted as the decimal point. Since the R&S UPP is delivered with an English-language operating system for Eng- lish-speaking regions, the trace files are generated within the R&S UPP exclusively in the English number format (decimal point rather than decimal comma) and can there- fore be processed in Excel without the slightest need for post-processing.
- Page 644 ® Instrument Functions R&S Export Select the file that is to be exported. A dialog box opens in which no changes must be made if "Start / Control Panel / Regional and Language Options" is set to the condition as supplied to the customer "English (United Kingdom)".
-
Page 645: Loading And Saving
® Instrument Functions R&S Loading and Saving If the Language Option is changed, an adaptation of the "Decimal separator" and the "Thousands separator" is necessary, to be configured under Text Import Wizard - Step 3 of 3, "Advanced ..." button. To obtain an EXCEL file that is similar to the original Trace file, we recommend format- ing all cells with "Scientific"... -
Page 646: Loading And Saving Setups
® Instrument Functions R&S Printing and Saving 5.58 Loading and Saving Setups Setups can be loaded and saved at any time. Loading and saving setups is performed through the menu bar and button "File ". [ALT + L ] for LOAD and [ALT + S ] for SAVE also trigger these functions. -
Page 647: Configuring Print And Save Operations
® Instrument Functions R&S Printing and Saving printing only one graphic, for example. For this purpose, printout of a graphical window is to be selected. 5.59.1.2 Printing Graphical Windows On a printer, graphical windows are printed as vector graphics. The printout is per- formed at maximum printer resolution. - Page 648 ® Instrument Functions R&S Printing and Saving ● frame ● lines ● traces ● limit curves ● cursors Using graphic profile files (*.gpf), it is possible to define these properties independently ● screen display ● printer ● file ● clipboard 5.59.4.1 Selecting Graphic Profile Files The files are selected in "Utilities"...
- Page 649 ® Instrument Functions R&S Printing and Saving If the message appears, none of the graphical windows has the focus. Clicking opens a drop‑down menu that can be used to create a new profile file, load an existing profile file or save the current profile file. User Manual 1411.1055.32 ─...
- Page 650 ® Instrument Functions R&S Printing and Saving If an existing graphic profile file is loaded, its properties are displayed in the Profile Edi- tor. A very colorful example: The following example would be more suitable for output on a printer: User Manual 1411.1055.32 ─...
- Page 651 ® Instrument Functions R&S Printing and Saving Select the property which is to be changed. Color opens User Manual 1411.1055.32 ─ 10...
- Page 652 ® Instrument Functions R&S Printing and Saving To change the line type or thickness of a curve, select "Scan Line Style" or "Scan Line Width". The Profile Editor changes as follows: For these properties, the desired trace and scan must be selected. With Scan 0, the property is set for the current curve.
- Page 653 ® Instrument Functions R&S Printing and Saving A number of predefined *.gpf files can be created for various applications. 5.59.4.3 Print Preview opens with the settings of the printer file which is selected in the Config Panel. User Manual 1411.1055.32 ─ 10...
-
Page 654: Remote Control - Fundamentals
® Remote Control - Fundamentals R&S Remote Control - Fundamentals 6 Remote Control - Fundamentals 6.1 Remote Control - Fundamentals 6.1.1 Introduction - Remote Control Fundamentals In this chapter you will find: ● instructions on starting the Audio Analyzer R&S UPP by remote control, ●... -
Page 655: Brief Instructions
® Remote Control - Fundamentals R&S Brief Instructions For the purposes of this chapter it is assumed that you are familiar with the program- ming and operation of the controller. Refer to the appropriate manuals for details of the interface commands. The requirements of the SCPI standard in terms of command syntax, error handling and configuration of status registers are explained in detail in the respective sections. -
Page 656: Changing To Remote Control
® Remote Control - Fundamentals R&S Changing to Remote Control If a monitor, an external keyboard and a mouse are connected, return to manual con- trol: press key CTRL+F11. 6.3 Changing to Remote Control After powering on, the instrument is always in manual control status (LOCAL) and can be controlled from an external monitor, external keyboard and mouse. -
Page 657: Remote Control Via Lan Interface
® Remote Control - Fundamentals R&S Changing to Remote Control Addresses from 1 to 30 are permissible. After setting a new address, the device status of the R&S UPP is saved with the new address. This prevents the R&S UPP from „for- getting"... - Page 658 ® Remote Control - Fundamentals R&S Changing to Remote Control Possible damage of an unprotected controller Reactivate the Windows firewall after you terminate VISA Remote Control setting "On (recommended)"), to protect the instrument from users and programs that can access a computer via the network.
- Page 659 ® Remote Control - Fundamentals R&S Changing to Remote Control Replace ipaddr by the IP address or the computer name of the instrument. For instance, if the instrument has the IP address 192.1.2.3, TCPIP:: 192.1.2.3::inst0::INSTR is the valid resource name. The specification of inst0 in the resource name is optional and may be omitted.
- Page 660 ® Remote Control - Fundamentals R&S Changing to Remote Control ● Press the "Test" button. A message indicates whether the connection to the R&S UPP can be set up or not. If a connection cannot be set up, check whether the controller and the instrument are connected to the network (network cable) and powered on.
- Page 661 ® Remote Control - Fundamentals R&S Changing to Remote Control ● Press the "Next" and then the "Finish" button. The instrument is now configured in the program and can be addressed by the resource name or alias. Starting the "Measurement & Automation Control" program for remote control of the R&S UPP.
-
Page 662: Remote Control Via The Usb Device Interface
® Remote Control - Fundamentals R&S Changing to Remote Control ● On the "viWrite" tab in the "Basic I/O" panel, commands can be sent to the instru- ment; instrument responses are displayed on the viRead tab (for further program operation refer to the online help). Returning to manual control is possible from the front panel or on the LAN interface. - Page 663 ® Remote Control - Fundamentals R&S Changing to Remote Control USB::0x0AAD::0x004D::serialnum::INSTR Here serialnum must be replaced by the serial number of the instrument. For exam- ple, if the serial number of the instrument is 100534, the valid resource name is USB:: 0x0AAD::0x004D::100534.
-
Page 664: Messages
® Remote Control - Fundamentals R&S Messages ● Select the "Read" tab and press the "Execute" button. If the link is working properly, the identification string of the R&S UPP will be displayed here. 6.4 Messages The messages transmitted on the data lines of the IEC/IEEE bus or on a TCP/IP net- work can be divided into two groups: ●... -
Page 665: Device-Dependent Messages
® Remote Control - Fundamentals R&S Messages the instrument and can only be sent by a controller which has controller functionality on the IEC/IEEE bus. Interface messages can be further classified as ● – Universal commands ● – Addressed commands Universal commands affect all devices connected to the IEC/IEEE bus without requir- ing an address, whereas addressed commands only affect devices addressed as a lis- tener. -
Page 666: Scpi Command Structure And Syntax
® Remote Control - Fundamentals R&S SCPI Command Structure and Syntax Common Commands are precisely defined by the IEEE 488.2 standard in function and notation. They relate to functions such as the management of standard status reg- isters, reset and self-test. Device-specific commands relate to functions that depend on device charac- teristics such as the frequency setting. - Page 667 ® Remote Control - Fundamentals R&S SCPI Command Structure and Syntax Example: SOURce This keyword identifies the SOURce command system. For commands at lower levels the whole path has to be stated. This starts left with the highest level, and the individual keywords are separated by a colon ":". Example: SOURce:VOLTage:OFFSet:STATe ON This command is on the fourth level of the SOURce system.
- Page 668 ® Remote Control - Fundamentals R&S SCPI Command Structure and Syntax Command level: Some keywords appear at several levels within a command system. Their effect then depends on the command structure, i.e. where they are inserted in the command header. Example: SOURce:VOLTage:REFerence 1 V This command contains the keyword REFerence in the third command level.
-
Page 669: Structure Of A Program Message
® Remote Control - Fundamentals R&S SCPI Command Structure and Syntax Parameter: Parameters must be separated from the header by a "white space". If a command con- tains several parameters, they are separated by a comma. Example: OUTPut:SAMPle:FREQuency 48000 HZ TRACe:SWE:STORe:AX 1.1,1.2,1.3,1.4 Numeric suffix: If an instrument has several identical functions or features, e.g. -
Page 670: Parameter
® Remote Control - Fundamentals R&S SCPI Command Structure and Syntax The commands with which measurement results are read out have a special status. A question mark extended with MIN and MAX indicates the minimum and maximum measured value shown in the combo display above the measured value. If the MIN and MAX extension is used on text parameters, strings and query only com- mands which do not retrieve measured values a timeout occurs, followed by an error message in the error queue. -
Page 671: Overview Of Syntax Elements
® Remote Control - Fundamentals R&S SCPI Command Structure and Syntax Numeric values Numeric values may be entered in any customary form, i.e. with sign, decimal point and exponent. The range of values is -9.9E37 to 9.9E37. The exponent is denoted by "E"... -
Page 672: Device Model And Command Processing
® Remote Control - Fundamentals R&S Device Model and Command Processing 6.6 Device Model and Command Processing The device model shown in the following figure was created from the point of view of processing SCPI commands. The individual components operate independently of each other and simultaneously. -
Page 673: Input Unit
® Remote Control - Fundamentals R&S Device Model and Command Processing Figure 6-2: Device model for remote control via IEC/IEEE bus or TCP/IP network 6.6.1 Input Unit The input unit receives commands in the form of characters from the IEC/IEEE bus or Ethernet and collects them in the input buffer. -
Page 674: Database And Device Hardware
® Remote Control - Fundamentals R&S Device Model and Command Processing Syntax errors are recognized by the parser and forwarded to the status reporting sys- tem. The remainder of a program message after a syntax error is, in as much as possi- ble, further analyzed and processed. -
Page 675: Status Reporting System
® Remote Control - Fundamentals R&S Device Model and Command Processing ● To be able to preset individual parameters of functions that are not yet active, each IEC/IEEE bus command would have to be told to which instrument and which func- tion it refers. -
Page 676: Output Unit
® Remote Control - Fundamentals R&S Device Model and Command Processing 6.6.6 Output Unit The output unit collects the information requested by the controller and which it obtains from database administration. It processes the information in line with SCPI rules and makes it available in the output buffer. -
Page 677: Command Recording
® Remote Control - Fundamentals R&S Command Recording In remote control of the R&S UPP it is essential to wait for the end of a measurement or sweep before the measured results are fetched and the hardware is newly set. The following table explains the effect of different combinations of measurement or sweep triggering in conjunction with a synchronization command. -
Page 678: Starting Recording
® Remote Control - Fundamentals R&S Command Recording In this way it is very easy to produce the matching IEC/IEEE bus control program from a manual control sequence without having to look up the commands in the manual. This also eliminates malfunctions through the wrong notation. From the Config Panel (Menu * Utilities * Config Panel), you can select whether to use the short or long form of the command parameters when querying parameters. -
Page 679: Editing Commands
® Remote Control - Fundamentals R&S Status Reporting System 6.7.3 Editing Commands The contents of the SCPI Recording window can be edited and copied through the clip- board into a file. From the commands in this file it is possible to generate an IEC/IEEE bus control program. -
Page 680: Structure Of Scpi Status Register
® Remote Control - Fundamentals R&S Status Reporting System Tus:QUEStionable:MEASuring, which contain more detailed information about the instrument. The status reporting system also includes the IST (Individual STatus) flag and the Par- allel Poll Enable (PPE) register assigned to it. The IST flag, like the SRQ, combines the complete device status in a single bit. - Page 681 ® Remote Control - Fundamentals R&S Status Reporting System The Positive-TRansition part acts as an transition filter. On transition of a bit of the CONDition part from 0 to 1, the associated PTR bit, decides whether the EVENt bit is set to 1. –...
-
Page 682: Overview Of Status Registers
® Remote Control - Fundamentals R&S Status Reporting System 6.8.2 Overview of Status Registers Figure 6-4: Overview of Status Registers User Manual 1411.1055.32 ─ 10... -
Page 683: Status Byte (Stb) And Service Request Enable (Sre) Register
® Remote Control - Fundamentals R&S Status Reporting System The changes for the status registers for the cascading operating mode are minor, see also Chapter 8.7.3.4, "Cascading and Status System", on page 872. 6.8.3 Status Byte (STB) and Service Request Enable (SRE) Register The STB is already defined in IEEE 488.2. -
Page 684: Ist Flag And Parallel Poll Enable (Ppe) Register
® Remote Control - Fundamentals R&S Status Reporting System Bit no. Meaning QUEStionable status summary bit This bit is set if an EVENt bit is set in the QUEStionable status register and the associated ENABLe bit is set to 1. A set bit denotes a questionable device status, which can be specified more precisely by query- ing the QUEStionable status register with STATus:QUEStionable:CONDition? or STATus:QUEStionable[:EVENt]?. -
Page 685: Status:operation Register
® Remote Control - Fundamentals R&S Status Reporting System Bit no. Meaning Command error This bit is set if an undefined command or a command with incorrect syntax is received. An error message describing the error more precisely is entered in the error queue. - Page 686 ® Remote Control - Fundamentals R&S Status Reporting System Bit no. Meaning Measuring status Together with bit 4, this bit results in the following statuses: Bit 4, 10 0 0 = Measuring Terminated Single measurement completed 0 1 = Measuring Stopped Measurement has been stopped 1 0 = Measuring Single Single measurement in progress...
-
Page 687: Status:questionable Register
® Remote Control - Fundamentals R&S Status Reporting System Bit no. Meaning Measuring Ch2 (bit 1) = Not used = The information refers only to channel 2 = The information refers only to channel 1 = The information refers to both channels Sweeping This bit is set while the R&S UPP is performing a sweep. -
Page 688: Status:questionable:underrange Register
® Remote Control - Fundamentals R&S Status Reporting System Bit no. Meaning Not used Not used Not used Not used Not used Summary of multichannel UNDerrange for multichannel operation Summary bit for the lower-order STATus:QUEStionable:UNDERrange register, which makes the underrange information for the individual channels available during multichannel operation. Summary of multichannel OVERerrange for multichannel operation Summary bit for the lower-order STATus:QUEStionable:OVERrange register, which makes the... -
Page 689: Status:questionable:overrange Register
® Remote Control - Fundamentals R&S Status Reporting System Bit No. Meaning 1 = The channel in question is underranged; the measurement result is inaccurate and no longer in line with the specifications of the R&S UPP. The associated summary bit is in the STATus:QUEStionable register bit 2 6.8.9 STATus:QUEStionable:OVERrange Register This register only contains overrange information concerning the individual channels of multichannel operation. -
Page 690: Status:questionable:measuring Register
® Remote Control - Fundamentals R&S Status Reporting System Bit No. Meaning 6.8.10 STATus:QUEStionable:MEASuring Register This register only contains information which channels are switched on or off for multi- channel operation. It can be read by the query STATus:QUEStionable:MEASuring:CONDition? or STATus:QUEStionable:MEASuring[:EVENt]? Reading the EVENt part deletes its content! Table 6-8: STATus:QUEStionable:MEASuring Register... -
Page 691: Status:xquestionable Register
® Remote Control - Fundamentals R&S Status Reporting System 6.8.11 STATus:XQUEstionable Register This register contains extra information to the status operation register and seldom occurring status information. It can be read by the query STATus:XQUEStionable:CONDition? or STATus:XQUEStionable[:EVENt]? Reading the EVENt part deletes its content! Bit no. - Page 692 ® Remote Control - Fundamentals R&S Status Reporting System gram can respond by suitable actions. As seen in section Chapter 6.8.2, "Overview of Status Registers", on page 666, an SRQ is always triggered when one or more of the bits 1, 2, 3, 4, 5 or 7 of the status byte are set and enabled in the SRE. Each of these bits combines the information from another register, from the error queue or the output buffer.
- Page 693 ® Remote Control - Fundamentals R&S Status Reporting System EventList.AddItem "ESR register is: " + Left(Response, ibcntl - 1) DoEvents End Sub 'SRQ subroutine in case RQS was set Private Sub GPIB_Notify(ByVal LocalUPV As Long, ByVal LocalIbsta As Long, ByVal LocalIberr As Long, ByVal LocalIbcntl As Long, RearmMask As Long) Call ibrsp(UPV, Info): 'do a serial poll and read STB...
- Page 694 ® Remote Control - Fundamentals R&S Status Reporting System DoEvents EventList.AddItem "sending INIT command ..." DoEvents StartT = Timer Call ibwrt(UPV, "INIT;*OPC") 'trigger measurement, rise OPC when ready EventList.AddItem "waiting for SRQ ..." EventList.AddItem "------------------------------------------------------" DoEvents 'here the program could do anything else until a SRQ is set End Sub 6.8.12.3 Parallel Poll...
-
Page 695: Initializing The Status Reporting System
® Remote Control - Fundamentals R&S Status Reporting System 6.8.12.5 Error Queue Query Each error in the device causes an entry in the error queue. The entries in the error queue are detailed error messages in plain text that can be read out on the IEC/IEEE bus or LAN/USB by the query SYSTem:ERRor?. -
Page 696: Remote Control - Command Description
® Remote Control - Command Description R&S 7 Remote Control - Command Description The description of each manual setting in Chapter 5, "Instrument Functions", on page 195 also shows the associated remote command. The meaning of the param- eter setting fields and the effect of the individual parameters are explained in detail. A link to the command description including the parameters is provided for each setting. -
Page 697: Notation Of Device-Specific Commands
® Remote Control - Command Description R&S Notation of Device-Specific Commands 7.1 Notation of Device-Specific Commands Long and short form The mnemonics feature a long form and a short form. The short form is marked by upper case letters, the long form corresponds to the complete word. Either the short form or the long form can be entered;... -
Page 698: Scpi Parameters
® Remote Control - Command Description R&S Notation of Device-Specific Commands Example: Definition: OUTPut:AUDiobits <audiobits> Command: OUTP:AUD 24 Special characters A vertical bar in parameter definitions indicates alternative possibilities in the sense of "or". The effect of the command differs, depending on which parameter is used. Example: Definition: OUTPut:TYPE <type>... - Page 699 ® Remote Control - Command Description R&S Notation of Device-Specific Commands 7.1.1.2 Units For physical quantities, the unit can be entered. Allowed units depend on the command used: ● k or K (kilo) ● m or M (milli) ● u or U (micro) If the unit is missing, the basic unit is used.
-
Page 700: Common Commands
® Remote Control - Command Description R&S Common Commands 7.1.1.5 Text parameters Text parameters observe the syntactic rules for mnemonics, i.e. they can be entered using a short or long form. Like any parameter, they have to be separated from the header by a white space. - Page 701 ® Remote Control - Command Description R&S Common Commands ● on page 687 *RST ● on page 687 *SRE ● on page 687 *STB? ● on page 687 *TRG ● on page 688 *WAI *CLS CLEAR STATUS sets the status byte (STB), the standard event register (ESR) and the EVENt part of all QUEStionable and the OPERation register to zero.
- Page 702 ® Remote Control - Command Description R&S Common Commands Example: Return values Rohde&Schwarz,UPP800,1411.1003k08/180132,3.1.18.24-4.0.3 Rohde&Schwarz, UPP = instrument type 1411.1003k08/180132 = part number/serial number 3.1.18.24 = COMPASS version 4.0.3 = R&S UPP firmware version Usage: Query only *IST? <StatusBit> INDIVIDUAL STATUS QUERY returns the contents of the IST flag in decimal form. The IST flag is the status bit which is sent during a parallel poll (see also Chapter 6.8, "Status Reporting...
- Page 703 ® Remote Control - Command Description R&S Common Commands *PSC <Function> POWER ON STATUS CLEAR determines whether the contents of the ENABle regis- ters are preserved or reset during power-up. The query form *PSC? reads out the contents of the power-on-status-clear flag. The response can be 0 or 1.
-
Page 704: Generator Settings
® Remote Control - Command Description R&S Generator Settings *WAI WAIT-to-CONTINUE permits servicing of subsequent commands only after all preced- ing commands have been executed and all signals have settled (see also Chapter 6.6, "Device Model and Command Processing", on page 656). 7.3 Generator Settings The generator settings commands are described in the following sequence: 1. -
Page 705: Configuring The Generators
® Remote Control - Command Description R&S Generator Settings 7.3.2 Configuring the Generators The generator settings are performed in the OUTPut and SOURce sub systems. 7.3.2.1 Reference Level and Frequency Common generator commands concern the setting of the reference level and fre- quency. - Page 706 ® Remote Control - Command Description R&S Generator Settings OUTPut:CHANnel <channel> Parameters: <channel> OFF | CH1 | CH2 | CH2Is1 | | MULTi Manual operation: "Channel" on page 196 "Channel" on page 205 "Channel" on page 213 "Channel" on page 227 OUTPut:IMPedance <impedance>...
- Page 707 ® Remote Control - Command Description R&S Generator Settings ● on page 690 OUTPut:CHANnel ● on page 691 OUTPut:SAMPle:MODE ● on page 691 OUTPut:SIGNal:BALanced:LEVel ● on page 691 OUTPut:SIGNal:LEVel ● on page 691 SOURce:SYNC:INPut ● on page 692 SOURce:SYNC:TERMination ● on page 692 SOURce:SYNC:TO OUTPut:AUDiobits <audiobits>...
- Page 708 ® Remote Control - Command Description R&S Generator Settings Manual operation: "Sync Input" on page 207 SOURce:SYNC:TERMination <termination> Parameters: <termination> R75 | RHIGH Manual operation: "Termination" on page 207 SOURce:SYNC:TO <syncto> Parameters: <syncto> Digital generator: INTClock | GCLock | EDARs | ECLK | EICLk I2S generator: INTern | EXTMasterclock | EXTWordclock HDMI generator:...
- Page 709 ® Remote Control - Command Description R&S Generator Settings Usage: Query only Manual operation: "BClk Freq" on page 215 OUTPut:FBIT <fbit> Parameters: <fbit> MSB | LSB Manual operation: "First Bit" on page 216 OUTPut:FORMat <format> Parameters: <format> SI2S | USERdefined Manual operation: "Format"...
- Page 710 ® Remote Control - Command Description R&S Generator Settings OUTPut:MCLKratio <mclkratio> Parameters: <mclkratio> M64 | M96 | M128 | M192 | M256 | M384 | M512 Manual operation: "MClk Ratio" on page 216 OUTPut:POLarity <polarity> Parameters: <polarity> LFTLow | NEGative | LFTHigh | POSitive Manual operation: "Fsync Polarity"...
- Page 711 ® Remote Control - Command Description R&S Generator Settings ● on page 695 SOURce:HDMI:SARC ● on page 695 SOURce:HDMI:VIDeo:COLor:DEPTh ● on page 695 SOURce:HDMI:VIDeo:CONTent ● on page 695 SOURce:HDMI:VIDeo:FORMat? ● on page 696 SOURce:HDMI:VIDeo:FREQuency ● on page 696 SOURce:HDMI:VIDeo:RESolution ● on page 696 SOURce:HDMI:VIDeo:SOURce ●...
-
Page 712: Generator Signals
® Remote Control - Command Description R&S Generator Settings SOURce:HDMI:VIDeo:FREQuency <frequency> Parameters: <frequency> HZ23 | HZ24 | HZ25 | HZ29 | HZ30 | HZ50 | HZ59 | HZ60 | HZ100 | HZ119 | HZ120 Manual operation: "Format Freq" on page 223 SOURce:HDMI:VIDeo:RESolution <resolution>... - Page 713 ® Remote Control - Command Description R&S Generator Settings ● on page 703 SOURce:VOLTage:SELect MMEMory:LOAD:OEQualize <oequalize> Parameters: <oequalize> string 'filename' Manual operation: "Equalizer / Equalizer Ch1" on page 238 "Equalizer" on page 244 "Equalizer" on page 249 "Equalizer" on page 254 "Equalizer"...
- Page 714 ® Remote Control - Command Description R&S Generator Settings Manual operation: "Function" on page 233 "Function" on page 235 "Function" on page 240 "Function" on page 243 "Function" on page 245 "Function" on page 247 "Function" on page 250 "Function" on page 255 "Function"...
- Page 715 ® Remote Control - Command Description R&S Generator Settings SOURce:VOLTage<n2> <voltage> Suffix: <n2> For Multisine generator signals, the suffix selects one of the sin- ewave 1 to 32 . For Modulation, suffix 1 or no suffix selects the modulation devi- ation or depth and suffix 2 the carrier voltage.
- Page 716 ® Remote Control - Command Description R&S Generator Settings Manual operation: "DC Offset" on page 235 "Offset Ch1" on page 239 "DC Offset" on page 242 "DC Offset" on page 244 "DC Offset" on page 246 "DC Offset" on page 249 "DC Offset"...
- Page 717 ® Remote Control - Command Description R&S Generator Settings ● on page 698 SOURce:SINusoid:DITHer:STATe ● on page 777 SOURce:STEReo<n2>:FILTer ● on page 699 SOURce:VOLTage<n2> ● on page 702 SOURce:VOLTage:CH2Stereo ● on page 699 SOURce:VOLTage:EQUalize ● on page 702 SOURce:VOLTage:EQUalize:CHANnels ● on page 699 SOURce:VOLTage:OFFSet<n3>...
- Page 718 ® Remote Control - Command Description R&S Generator Settings SOURce:PHASe<n2> <phase> Suffix: <n2> 1...32 The suffix selects one of the sinewave 1 to 32 for Multisine gen- erator signal. For all other generator signals, the suffix is irrelevant and must be omitted.
- Page 719 ® Remote Control - Command Description R&S Generator Settings SOURce:VOLTage:SELect <select> Parameters: <select> VLRT | VLVL Manual operation: "Volt Mode" on page 236 "Volt Mode" on page 261 SOURce:VOLTage:STEReo<n3>:EQUalize <equalize> Suffix: <n3> 1 | 2 stereo channel 1 or 2 Parameters: <equalize>...
- Page 720 ® Remote Control - Command Description R&S Generator Settings SOURce:MULTisine:COUNt <count> Parameters: <count> integer Manual operation: "No of Sine" on page 241 SOURce:RANDom:SPACing:FREQuency <frequency> Parameters: <frequency> float Manual operation: "Spacing" on page 240 "Spacing" on page 252 SOURce:RANDom:SPACing:MODE <mode> Parameters: <mode>...
- Page 721 ® Remote Control - Command Description R&S Generator Settings Manual operation: "Total Peak" on page 241 "Total Voltage" on page 246 "Total Voltage" on page 248 "Volt Peak" on page 253 "Volt Peak" on page 256 "Total Peak" on page 263 "Voltage"...
- Page 722 ® Remote Control - Command Description R&S Generator Settings SOURce:ONTime:DELay <delay> Parameters: <delay> float Manual operation: "Burst on Delay" on page 244 7.3.3.5 Mod Dist ● on page 776 SOURce:FILTer ● on page 697 SOURce:FREQuency<n2> ● on page 697 SOURce:FUNCtion ●...
- Page 723 ® Remote Control - Command Description R&S Generator Settings SOURce:FREQuency:MEAN <mean> Parameters: <mean> float Manual operation: "Mean Freq" on page 248 "Mean Freq" on page 253 7.3.3.7 Random ● on page 708 MMEMory:LOAD:ARBitrary ● on page 697 MMEMory:LOAD:OEQualize ● on page 776 SOURce:FILTer ●...
- Page 724 ® Remote Control - Command Description R&S Generator Settings 7.3.3.8 Arbitrary ● on page 708 MMEMory:LOAD:ARBitrary ● on page 776 SOURce:FILTer ● on page 697 SOURce:FUNCtion ● on page 699 SOURce:VOLTage:OFFSet<n3> ● on page 700 SOURce:VOLTage:OFFSet<n3>:STATe ● on page 704 SOURce:VOLTage:RMS ●...
- Page 725 ® Remote Control - Command Description R&S Generator Settings SOURce:PLAY:MODE <mode> Parameters: <mode> TOCont | TOSingle | TICont | TISingle Manual operation: "Play Mode" on page 260 "Play Mode" on page 265 SOURce:PLAY:MUTing <muting> Parameters: <muting> OFF | AFTermeas Manual operation: "Muting"...
- Page 726 ® Remote Control - Command Description R&S Generator Settings ● on page 704 SOURce:VOLTage:TOTal 7.3.3.12 Universal ● on page 697 MMEMory:LOAD:OEQualize ● on page 711 MMEMory:LOAD:MCHannel<n3>:SINE:ARBitrary ● on page 711 MMEMory:LOAD:MCHannel<n3>:SINE:EQUalize ● on page 711 SOURce:ACHSine:FREQuency ● on page 711 SOURce:ACHSine:STATe ●...
- Page 727 ® Remote Control - Command Description R&S Generator Settings ● on page 699 SOURce:VOLTage:EQUalize MMEMory:LOAD:MCHannel<n3>:SINE:ARBitrary <arbitrary> Suffix: <n3> 1 to 10 <n3> = 1 to 8 either when option R&S UPP-B4 is implemented and the I S generator is selected, or when the HDMI generator with audio format "PCM 8 Ch Layer 1"...
- Page 728 ® Remote Control - Command Description R&S Generator Settings SOURce:ACHSine:VOLTage <voltage> Parameters: <voltage> float Manual operation: "Voltage" on page 272 SOURce:ARBitrary:MODE <mode> Parameters: <mode> TOCont | TIMManual Manual operation: "Arbitrary Mode" on page 270 SOURce:ARBitrary:RELoad <state> Parameters: <state> ONCE | EXEC Manual operation: "Reload"...
- Page 729 ® Remote Control - Command Description R&S Generator Settings Parameters: <state> integer ON | OFF Manual operation: "All Chan Sine" on page 276 "Gain" on page 276 SOURce:MCHannel<n2>:GAIN <gain> Parameters: <gain> float Manual operation: "All Chan Sine" on page 276 "Gain"...
- Page 730 ® Remote Control - Command Description R&S Generator Settings SOURce:MCHannel<n2>:SINE:FREQuency <frequency> Parameters: <frequency> float Manual operation: "Frequency" on page 274 SOURce:MCHannel<n2>:SINE:OFFSet:STATe <state> Parameters: <state> ON | OFF Manual operation: "DC Offset" on page 274 SOURce:MCHannel<n2>:SINE:OFFSet:VOLTage <voltage> Parameters: <voltage> float Manual operation: "DC Offset"...
-
Page 731: Digital Audio Protocol Generator
® Remote Control - Command Description R&S Generator Settings SOURce:SCHSettings:CHANnel <channel> Parameters: <channel> integer Manual operation: "Channel" on page 273 SOURce:SCHSettings:TTOChannels <ttochannels> Parameters: <ttochannels> ON | OFF Manual operation: "Track to other channels" on page 273 7.3.4 Digital Audio Protocol Generator The Digital Audio Protocol Generator requires option R&S UPP-K21. - Page 732 ® Remote Control - Command Description R&S Generator Settings <n4> byte 0 to 4 Parameters: <byte> 0 to 255 decimal bit equivalent Example: SOUR:PROT:CH:BYTE2 31 Sets the protocol data of byte 2 (the third byte) to 31 = 1Fh = 00011111b .
-
Page 733: Sweeps
® Remote Control - Command Description R&S Generator Settings Manual operation: "Value " on page 283 SOURce:PROTocol:VALidity <validity> Parameters: <validity> NONE | CH1And2 Manual operation: "Validity" on page 282 7.3.5 Sweeps The SOURce:SWEeps:... commands set the sweeps. List sweeps are loaded with commands of the MMEMory-Subsystem. - Page 734 ® Remote Control - Command Description R&S Generator Settings ● on page 719 SOURce:SWEep:VOLTage:STOP ● on page 720 SOURce:SWEep:XAXis ● on page 720 SOURce:SWEep:ZAXis MMEMory:LOAD:DWELl <dwell> Parameters: <dwell> string Manual operation: "Next Step " on page 291 MMEMory:LOAD:FREQuency <frequency> MMEMory:LOAD:PHASe <phase> MMEMory:LOAD:VOLTage <voltage>...
- Page 735 ® Remote Control - Command Description R&S Generator Settings Manual operation: "Halt" on page 297 SOURce:SWEep:FREQuency:HALT:VALue <value> SOURce:SWEep:PHASe:HALT:VALue <value> SOURce:SWEep:VOLTage:HALT:VALue <value> Parameters: <value> float Manual operation: "Halt value" on page 297 SOURce:SWEep:FREQuency:POINts <points> SOURce:SWEep:PHASe:POINts <points> SOURce:SWEep:VOLTage:POINts <points> Parameters: <points> integer Manual operation: "Points"...
-
Page 736: Rapid Deactivation Of Outputs
® Remote Control - Command Description R&S Analyzer Settings Manual operation: "Stop" on page 294 SOURce:SWEep:XAXis <state> Parameters: <state> FREQuency | VOLTage | PHASe Manual operation: "X-axis " on page 288 SOURce:SWEep:ZAXis <state> Parameters: <state> OFF | FREQuency | VOLTage | PHASe Manual operation: "Z-axis"... -
Page 737: Configuring The Analog Analyzer
® Remote Control - Command Description R&S Analyzer Settings Suffix: <n1> 1 | 2 Suffix 1 (or no suffix) at INSTrument defines that selection of the generator is active, see Chapter 7.3.1, "Selecting the Gener- ator", on page 688. Suffix 2 at INSTrument defines that selection of the analyzer is active, Parameters: <analyzer_type>... - Page 738 ® Remote Control - Command Description R&S Analyzer Settings INPut[1]:BANDwidth:MODE <mode> Parameters: <mode> B22 | B40 | B80 Manual operation: "Bandwidth" on page 305 INPut<n1>:COUPling <coupling> Suffix: <n1> 1 ... 8 : channel 1 to 8 Parameters: <coupling> AC | DC Manual operation: "Chx Coupling"...
- Page 739 ® Remote Control - Command Description R&S Analyzer Settings INPut:MIMPedance:CHANnels <channels> Parameters: <channels> TRACk | SPLit Manual operation: "Impedance" on page 306 INPut[1]:RANGe:CHANnels <channels> Parameters: <channels> TRACk | SPLit Manual operation: "Range" on page 307 SENSe[1]:MAX:FFT:SIZE <size> Parameters: <size> S512 | S1K | S2K | S4K | S8K | S16K | S32K | S64K | S128K | S256K Manual operation: "Max FFT Size"...
-
Page 740: Configuring The Digital Analyzer
® Remote Control - Command Description R&S Analyzer Settings Manual operation: "Chx Range" on page 307 SENSe[1]:VOLTage:RANGe<n3>:VALue <value> Suffix: <n3> <n3> = 1 with setting INPut:RANGe:CHANnels TRACk. <n3> = 1 to 8 with setting INPut:RANGe:CHANnels SPLit. It denotes channel 1 to 8. Parameters: <value>... - Page 741 ® Remote Control - Command Description R&S Analyzer Settings INPut[1]:AUDiobits <audiobits> Parameters: <audiobits> integer Manual operation: "Audio Bits" on page 312 "Audio Bits " on page 317 "Audio Bits" on page 331 INPut[1]:CHANnel <channel> Parameters: <channel> analog analyzer: CH1 | CH2 | CH1Is2 digital and I2S analyzer (with R&S UPP-B2): CH1 | CH2 | BOTH I2S and HDMI analyzer (with R&S UPP-B4):...
-
Page 742: Configuring The I
® Remote Control - Command Description R&S Analyzer Settings Manual operation: "Input" on page 313 7.4.4 Configuring the I S Analyzer The settings for the I S analyzer are performed in the INPut and SENSe subsystems. ● on page 725 INPut[1]:AUDiobits ●... -
Page 743: Configure Hdmi Analyzer
® Remote Control - Command Description R&S Analyzer Settings Manual operation: "Fsync Slope" on page 319 INPut[1]:INPut <input> Parameters: <input> I2S Analyzer: INTern | DSUB Manual operation: "Input" on page 318 INPut<n1>:WLENgth <wlength> Parameters: <wlength> W16 | W24 | W32 Manual operation: "Word Length "... - Page 744 ® Remote Control - Command Description R&S Analyzer Settings ● on page 729 SENSe[1]:HDMI:CEC:INIT ● on page 729 SENSe[1]:HDMI:CEC:HANDshake ● on page 729 SENSe[1]:HDMI:HDCP? ● on page 730 SENSe[1]:HDMI:VIDeo:COLor:DEPTh? ● on page 730 SENSe[1]:HDMI:VIDeo:FORMat? ● on page 730 SENSe[1]:HDMI:VIDeo:TIMing ● on page 723 SENSe[1]:MAX:FFT:SIZE ●...
- Page 745 ® Remote Control - Command Description R&S Analyzer Settings SENSe[1]:HDMI:AUDio:FORMat <format> Parameters: <format> PCM2ch | PCM8ch Manual operation: "Audio Format" on page 328 SENSe[1]:HDMI:AUDio:FORMat:MODE <mode> Parameters: <mode> MANual | AUTO Manual operation: "Audio Format" on page 328 SENSe[1]:HDMI:AUDio:INPut <input> Parameters: <input>...
-
Page 746: Triggering Measurements And Reading Results
® Remote Control - Command Description R&S Triggering Measurements and Reading Results SENSe[1]:HDMI:VIDeo:COLor:DEPTh? <depth> Return values: <depth> D08 | D10 | D12 Usage: Query only Manual operation: "Color Depth" on page 326 SENSe[1]:HDMI:VIDeo:FORMat? Usage: Query only Manual operation: "Format No" on page 326 SENSe[1]:HDMI:VIDeo:TIMing <timing>... - Page 747 ® Remote Control - Command Description R&S Triggering Measurements and Reading Results Single measurement The Audio Analyzer carries out a single measurement for all measurement types acti- vated; then the measurement system goes to the "Term"inated state. It is not manda- tory that valid results be produced by the measurements: if an error occurs during a measurement, the result is indicated as being invalid.
- Page 748 ® Remote Control - Command Description R&S Triggering Measurements and Reading Results WAIT CONTinous measurement in which the SENSe<n1>:DATA<n2> commands, which are used to query the measurement results, stop the IEC/IEEE bus until a measurement result is available. RSTart Starts a single measurement or a sweep. At the same time resets the measurement traces and restart the Play function.
-
Page 749: Start Conditions
® Remote Control - Command Description R&S Triggering Measurements and Reading Results SINGle Start of a single measurement. In the case of a stopped measurement or an in-progress single measurement identical to the [SINGLE] stroke. Identical to INITiate:CONTinuous OFF; however, without changing the INITiate presetting. - Page 750 ® Remote Control - Command Description R&S Triggering Measurements and Reading Results ● on page 735 TRIGger:TIMer ● on page 735 TRIGger:VOLTage:VARiation TRIGger:CHANnel <channel> Parameters: <channel> OFF | CH1 | CH2 | CH3 | CH4 | CH5 | CH6 | CH7 | CH8 Manual operation: "Trigger Chan"...
-
Page 751: External Sweeps And Level-Controlled Measurement Value Triggering
® Remote Control - Command Description R&S Triggering Measurements and Reading Results TRIGger:TIMer <timer> Parameters: <timer> float Manual operation: "Time" on page 349 TRIGger:VOLTage:VARiation <variation> Parameters: <variation> float Manual operation: "Variation" on page 352 7.5.3 External Sweeps and Level-Controlled Measurement Value Trigger- The following commands control the start conditions for external sweeps and level-con- trolled measurement value triggering (see also Chapter 5.19, "External Sweeps and... -
Page 752: Reading Measurement Results
® Remote Control - Command Description R&S Triggering Measurements and Reading Results ARM:VOLTage:STARt <start> Parameters: <start> float Manual operation: "Start" on page 351 ARM:VOLTage:STOP <stop> Parameters: <stop> float Manual operation: "Stop" on page 352 7.5.4 Reading Measurement Results Depending on the measurements activated in the Analyzer panel, the Audio Analyzer indicates up to eight results in the numeric display in the case of a two-channel instru- ment and up to 64 results in the case of a multichannel instrument. - Page 753 ® Remote Control - Command Description R&S Triggering Measurements and Reading Results The return value comes in the basic unit (without engineering), e.g. a measurement result of 1.2345 kHzis returned as 1234.5 (Hz), a measurement result of 12.345 µV as 12.345e-006 (V).
-
Page 754: Output Of Trace Data Sets
® Remote Control - Command Description R&S Triggering Measurements and Reading Results SENSe<1|2|3|6>:DATA:ALL? <all> Returns the measurement results of all channels in the form of float values which are separated by a comma. Channels which are switched off are represented by value "9.91E+37". - Page 755 ® Remote Control - Command Description R&S Triggering Measurements and Reading Results ● on page 741 DISPlay:SWEep<n2>:SCANoffset ● on page 741 DISPlay:WAVeform<n2>:SCANoffset ● on page 741 FORMat ● on page 746 TRACe:BARGraph<n2>:LDList:AX? ● on page 746 TRACe:BARGraph<n2>:LDList:AY? ● on page 746 TRACe:BARGraph<n2>:LDList:BX? ●...
- Page 756 ® Remote Control - Command Description R&S Triggering Measurements and Reading Results ● on page 826 TRACe:FFT<n2>:STORe:BY ● on page 744 TRACe:SWEep<n2>:LDList:AX? ● on page 744 TRACe:SWEep<n2>:LDList:AY? ● on page 744 TRACe:SWEep<n2>:LDList:BX? ● on page 744 TRACe:SWEep<n2>:LDList:BY? ● on page 744 TRACe:SWEep<n2>:LDList:COUNt:AX? ●...
- Page 757 ® Remote Control - Command Description R&S Triggering Measurements and Reading Results ● on page 826 TRACe:WAVeform<n2>:STORe:BY FORMat <format> Defines the number format for outputting trace data sets. This setting is not stored in the setup and is set to ASCII each time the R&S UPP is switched on.
- Page 758 ® Remote Control - Command Description R&S Triggering Measurements and Reading Results Example: "DISP:SWE:SCAN 2 Selects max scan for output Manual operation: "Scan" on page 559 TRACe:SWEep<n2>:LOAD:AX? TRACe:SWEep<n2>:LOAD:AY? TRACe:SWEep<n2>:LOAD:BX? TRACe:SWEep<n2>:LOAD:BY? TRACe:SWEep<n2>:LOAD:COUNt:AX? TRACe:SWEep<n2>:LOAD:COUNt:AY? TRACe:SWEep<n2>:LOAD:COUNt:BX? TRACe:SWEep<n2>:LOAD:COUNt:BY? Command for outputting sweep trace data sets, see (see TRACe:SWEep<n2>: on page 825) and outputting the number of sweep data.
- Page 759 ® Remote Control - Command Description R&S Triggering Measurements and Reading Results Example: First example: TRAC:SWEep1:LOAD:AY? Outputs the data of the Y-axis of channel A from the first sweep system. Response with the setting FORMat ASC: -57.1647,-6.08881,-32.304,-53.6429 … Response with the setting FORMat REAL: #<Lengthoflength><length><block_data>...
- Page 760 ® Remote Control - Command Description R&S Triggering Measurements and Reading Results TRACe:WAVeform<n2>:LOAD:COUNt:BX? TRACe:WAVeform<n2>:LOAD:COUNt:BY? Commands for outputting Waveform data and outputting the number of Waveform data. See also on page 742. TRACe:SWEep<n2>:LOAD:COUNt:BY? Suffix: <n2> subsystem 1 Return values: <argument> integer | float | binary For the COUNt commands, an integer value is returned.
- Page 761 ® Remote Control - Command Description R&S Triggering Measurements and Reading Results TRACe:SWEep<n2>:LDList:COUNt:AY? TRACe:SWEep<n2>:LDList:COUNt:BX? TRACe:SWEep<n2>:LDList:COUNt:BY? The TRACe:SWEep<n2>:LDList:... commands are basically identical to the TRACe:SWEep<n2>:LOAD:... commands, see TRACe:SWEep<n2>:LOAD:BY? on page 742. They query the data records of filtered trace data and their number. The filtering of the trace data is performed with command DISPlay:SWEep<n2>:DLISt:FILTer ALL | LIMUpper | LIMLower | LIMBoth | HARMonics | PEAKs...
- Page 762 ® Remote Control - Command Description R&S Triggering Measurements and Reading Results The format of the return values of the other commands depends on the FORMat setting: If FORMat ASCii is selected float values are returned. If FORMat REAL is selected a binary data block is returned. Usage: Query only TRACe:WAVeform<n2>:LDList:AX?
-
Page 763: Reading Out Multi-Channel Records
® Remote Control - Command Description R&S Triggering Measurements and Reading Results TRACe:BARGraph<n2>:LDList:COUNt:BX? TRACe:BARGraph<n2>:LDList:COUNt:BY? The TRACe:BARGraph<n2>:LDList:... commands are basically identical to the TRACe:BARGraph<n2>:LOAD:... commands, see TRACe:BARGraph<n2>:LOAD: on page 744. They query the data records of filtered trace data and their number. The filtering of the trace data is performed with command DISPlay:BARGraph:DLISt:FILTer ALL | LIMUpper | LIMLower | LIMBoth | HARMonics | PEAKs... - Page 764 ® Remote Control - Command Description R&S Triggering Measurements and Reading Results ● on page 749 DATA:FFT:Y<n3>? ● on page 748 DATA:SWEep:COUNt:X<n4>? ● on page 748 DATA:SWEep:COUNt:Y<n4>? ● on page 749 DATA:SWEep:X<n3>? ● on page 749 DATA:SWEep:Y<n3>? DATA:FFT:COUNt:X<n4>? DATA:BARGraph:COUNt:X<n4>? DATA:SWEep:COUNt:X<n4>? Commands for reading out the number of X axis values of a sweep, an FFT or a bar- graph The example below is exemplary for the FFT and bar graph sub-systems.
- Page 765 ® Remote Control - Command Description R&S Triggering Measurements and Reading Results DATA:FFT:X<n3>? DATA:BARGraph:X<n3>? DATA:SWEep:X<n3>? Commands for reading out the X axis data of a sweep, an FFT or a bar graph. The example below is exemplary for the FFT and bar graph sub-systems. Suffix: <n3>...
-
Page 766: Output Of Protocol Data
® Remote Control - Command Description R&S Triggering Measurements and Reading Results 7.5.7 Output of Protocol Data SENSe<8>:PROTocol:CH<1|2>:BYTE<0...4>? Outputs the protocol data of the selected byte of the selected channel. Suffix: <8> 8 = protocol analysis <1|2> selects channel 1 or 2 <0...4>... -
Page 767: Sweep Options
® Remote Control - Command Description R&S Sweep Options d3: PAR2 d4: LOC1 d5: LOC2 d6: CRC1 d7: CRC2 d8: INV1 d9: INV2 Example: SENS8:PROT:ERR? Response: 4,"PAR1" Binary equivalent = 0000000100. Thus, d2 is set and the PAR1 error is output. Usage: Query only SENSe<8>:PROTocol:ERRor:CRC<1|2>? -
Page 768: Selecting Measurement And Mode
® Remote Control - Command Description R&S Selecting Measurement and Mode 7.7 Selecting Measurement and Mode The measurement type and measurement mode is selected with the two SENSe-com- mands SENSe:FUNCtion and SENSe:FUNCtion:MMode. In addition the more specific measurement mode commands SENSe:FUNCtion:APERture:MODE and SENSe:VOLTage:APERture are descri- bed. - Page 769 ® Remote Control - Command Description R&S Selecting Measurement and Mode Manual operation: "Stream Header" on page 332 "Function (RMS, broadband)" on page 361 "Function (RMS, selective)" on page 364 "Function (Peak)" on page 373 "Function (DC)" on page 375 "Function (S/N)"...
-
Page 770: Level Measurements
® Remote Control - Command Description R&S Level Measurements SENSe[1]:VOLTage:APERture <aperture> Parameters: <aperture> float Manual operation: "Meas Time" on page 361 "Meas Time" on page 364 "Meas Time" on page 379 "Meas Time" on page 404 "Meas Time" on page 421 "Max Delay"... - Page 771 ® Remote Control - Command Description R&S Level Measurements MMEMory:LOAD:FREQuency:SLCFrequency <filename> Input of the file name for the list of band-pass / band-stop center frequencies (fre- quency sweep list). Only available for activated bandpass / band-stop list sweep. Parameters: <filename> string Manual operation: "File Name"...
- Page 772 ® Remote Control - Command Description R&S Level Measurements Manual operation: "Sweep Ctrl" on page 368 SENSe[1]:SWEep:POINts <points> Parameters: <points> integer Manual operation: "Points" on page 370 SENSe[1]:SWEep:SPACing <spacing> Parameters: <spacing> LINSteps | LOGSteps | LINPoints | LOGPoints Manual operation: "Spacing"...
-
Page 773: Peak Measurement
® Remote Control - Command Description R&S Signal-to-Noise Measurements 7.8.3 Peak Measurement ● on page 763 SENSe[1]:FUNCtion:FFT:SIZE ● on page 773 SENSe[1]:FILTer<n2> ● on page 752 SENSe<1|2|3|6|7|8>:FUNCtion ● on page 753 SENSe[1]:FUNCtion:MMODe ● on page 771 SENSe[1]:FUNCtion:SETTling:MODE ● on page 757 SENSe[1]:FUNCtion:SNSequence ●... -
Page 774: Distortion Measurements
® Remote Control - Command Description R&S Distortion Measurements Manual operation: "S/N Sequence" on page 381 7.10 Distortion Measurements 7.10.1 General Settings ● on page 758 MMEMory:LOAD:IEQualize ● on page 758 SENSe[1]:FUNCtion:BARGraph ● on page 758 SENSe[1]:FUNCtion:FFT:STATe ● on page 758 SENSe[1]:FUNCtion:REFNment ●... -
Page 775: Thd
® Remote Control - Command Description R&S Distortion Measurements SENSe[1]:VOLTage:EQUalize <equalize> Parameters: <equalize> ON | OFF Manual operation: "Equalizer " on page 382 "Equalizer " on page 405 "Equalizer" on page 415 7.10.2 THD ● on page 752 SENSe<1|2|3|6|7|8>:FUNCtion ● on page 759 SENSe[1]:FUNCtion:DISTortion<n3>... -
Page 776: Thd+N / Sinad
® Remote Control - Command Description R&S Distortion Measurements SENSe[1]:VOLTage:FUNDamental:MODE <mode> Parameters: <mode> AUTO | GENTrack | SOURce | VALue | FIXed Manual operation: "Fundamental " on page 387 "Fundamental " on page 394 7.10.3 THD+N / SINAD ● on page 773 SENSe[1]:FILTer<n2>... -
Page 777: Mod Dist
® Remote Control - Command Description R&S FFT Analysis 7.10.4 MOD DIST ● on page 752 SENSe<1|2|3|6|7|8>:FUNCtion 7.10.5 DFD ● on page 752 SENSe<1|2|3|6|7|8>:FUNCtion ● on page 753 SENSe[1]:FUNCtion:MMODe 7.11 Polarity Measurement ● on page 752 SENSe<1|2|3|6|7|8>:FUNCtion 7.12 FFT Analysis The FFT analysis (Fast Fourier Transformation) allows the input signal to be displayed in the spectral range (frequency range). - Page 778 ® Remote Control - Command Description R&S FFT Analysis ● on page 759 SENSe[1]:VOLTage:EQUalize SENSe[1]:CHANnel:DELay <delay> Parameters: <delay> float Manual operation: "Delay Ch1, Delay Ref Chan" on page 413 SENSe[1]:FREQuency:LIMit <limit> Parameters: <limit> ON | OFF Manual operation: "Freq Limit" on page 416 SENSe[1]:FUNCtion:FFT:AVERage <average>...
- Page 779 ® Remote Control - Command Description R&S FFT Analysis Manual operation: "FFT Mode" on page 417 SENSe[1]:FUNCtion:FFT:RESolution? Return values: <argument> float Usage: Query only Manual operation: "Resolution" on page 419 SENSe[1]:FUNCtion:FFT:SIZE <size> Parameters: <size> S512 | S1K | S2K | S4K | S8K | S16K | S32K | S64K | S128K | S256K Manual operation: "FFT Size "...
-
Page 780: Chirp Based Measurement
® Remote Control - Command Description R&S Chirp Based Measurement 7.13 Chirp Based Measurement The following commands are required to perform a chirp based measurement. ● on page 764 MMEMory:STORe:PWAVeform ● on page 765 SENSe[1]:CHIRpbased:DISTortion<n3>:SWEep<n4>:A ● on page 765 SENSe[1]:CHIRpbased:DISTortion<n3>:SWEep<n4>:B ●... - Page 781 ® Remote Control - Command Description R&S Chirp Based Measurement Manual operation: "Prechirp Time " on page 267 SOURce:INTerval <interval> Parameters: <interval> float Manual operation: "Interval" on page 267 SENSe[1]:CHIRpbased:DISTortion<n3>:SWEep<n4>:A <distortion> SENSe[1]:CHIRpbased:DISTortion<n3>:SWEep<n4>:B <distortion> Suffix: <n3> 2 ... 9 harmonics 2 to 9 <n4>...
-
Page 782: Analysis In The Time Domain
® Remote Control - Command Description R&S Analysis in the Time Domain SENSe[1]:CHIRpbased:RESolution? Parameters: <resolution> <resolution> integer Usage: Query only Manual operation: "Resolution" on page 424 SENSe[1]:FUNCtion:DELay:MODE Parameters: <mode> <mode> MANual | AUTO Manual operation: "Delay Comp " on page 424 SENSe[1]:FUNCtion:DELay:VALue <delay>... - Page 783 ® Remote Control - Command Description R&S Analysis in the Time Domain SENSe<1|7>:CMPFactor <cmpfactor> Suffix: <1|7> 1 = function measurement results 7 = waveform monitor Parameters: <cmpfactor> integer Manual operation: "Comp Factor" on page 432 SENSe7:MMODe <mmode> Parameters: <mmode> STANdard | COMPressed | USAMple Manual operation: "Meas Mode "...
-
Page 784: Protocol Analysis
® Remote Control - Command Description R&S Protocol Analysis Manual operation: "Trigger Source " on page 433 SENSe7:TRIGger:TRCLength <trclength> Parameters: <trclength> float Manual operation: "Trace Length" on page 432 7.15 Protocol Analysis Protocol analysis is selected by SENSe8:FUNCtion ON. ● on page 752 SENSe<1|2|3|6|7|8>:FUNCtion ●... -
Page 785: Delay Measurement
® Remote Control - Command Description R&S Lip-Sync Analysis SENSe8:PROTocol:VIEW <view> Parameters: <view> BINText | BINonly Manual operation: "View Mode" on page 443 7.16 Delay Measurement Delay measurement reqiures suffix 1 or no suffix at the SENSe:... commands. ● on page 770 SENSe3:FREQuency:APERture:MODE ●... -
Page 786: Frequency, Phase And Group Delay Measurement
® Remote Control - Command Description R&S Input, Second and Level Monitor Manual operation: "Auto Trigger Threshold Low" on page 422 "Low" on page 449 SENSe[1]:LIPSync:COLor:THReshold:HIGH:STRing <string> Parameters: <string> string Manual operation: "RGB string" on page 448 SENSe[1]:LIPSync:COLor:THReshold:LOW:STRing <string> Parameters: <string>... -
Page 787: Settling Methods
® Remote Control - Command Description R&S Settling Methods ● Level monitor is selected by using suffix 6 a t the SENSe<n1>:FUNCtion com- mand. on page 752 SENSe<1|2|3|6|7|8>:FUNCtion ● Second monitor is activated by the following command: SENSe2:FUNCtion:SNDMonitor <mode> Parameters: <mode>... -
Page 788: Filters
® Remote Control - Command Description R&S Filters SENSe[1]:FUNCtion:SETTling:RESolution <resolution> SENSe[1]:TRIGger:SETTling:RESolution <resolution> Parameters: <resolution> float Manual operation: "Resolution" on page 465 SENSe[1]:FUNCtion:SETTling:TOLerance <tolerance> SENSe[1]:TRIGger:SETTling:TOLerance <tolerance> Parameters: <tolerance> float Manual operation: "Tolerance" on page 465 SENSe[1]:FUNCtion:SETTling:TOUT <tout> Parameters: <tout> float Manual operation: "Timeout"... - Page 789 ® Remote Control - Command Description R&S Filters ● on page 774 SENSe[1]:UFILter<n2>:CENTer ● on page 774 SENSe[1]:UFILter<n2>:DELay ● on page 775 SENSe[1]:UFILter<n2>:FNAMe ● on page 775 SENSe[1]:UFILter<n2>:ORDer ● on page 775 SENSe[1]:UFILter<n2>:PASSb ● on page 775 SENSe[1]:UFILter<n2>:PASSb:LOWer ● on page 775 SENSe[1]:UFILter<n2>:PASSb:UPPer ●...
- Page 790 ® Remote Control - Command Description R&S Filters Parameters: <filter> OFF | UFIL1 | UFIL2 | UFIL3 | UFIL4 | UFIL5 | UFIL6 | UFIL7 | UFIL8 | UFIL9 | AWE | CARM | CCIU | CCIR | CCIT | CMES | DEMP17 | DCN | DEMP5015 | DEMP75 | IECT | JITT | PEMP17 | PEMP50 | PEMP5015 | PEMP75 | HP22 | HP400 | LP22 | LP30 | LP80 | AES17 | CWE | URUM | WRUM...
- Page 791 ® Remote Control - Command Description R&S Filters SENSe[1]:UFILter<n2>:FNAMe <fname> Parameters: <fname> string Manual operation: "File Def Filter" on page 475 SENSe[1]:UFILter<n2>:ORDer <order> Parameters: <order> N4 | N8 Manual operation: "Order" on page 471 SENSe[1]:UFILter<n2>:PASSb <passb> Parameters: <passb> float Manual operation: "Passband"...
- Page 792 ® Remote Control - Command Description R&S Filters SENSe[1]:UFILter<n2>:STOPb:UPPer <upper> Parameters: <upper> float Manual operation: "Stopb Upp" on page 473 "Stopb Upp" on page 474 SENSe[1]:UFILter<n2>:WIDTh <width> Parameters: <width> float Manual operation: "Width" on page 474 SOURce:FILTer <filter> Parameters: <filter> OFF | UFIL1 | UFIL2 | UFIL3 | UFIL4 | UFIL5 | UFIL6 | UFIL7 | UFIL8 | UFIL9 | AWE | CARM | CCIU | CCIR | CCIT | CMES | DEMP17 | DCN | DEMP5015 | DEMP75 | IECT | JITT |...
-
Page 793: Auxiliaries Panel
® Remote Control - Command Description R&S Auxiliaries Panel SOURce:STEReo<n2>:FILTer <filter> Suffix: <n2> 1 | 2 1 = filter for channel 1 of generator function "Stereo Sine". Com- mand SOURce:STEReo1:FILTer is an alias to command SOURce:FILTer. 2 = filter for channel 2 of generator function "Stereo Sine". Parameters: <filter>... - Page 794 ® Remote Control - Command Description R&S Auxiliaries Panel AUXiliaries:SPEaker:MONitor<n3> <monitor> Suffix: <n3> 1 | 2 selects the monitor Parameters: <monitor> CH1 | CH2 | CH3 | CH4 | CH5 | CH6 | CH7 | CH8 Manual operation: "Monitor 1, Monitor 2 " on page 487 AUXiliaries:SPEaker:SOURce<n3>...
-
Page 795: Switcher
® Remote Control - Command Description R&S Switcher Manual operation: "Mode" on page 488 AUXiliaries:VOLTage<n2> <voltage> Suffix: <n2> 1 | 2 selects the monitor. Parameters: <voltage> float Manual operation: "Voltage 1, Voltage 2 " on page 487 7.23 Switcher The following commands control the R&S UPZ Audio Switcher. For further information see the operating manual for the R&S UPZ. - Page 796 ® Remote Control - Command Description R&S Switcher Manual operation: "Input B" on page 492 SWITcher:OFFSet:BVSA <bvsa> Parameters: <bvsa> integer Manual operation: "B vs A" on page 492 SWITcher:OFFSet:OVSI <ovsi> Parameters: <ovsi> integer Manual operation: "Out vs Inp" on page 492 SWITcher:OUTA <outa>...
-
Page 797: Traces, Spectrum Displays And Bargraphs
® Remote Control - Command Description R&S Traces, Spectrum Displays and Bargraphs 7.24 Traces, Spectrum Displays and Bargraphs 7.24.1 Display Configuration The commands are grouped for the following subsystems according to their function: FFT | WAVEform | BARGraph | SWEep The value range for suffix <n2>... - Page 798 ® Remote Control - Command Description R&S Traces, Spectrum Displays and Bargraphs ● on page 796 DISPlay:BARGraph<n2>:A:UNIT ● on page 797 DISPlay:BARGraph<n2>:A:UNIT:AUTO ● on page 797 DISPlay:BARGraph<n2>:A:UNIT:TRACk ● on page 797 DISPlay:BARGraph<n2>:A:UNIT:USER ● on page 797 DISPlay:BARGraph<n2>:A:UPDate ● on page 798 DISPlay:BARGraph<n2>:A:YSOurce ●...
- Page 799 ® Remote Control - Command Description R&S Traces, Spectrum Displays and Bargraphs ● on page 798 DISPlay:BARGraph<n2>:COPYother ● on page 799 DISPlay:BARGraph<n2>:DLISt:FILTer ● on page 799 DISPlay:BARGraph<n2>:MINMax ● on page 800 DISPlay:BARGraph<n2>:MCHMode ● on page 800 DISPlay:BARGraph<n2>:TITLe:DESCription ● on page 800 DISPlay:BARGraph<n2>:TITLe:SHOW ●...
- Page 800 ® Remote Control - Command Description R&S Traces, Spectrum Displays and Bargraphs ● on page 797 DISPlay:FFT<n2>:A:YSOurce ● on page 798 DISPlay:FFT<n2>:A:YSOurce:FILE ● on page 790 DISPlay:FFT<n2>:B:BOTTom ● on page 790 DISPlay:FFT<n2>:B:CHANnel ● on page 790 DISPlay:FFT<n2>:B:LABel:AUTO ● on page 790 DISPlay:FFT<n2>:B:LABel:USER ●...
- Page 801 ® Remote Control - Command Description R&S Traces, Spectrum Displays and Bargraphs ● on page 800 DISPlay:FFT<n2>:TITLe:SHOW ● on page 800 DISPlay:FFT<n2>:TRACk:LIMit ● on page 800 DISPlay:FFT<n2>:TRACk:REFerence ● on page 801 DISPlay:FFT<n2>:TRACk:SCALing ● on page 801 DISPlay:FFT<n2>:X:LABel:AUTO ● on page 801 DISPlay:FFT<n2>:X:LABel:USER ●...
- Page 802 ® Remote Control - Command Description R&S Traces, Spectrum Displays and Bargraphs ● on page 796 DISPlay:SWEep<n2>:A:UNIT ● on page 797 DISPlay:SWEep<n2>:A:UNIT:AUTO ● on page 797 DISPlay:SWEep<n2>:A:UNIT:TRACk ● on page 797 DISPlay:SWEep<n2>:A:UNIT:USER ● on page 797 DISPlay:SWEep<n2>:A:UPDate ● on page 798 DISPlay:SWEep<n2>:A:YSOurce ●...
- Page 803 ® Remote Control - Command Description R&S Traces, Spectrum Displays and Bargraphs ● on page 798 DISPlay:SWEep<n2>:COPYother ● on page 799 DISPlay:SWEep<n2>:DLISt:FILTer ● on page 799 DISPlay:SWEep<n2>:HISTory ● on page 799 DISPlay:SWEep<n2>:MINMax ● on page 800 DISPlay:SWEep<n2>:SMODe ● on page 800 DISPlay:SWEep<n2>:TITLe:DESCription ●...
- Page 804 ® Remote Control - Command Description R&S Traces, Spectrum Displays and Bargraphs ● on page 794 DISPlay:WAVeform<n2>:A:LIMUpper:SOURce:VALue ● on page 795 DISPlay:WAVeform<n2>:A:REFerence ● on page 795 DISPlay:WAVeform<n2>:A:REFerence:VALue ● on page 796 DISPlay:WAVeform<n2>:A:SPACing ● on page 796 DISPlay:WAVeform<n2>:A:TOP ● on page 796 DISPlay:WAVeform<n2>:A:UNIT ●...
- Page 805 ® Remote Control - Command Description R&S Traces, Spectrum Displays and Bargraphs ● on page 798 DISPlay:WAVeform<n2>:DLISt:FILTer ● on page 800 DISPlay:WAVeform<n2>:TITLe:DESCription ● on page 800 DISPlay:WAVeform<n2>:TITLe:SHOW ● on page 800 DISPlay:WAVeform<n2>:TRACk:LIMit ● on page 801 DISPlay:WAVeform<n2>:TRACk:REFerence ● on page 801 DISPlay:WAVeform<n2>:TRACk:SCALing ●...
- Page 806 ® Remote Control - Command Description R&S Traces, Spectrum Displays and Bargraphs ● on page 804 MMEMory:WAVeform<n2>:STORe ● on page 804 SENSe<1|2|6>:CONFig:COPYother DISPlay:FFT<n2>:A:BOTTom <bottom> DISPlay:FFT<n2>:B:BOTTom <bottom> DISPlay:WAVeform<n2>:A:BOTTom <bottom> DISPlay:WAVeform<n2>:B:BOTTom <bottom> DISPlay:BARGraph<n2>:A:BOTTom <bottom> DISPlay:BARGraph<n2>:B:BOTTom <bottom> DISPlay:SWEep<n2>:A:BOTTom <bottom> DISPlay:SWEep<n2>:B:BOTTom <bottom> Parameters: <bottom> float Manual operation: "Bottom"...
- Page 807 ® Remote Control - Command Description R&S Traces, Spectrum Displays and Bargraphs DISPlay:SWEep<n2>:A:LABel:USER <user> DISPlay:SWEep<n2>:B:LABel:USER <user> Parameters: <user> string Manual operation: "Label Auto" on page 522 DISPlay:FFT<n2>:A:LEGend:DESCription <description> DISPlay:FFT<n2>:B:LEGend:DESCription <description> DISPlay:WAVeform<n2>:A:LEGend:DESCription <description> DISPlay:WAVeform<n2>:B:LEGend:DESCription <description> DISPlay:BARGraph<n2>:A:LEGend:DESCription <description> DISPlay:BARGraph<n2>:B:LEGend:DESCription <description> DISPlay:SWEep<n2>:A:LEGend:DESCription <description> DISPlay:SWEep<n2>:B:LEGend:DESCription <description>...
- Page 808 ® Remote Control - Command Description R&S Traces, Spectrum Displays and Bargraphs DISPlay:FFT<n2>:A:LIMLower:SOURce <source> DISPlay:FFT<n2>:B:LIMLower:SOURce <source> DISPlay:WAVeform<n2>:A:LIMLower:SOURce <source> DISPlay:WAVeform<n2>:B:LIMLower:SOURce <source> DISPlay:BARGraph<n2>:A:LIMLower:SOURce <source> DISPlay:BARGraph<n2>:B:LIMLower:SOURce <source> DISPlay:SWEep<n2>:A:LIMLower:SOURce <source> DISPlay:SWEep<n2>:B:LIMLower:SOURce <source> Parameters: <source> VALue | FILE | HOLD | IFILe Manual operation: "Source" on page 540 DISPlay:FFT<n2>:A:LIMLower:SOURce:FILE <file>...
- Page 809 ® Remote Control - Command Description R&S Traces, Spectrum Displays and Bargraphs DISPlay:SWEep<n2>:A:LIMShift <state> DISPlay:SWEep<n2>:B:LIMShift <state> Parameters: <state> ON | OFF Manual operation: "Limit Shift" on page 541 DISPlay:FFT<n2>:A:LIMShift:PARallel <parallel> DISPlay:FFT<n2>:B:LIMShift:PARallel <parallel> DISPlay:WAVeform<n2>:A:LIMShift:PARallel <parallel> DISPlay:WAVeform<n2>:B:LIMShift:PARallel <parallel> DISPlay:BARGraph<n2>:A:LIMShift:PARallel <parallel> DISPlay:BARGraph<n2>:B:LIMShift:PARallel <parallel> DISPlay:SWEep<n2>:A:LIMShift:PARallel <parallel>...
- Page 810 ® Remote Control - Command Description R&S Traces, Spectrum Displays and Bargraphs DISPlay:WAVeform<n2>:A:LIMUpper:SOURce <source> DISPlay:WAVeform<n2>:B:LIMUpper:SOURce <source> DISPlay:BARGraph<n2>:A:LIMUpper:SOURce <source> DISPlay:BARGraph<n2>:B:LIMUpper:SOURce <source> DISPlay:SWEep<n2>:A:LIMUpper:SOURce <source> DISPlay:SWEep<n2>:B:LIMUpper:SOURce <source> Parameters: <source> VALue | FILE | HOLD | IFILe Manual operation: "Source" on page 537 DISPlay:FFT<n2>:A:LIMUpper:SOURce:FILE <file> DISPlay:FFT<n2>:B:LIMUpper:SOURce:FILE <file>...
- Page 811 ® Remote Control - Command Description R&S Traces, Spectrum Displays and Bargraphs DISPlay:FFT<n2>:A:NORMalize:VALue <value> DISPlay:FFT<n2>:B:NORMalize:VALue <value> DISPlay:BARGraph<n2>:A:NORMalize:VALue <value> DISPlay:BARGraph<n2>:B:NORMalize:VALue <value> DISPlay:SWEep<n2>:A:NORMalize:VALue <value> DISPlay:SWEep<n2>:B:NORMalize:VALue <value> Parameters: <value> float Manual operation: "Normalize Value" on page 528 DISPlay:FFT<n2>:A:REFerence <reference> DISPlay:FFT<n2>:B:REFerence <reference> DISPlay:WAVeform<n2>:A:REFerence <reference> DISPlay:WAVeform<n2>:B:REFerence <reference>...
- Page 812 ® Remote Control - Command Description R&S Traces, Spectrum Displays and Bargraphs Manual operation: "Reference Value" on page 526 DISPlay:FFT<n2>:A:SPACing <spacing> DISPlay:FFT<n2>:B:SPACing <spacing> DISPlay:WAVeform<n2>:A:SPACing <spacing> DISPlay:WAVeform<n2>:B:SPACing <spacing> DISPlay:BARGraph<n2>:A:SPACing <spacing> DISPlay:BARGraph<n2>:B:SPACing <spacing> DISPlay:SWEep<n2>:A:SPACing <spacing> DISPlay:SWEep<n2>:B:SPACing <spacing> Parameters: <spacing> LINear | LOGarithmic Manual operation: "Spacing"...
- Page 813 ® Remote Control - Command Description R&S Traces, Spectrum Displays and Bargraphs DISPlay:BARGraph<n2>:A:UNIT:AUTO <state> DISPlay:BARGraph<n2>:B:UNIT:AUTO <state> DISPlay:SWEep<n2>:A:UNIT:AUTO <state> DISPlay:SWEep<n2>:B:UNIT:AUTO <state> Parameters: <state> ON | OFF Manual operation: "Unit Auto" on page 531 DISPlay:FFT<n2>:A:UNIT:TRACk <state> DISPlay:FFT<n2>:B:UNIT:TRACk <state> DISPlay:BARGraph<n2>:A:UNIT:TRACk <state> DISPlay:BARGraph<n2>:B:UNIT:TRACk <state> DISPlay:SWEep<n2>:A:UNIT:TRACk <state>...
- Page 814 ® Remote Control - Command Description R&S Traces, Spectrum Displays and Bargraphs DISPlay:WAVeform<n2>:A:YSOurce <ysource> DISPlay:WAVeform<n2>:B:YSOurce <ysource> DISPlay:BARGraph<n2>:A:YSOurce <ysource> DISPlay:BARGraph<n2>:B:YSOurce <ysource> DISPlay:SWEep<n2>:A:YSOurce <ysource> DISPlay:SWEep<n2>:B:YSOurce <ysource> Parameters: <ysource> available parameters depend on subsystem. Parameters for Sweep subsystem: OFF | FUNC1 | FUNC2 | FREQ1 | FREQ2 | PHASe | GROupde- lay | LMRM1 | LMRM2 | LMDC1 | LMDC2 | LMPK1 | LMPK2 | INPP1 | INPP2 | FILEA | FILEB | FUNCtion | FREQuency | LMRMs | LMPK | INPPeak...
- Page 815 ® Remote Control - Command Description R&S Traces, Spectrum Displays and Bargraphs DISPlay:BARGraph<n2>:DLISt:FILTer <filter> DISPlay:SWEep<n2>:DLISt:FILTer <filter> Corresponds to the softkey operation in the list editor: Selection All | Lim Upper | Lim Lower | Lim upp&low | Harmonics | Peaks When saving a trace by setting "Store Trace as"...
- Page 816 ® Remote Control - Command Description R&S Traces, Spectrum Displays and Bargraphs Manual operation: "Show Min Max " on page 511 DISPlay:FFT<n2>:MCHMode <state> DISPlay:BARGraph<n2>:MCHMode <state> Parameters: <state> ON | OFF Manual operation: "Multi Ch Mode" on page 511 DISPlay:SWEep<n2>:SMODe <smode> Parameters: <smode>...
- Page 817 ® Remote Control - Command Description R&S Traces, Spectrum Displays and Bargraphs DISPlay:WAVeform<n2>:TRACk:REFerence <state> DISPlay:SWEep<n2>:TRACk:REFerence <state> Parameters: <state> ON | OFF Manual operation: "Track" on page 521 DISPlay:FFT<n2>:TRACk:SCALing <state> DISPlay:WAVeform<n2>:TRACk:SCALing <state> DISPlay:BARGraph<n2>:TRACk:SCALing <state> DISPlay:SWEep<n2>:TRACk:SCALing <state> Parameters: <state> ON | OFF Manual operation: "Track"...
- Page 818 ® Remote Control - Command Description R&S Traces, Spectrum Displays and Bargraphs DISPlay:FFT<n2>:X:REFerence:VALue <value> DISPlay:WAVeform<n2>:X:REFerence:VALue <value> DISPlay:SWEep<n2>:X:REFerence:VALue <value> Parameters: <value> float Manual operation: "Ref Value " on page 550 DISPlay:FFT<n2>:X:RIGHt <right> DISPlay:WAVeform<n2>:X:RIGHt <right> DISPlay:SWEep<n2>:X:RIGHt <right> Parameters: <right> float Manual operation: "Right"...
- Page 819 ® Remote Control - Command Description R&S Traces, Spectrum Displays and Bargraphs Manual operation: "Unit" on page 548 DISPlay:FFT<n2>:X:UNIT:AUTO <state> DISPlay:WAVeform<n2>:X:UNIT:AUTO <state> DISPlay:SWEep<n2>:X:UNIT:AUTO <state> Parameters: <state> ON | OFF Manual operation: "Unit Auto" on page 550 DISPlay:FFT<n2>:X:UNIT:USER <user> DISPlay:WAVeform<n2>:X:UNIT:USER <user> DISPlay:SWEep<n2>:X:UNIT:USER <user>...
- Page 820 ® Remote Control - Command Description R&S Traces, Spectrum Displays and Bargraphs MMEMory:FFT<n2>:LIMit:OFFSet:VALue <value> MMEMory:BARGraph<n2>:LIMit:OFFSet:VALue <value> MMEMory:SWEep<n2>:LIMit:OFFSet:VALue <value> Parameters: <value> float Manual operation: "Offset Value" on page 558 MMEMory:FFT<n2>:STAS <stas> MMEMory:WAVeform<n2>:STAS <stas> MMEMory:BARGraph<n2>:STAS <stas> MMEMory:SWEep<n2>:STAS <stas> Parameters: <stas> TRCList | EQUList | SWPList | LLISt | DSELect Manual operation: "Store Trace as"...
-
Page 821: Combi Display
® Remote Control - Command Description R&S Combi Display 7.25 Combi Display 7.25.1 Measurement Result Configuration ● on page 806 SENSe3:FREQuency:LEFT ● on page 806 SENSe3:FREQuency:LIMLower ● on page 806 SENSe3:FREQuency:LIMLower:VALue ● on page 806 SENSe3:FREQuency:LIMUpper ● on page 806 SENSe3:FREQuency:LIMUpper:VALue ●... - Page 822 ® Remote Control - Command Description R&S Combi Display ● on page 813 SENSe<1|2|6>:UNIT ● on page 813 SENSe<1|2|6>:USERunit SENSe3:FREQuency:LEFT <left> Suffix: frequency, phase, or group delay measurement Parameters: <left> float Manual operation: "Left" on page 590 SENSe3:FREQuency:LIMLower <limlower> Suffix: frequency, phase, and group delay-measurement Parameters: <limlower>...
- Page 823 ® Remote Control - Command Description R&S Combi Display SENSe3:FREQuency:REFerence <reference> Suffix: frequency, phase, or group delay measurement Parameters: <reference> float Manual operation: "Reference" on page 588 SENSe3:FREQuency:REFerence:MODE <mode> Suffix: frequency, phase, or group delay measurement Parameters: <mode> VALue | STORe | SOURce | GENTrack | CH1Store | CH2Store | CH3Store | CH4Store | CH5Store | CH6Store | CH7Store | CH8Store Manual operation:...
- Page 824 ® Remote Control - Command Description R&S Combi Display Manual operation: "Unit" on page 585 SENSe3:FREQuency:USERunit <userunit> Suffix: frequency, phase, or group delay measurement Parameters: <userunit> string Manual operation: "Unit Auto" on page 585 SENSe3:GROupdelay:REFerence <reference> Suffix: frequency, phase, or group delay measurement Parameters: <reference>...
- Page 825 ® Remote Control - Command Description R&S Combi Display SENSe<1|2|6>:LIMLower:VALue <value> Suffix: <1|2|6> specifies the type of measurement. 1 = function measurement (level / signal to noise / distortion, ...) 2 = input or second monitor measurement 6 = level monitor measurement Parameters: <value>...
- Page 826 ® Remote Control - Command Description R&S Combi Display SENSe3:PHASe:LIMLower <limlower> Suffix: frequency, phase, or group delay measurement Parameters: <limlower> ON | OFF Manual operation: "Limit Lower" on page 592 SENSe3:PHASe:LIMLower:VALue <value> Suffix: frequency, phase, or group delay measurement Parameters: <value>...
- Page 827 ® Remote Control - Command Description R&S Combi Display SENSe3:PHASe:REFerence:MODE <mode> Suffix: frequency, phase, or group delay measurement Parameters: <mode> STORe | VALue | GENTrack Manual operation: "Reference" on page 588 SENSe3:PHASe:RIGHt <right> Suffix: frequency, phase, or group delay measurement Parameters: <right>...
- Page 828 ® Remote Control - Command Description R&S Combi Display SENSe<1|2|6>:REFerence <reference> Suffix: <1|2|6> specifies the type of measurement. 1 = function measurement (level / signal to noise / distortion, ...) 2 = input or second monitor measurement 6 = level monitor measurement Parameters: <reference>...
-
Page 829: Softkey Commands Of The Graphical Display
® Remote Control - Command Description R&S Softkey Commands of the Graphical Display SENSe<1|2|6>:UNIT <unit> Suffix: <1|2|6> specifies the type of measurement. 1 = function measurement (level / signal to noise / distortion, ...) 2 = input or second monitor measurement 6 = level monitor measurement Parameters: <unit>... - Page 830 ® Remote Control - Command Description R&S Softkey Commands of the Graphical Display ● on page 820 DISPlay:BARGraph<n2>:OCURsor:SETTo:MAX ● on page 820 DISPlay:BARGraph<n2>:OCURsor:SETTo:MIN ● on page 822 DISPlay:BARGraph<n2>:OCURsor:SETTo:XPOS ● on page 822 DISPlay:BARGraph<n2>:OCURsor:SETTo:YPOS ● on page 823 DISPlay:BARGraph<n2>:OCURsor:STATe ● on page 823 DISPlay:BARGraph<n2>:OCURsor:Y? ●...
- Page 831 ® Remote Control - Command Description R&S Softkey Commands of the Graphical Display ● on page 820 DISPlay:FFT<n2>:XCURsor:SETTo:MIN ● on page 821 DISPlay:FFT<n2>:XCURsor:SETTo:MRKA ● on page 821 DISPlay:FFT<n2>:XCURsor:SETTo:MRKB ● on page 822 DISPlay:FFT<n2>:XCURsor:SETTo:XPOS ● on page 822 DISPlay:FFT<n2>:XCURsor:SETTo:YPOS ● on page 823 DISPlay:FFT<n2>:XCURsor:STATe ●...
- Page 832 ® Remote Control - Command Description R&S Softkey Commands of the Graphical Display ● on page 817 DISPlay:WAVeform<n2>:A:MARKer:SETTo:XCURsor ● on page 818 DISPlay:WAVeform<n2>:A:MARKer:SETTo:XPOS ● on page 817 DISPlay:WAVeform<n2>:B:MARKer:MODE ● on page 817 DISPlay:WAVeform<n2>:B:MARKer:SETTo:OCURsor ● on page 817 DISPlay:WAVeform<n2>:B:MARKer:SETTo:XCURsor ● on page 818 DISPlay:WAVeform<n2>:B:MARKer:SETTo:XPOS ●...
- Page 833 ® Remote Control - Command Description R&S Softkey Commands of the Graphical Display Display of the harmonics is switched off. Example: DISPlay:FFT2:A:MARKer:HARMonics ON DISPlay:FFT<n2>:A:MARKer:MODE <mode> DISPlay:FFT<n2>:B:MARKer:MODE <mode> DISPlay:WAVeform<n2>:A:MARKer:MODE <mode> DISPlay:WAVeform<n2>:B:MARKer:MODE <mode> DISPlay:SWEep<n2>:A:MARKer:MODE <mode> DISPlay:SWEep<n2>:B:MARKer:MODE <mode> Corresponds to softkey operation: Marker, Trace A | Trace B, Off | Track to Max Parameters:...
- Page 834 ® Remote Control - Command Description R&S Softkey Commands of the Graphical Display O Cursor | X Cursor Parameters: <state> ONCE | EXEC ONCE or EXEC can also be omitted. ONCE Set marker to position of O cursor | X cursor EXEC Alias to ONCE.
- Page 835 ® Remote Control - Command Description R&S Softkey Commands of the Graphical Display Cursor X cursor, X Vert A | X Vert B | X Vert A-B, X Hor A | X Hor B Parameters: <mode> VA | VB | VAB | HA | HB O cursor becomes vertical cursor on trace A Same on trace B Same on trace A and trace B and shows difference between Y...
- Page 836 ® Remote Control - Command Description R&S Softkey Commands of the Graphical Display PEAK Same between partial curve peaks HARMonic Same in the FFT display between harmonics Example: DISPlay:WAVeform:OCURsor:POSMode POINt DISPlay:FFT<n2>:OCURsor:SETTo:MAX <state> DISPlay:FFT<n2>:XCURsor:SETTo:MAX <state> DISPlay:WAVeform<n2>:OCURsor:SETTo:MAX <state> DISPlay:WAVeform<n2>:XCURsor:SETTo:MAX <state> DISPlay:BARGraph<n2>:OCURsor:SETTo:MAX <state> DISPlay:BARGraph<n2>:XCURsor:SETTo:MAX <state>...
- Page 837 ® Remote Control - Command Description R&S Softkey Commands of the Graphical Display Parameters: <state> ONCE | EXEC ONCE or EXEC can also be omitted. ONCE Sets O cursor | X Cursor to trace minimum. EXEC Alias to ONCE. Example: DISPlay:SWEep4:XCURsor:SETTo:MIN DISPlay:SWEep4:XCURsor:SETTo:MIN ONCE DISPlay:SWEep4:XCURsor:SETTo:MIN EXEC...
- Page 838 ® Remote Control - Command Description R&S Softkey Commands of the Graphical Display Cursor Set O cursor | Set X cursor, Marker B Parameters: <state> ONCE | EXEC | OFF DISPlay:FFT<n2>:OCURsor:SETTo:XPOS <xpos> DISPlay:FFT<n2>:XCURsor:SETTo:XPOS <xpos> DISPlay:WAVeform<n2>:OCURsor:SETTo:XPOS <xpos> DISPlay:WAVeform<n2>:XCURsor:SETTo:XPOS <xpos> DISPlay:BARGraph<n2>:OCURsor:SETTo:XPOS <xpos> DISPlay:BARGraph<n2>:XCURsor:SETTo:XPOS <xpos>...
- Page 839 ® Remote Control - Command Description R&S Softkey Commands of the Graphical Display Parameters: <ypos> float Sets O cursor | X Cursor to the defined value, if a horizontal cur- sor is involved. The unit in which the value is entered depends on the unit of the Y-axis.
-
Page 840: Transferring Trace Data
® Remote Control - Command Description R&S Transferring trace data Return values: <argument> float Return value: Reads the current value of the O cursor or X cursor. The return value is a pure numeric value without unit.The numeric value is returned in the unit in which the Y-axis is displayed. - Page 841 ® Remote Control - Command Description R&S Transferring trace data ● on page 825 TRACe:BARGraph<n2>:STORe:AY ● on page 825 TRACe:BARGraph<n2>:STORe:BY ● on page 826 TRACe:FFT<n2>:STORe:AY ● on page 826 TRACe:FFT<n2>:STORe:BY ● on page 825 TRACe:SWEep<n2>:STORe:AX ● on page 825 TRACe:SWEep<n2>:STORe:AY ●...
-
Page 842: User-Definable Data Buffers
® Remote Control - Command Description R&S User-definable data buffers TRACe:FFT<n2>:STORe:AY <ay> TRACe:FFT<n2>:STORe:BY <by> Commands for saving FFT graph trace data sets. Commands ...:AX and ..:BX are not allowed. Suffix: <n2> subsystem number 1 and 2 Parameters: <by> float TRACe:WAVeform<n2>:STORe:AY <ay> TRACe:WAVeform<n2>:STORe:BY <by>... - Page 843 ® Remote Control - Command Description R&S User-definable data buffers Table 7-2: Comparision of commands SYSTem:MEMory:DATA and TRACe:SWEep<i>:LOAD A query of the data buffer returns the data using A query returns the trace data using the selected the basic unit unit and number.
-
Page 844: Hardcopy
® Remote Control - Command Description R&S Hardcopy SYSTem:MEMory:FREE <free> The command deletes the contents of the string or data buffer. Parameters: <free> STRing | DATA STRing deletes the contents of all string buffers. After deletion, the query SYSTem:MMEMory:STRing<n3>? returns the string <empty> . DATA deletes the contents of all data buffers. - Page 845 ® Remote Control - Command Description R&S Hardcopy ● on page 829 HCOPy:GSIZe ● on page 830 HCOPy:PRINter:ADDition ● on page 830 HCOPy:PRINter:FOOTer ● on page 830 HCOPy:PRINter:HEADer ● on page 830 HCOPy:PRINter:ORIentation ● on page 829 HCOPy:SOURce HCOPy:DESTination <destination> Parameters: <destination>...
-
Page 846: Mmemory Subsystem
® Remote Control - Command Description R&S MMEMory Subsystem HCOPy:PRINter:ORIentation <orientation> Parameters: <orientation> PORTrait | LANDscape Manual operation: "Orientation" on page 496 HCOPy:PRINter:ADDition <addition> Parameters: <addition> ON | OFF Manual operation: "Header/Footer " on page 496 HCOPy:PRINter:HEADer <header> Parameters: <header> string Manual operation: "Define Header"... -
Page 847: File Naming Conventions
® Remote Control - Command Description R&S MMEMory Subsystem 7.30.1 File Naming Conventions To enable files in different file systems to be used, the following file naming conven- tions should be observed. The file name can be of any length and no distinction is made between uppercase and lowercase letters. -
Page 848: Load And Store Setups
® Remote Control - Command Description R&S MMEMory Subsystem In all commands for data transmission, the data for both paths is always transmitted simultaneously. 7.30.2 Load and store setups In all commands for data transmission, the data for both paths is always transmitted simultaneously. - Page 849 ® Remote Control - Command Description R&S MMEMory Subsystem ● on page 833 MMEMory:DATA ● on page 834 MMEMory:MDIRectory ● on page 834 MMEMory:MOVE MMEMory:COPY <source>,[<destination>] This command copies the first specified file to the second specified file. You can also use this command to copy a complete directory, including all of its files, rather than a single file.
- Page 850 ® Remote Control - Command Description R&S MMEMory Subsystem <Length> specifies the number of subsequent bytes (34 in the example)<binary block data> binary block data of the specified length Example: MMEM:DATA 'TEST1.WV',#3767<binary data> Writes the block data to file 'test1.wv'. MMEM:DATA? 'TEST1.WV' transmits the data of file'Test1.wv' as binary block from the R&S UPP to the controller.
-
Page 851: Status Subsystem
® Remote Control - Command Description R&S STATus Subsystem 7.31 STATus Subsystem This system contains the commands for the status reporting system. *RST has no effect on the status registers. Queries return the current value of the respective register, which permits a check of the device status. - Page 852 ® Remote Control - Command Description R&S STATus Subsystem ● on page 839 STATus:QUEStionable:UNDerrange:EVENt? ● on page 839 STATus:QUEStionable:UNDerrange:NTRansition ● on page 840 STATus:QUEStionable:UNDerrange:PTRansition ● on page 844 STATus:QUEue:NEXT? ● on page 842 STATus:XQUEstionabl:CONDition? ● on page 843 STATus:XQUEstionabl:ENABle ● on page 843 STATus:XQUEstionabl:EVENt? ●...
- Page 853 ® Remote Control - Command Description R&S STATus Subsystem Parameters: <integer> 0...32767 STATus:OPERation:EVENt? The command queries the content of the EVENt part of the STATus:OPERation reg- ister. This part contains the information about the current instrument state since the last readout.
- Page 854 ® Remote Control - Command Description R&S STATus Subsystem Usage: Query only STATus:QUEStionable:ENABle <integer> The command sets the bits of the ENABle part of the STATus:QUEStionable regis- ter. This setting determines which events of the EVENt part of the STATus:QUEStionable register are to be passed on to the summary bit of the status byte.
- Page 855 ® Remote Control - Command Description R&S STATus Subsystem STATus:QUEStionable:UNDerrange:CONDition? The command queries the content of the CONDition part of the STATus:QUEStionable:UNDERrange register. This part contains the information about which channel of a multichannel instrument is underranged. Reading the information does not clear the register. Return values: <argument>...
- Page 856 ® Remote Control - Command Description R&S STATus Subsystem STATus:QUEStionable:UNDerrange:PTRansition <integer> The command sets the bits of the PTRansition part of the STATus:QUEStionable:UNDERrange register. A bit set in the PTRansition part causes a bit transition from 1 to 0 in the CONDition part to produce an entry in the EVENt part of the register.
- Page 857 ® Remote Control - Command Description R&S STATus Subsystem STATus:QUEStionable:OVERrange:NTRansition <integer> The command sets the bits of the NTRansition part of the STATus:QUEStionable:OVERrange register. A bit set in the NTRansition part causes a bit transition from 1 to 0 in the CONDition part to produce an entry in the EVENt part of the register.
- Page 858 ® Remote Control - Command Description R&S STATus Subsystem STATus:QUEStionable:MEASuring:EVENt? The command queries the content of the EVENt part of the STATus:QUEStionable:MEASuring register. This part contains the information about the current instrument state since the last readout. A bit set in the EVENt register indicates a change of the corresponding bit in the CONDition register.
- Page 859 ® Remote Control - Command Description R&S STATus Subsystem Usage: Query only STATus:XQUEstionabl:ENABle <integer> The command sets the bits of the ENABle part of the STATus:XQUEstionable regis- ter. This setting determines which events of the EVENt part of the STATus:XQUEStionable register are to be passed on to the summary bit of the sta- tus byte.
-
Page 860: System Subsystem
® Remote Control - Command Description R&S SYSTem Subsystem Parameters: <integer> 0...32767 STATus:QUEue:NEXT? This command is identical to the SYSTem:ERRor command Return values: <argument> integer Usage: Query only 7.32 SYSTem Subsystem The SYSTem subsystem contains a series of commands for general functions. ●... - Page 861 ® Remote Control - Command Description R&S SYSTem Subsystem SYSTem:CHNString <chnstring> Parameters: <chnstring> string Manual operation: "Channel Descr." on page 498 SYSTem:COMMunicate:GTL This command switches the instrument to local operation. SYSTem:COMMunicate:GPIB:ADDRess <address> This command sets the IEC/IEEE bus address. Parameters: <address>...
- Page 862 ® Remote Control - Command Description R&S SYSTem Subsystem SYSTem:DISPlay:EXPLanation<n3>:TEXT <text> Suffix: <n3> 1 to 10 Index of comment window for which the text is defined. Parameters: <text> string Text that is indicated in the selected comment window. SYSTem:DISPlay:EXPLanation<n3>:HIDE The command hides the selected comment window. Suffix: <n3>...
- Page 863 ® Remote Control - Command Description R&S SYSTem Subsystem Manual operation: "Graphic profile" on page 632 SYSTem:PROFile:PRINter <file> Parameters: <file> string Manual operation: "Graphic profile" on page 632 SYSTem:PROFile:SCReen <file> Parameters: <file> string Manual operation: "Graphic profile" on page 632 SYSTem:PROGramm:EXECute <execute>...
- Page 864 ® Remote Control - Command Description R&S SYSTem Subsystem Example: SYSTem:SHTDown SYSTem:SHUtdown Shuts down the R&S UPP immediately. Usage: Event SYSTem:SINFo <sinfo> Input of comment for current setup. The comment is stored together with the setup. After a reload of the setup, the comment can be retrieved using command SYSTem:INFo?.
-
Page 865: Cascading
® Cascading R&S Order Code of Instruments 8 Cascading 8.1 Overview If a measurement application requires the synchronous analysis of more than 8 chan- nels, it is possible to cascade multiple R&S UPP instruments. A cascade always consists of an 8‑channel master R&S UPP and one or more slave instruments, which can each be equipped with 2, 4, or 8 channels. -
Page 866: Connection Of A Cascade
® Cascading R&S Connection of a Cascade The R&S order numbers for the 2, 4, and 8‑channel variants are 1411.1003.02, 1411.1003.04 and 1411.1003.08 respectively. 8.3 Connection of a Cascade 8.3.1 Clock Lines In a cascade, all measuring instruments involved are supplied with a common refer- ence clock signal to enable synchronous measured value acquisition. -
Page 867: Communication Lines
® Cascading R&S Connection of a Cascade Commercially available 50 Ω BNC cables are used as connecting lines. Starting measured value acquisition via the trigger line is not yet implemented and is performed via the LAN connection of the instruments. For phase measurement, a "Ref Channel"... -
Page 868: Numbering Of Channels
® Cascading R&S Connection of a Cascade The limiting factor for the depth of a cascade is the signal delays on clock and trigger lines, which is why the shortest possible cables should be used. The maximum depth of a cascade is 5 slaves. 8.3.4 Numbering of Channels Regardless of whether a cascade comprises R&S UPP instruments of different var- iants (R&S UPP800, R&S UPP400, R&S UPP200), the channels are always numbered... - Page 869 ® Cascading R&S Connection of a Cascade The numbering of the slaves must begin with 1 and be continuous, otherwise the num- bering of the channels will not be continuous in the measured value display of the mas- ter. Channels that are switched off are not omitted from the numbering – they simply do not provide any measurement result (OFF appears in the numeric display and the value 9.91e+38 appears in remote operation).
-
Page 870: Configuration Of A Cascade
® Cascading R&S Configuration of a Cascade 8.4 Configuration of a Cascade 8.4.1 Configuration Using CASCADE Button A cascade is configured once. The instruments each "remember" their respective role (Master, Slave#) after being switched off and retain their state until they are explicitly reset and reconfigured. - Page 871 ® Cascading R&S Configuration of a Cascade Every master that has never been configured before is initially in the MAS- TER_STANDALONE state. By pressing the CASCADE button once, the state changes to WAIT- ING_FOR_SLAVES, i.e. waiting for connection requests from slave devices, the con- figuration of which is explained in the next chapter.
- Page 872 ® Cascading R&S Configuration of a Cascade WAITING_FOR_SLAVES Master is waiting for connection requests from slave devices. MASTER_CASCADED At least one slave has been successfully integrated in the cascade. TRY TO CONNECT Rapid flashing indicates that a connection is being set up, e.g. after power‑up or if the cascade is incomplete because, for example, an instrument has not been switched on.
- Page 873 ® Cascading R&S Configuration of a Cascade Every slave that has never been configured before is initially in the SLAVE_STAND- ALONE state. Pressing the CASCADE button once causes the slave to change to the SLAVE_SHOW_STATUS state in which it visualizes its state (not cascaded, Slave#x) by means of a flashing signal sequence at the "CASCADE LED".
- Page 874 ® Cascading R&S Configuration of a Cascade Initial state of a slave device. A connection to the master has not yet been set up. SLAVE_SHOW_STATUS Slave displays its position within the cascade. Figure 8-1: Not cascaded. Figure 8-2: Slave#1 Figure 8-3: Slave#2 Figure 8-4: Slave#3 Figure 8-5: Slave#4 Figure 8-6: Slave#5...
- Page 875 ® Cascading R&S Configuration of a Cascade Figure 8-8: Slave#2 Figure 8-9: Slave#3 Figure 8-10: Slave#4 Figure 8-11: Slave#5 SLAVE_CASCADED CASCADED_SLAVE_SHOW_STATUS Like SLAVE_SHOW_STATUS. TRY TO CONNECT Rapid flashing indicates that a connection is being set up, e.g. after power‑up or if the cascade is incomplete because, for example, an instrument has not been switched on.
-
Page 876: Examples Of Cascade Configuration
® Cascading R&S Configuration of a Cascade 8.4.2 Examples of Cascade Configuration 8.4.2.1 Formation of a Cascade Consisting of Two Standalone Devices Requirements: ● Two standalone devices are cabled together in the way described under Chap- ter 8.3, "Connection of a Cascade", on page 850. -
Page 877: Switching Cascade Off And On Again
® Cascading R&S Configuration of a Cascade 8.4.2.2 Adding Additional Slaves The master is again prepared by briefly pressing the CASCADE/LAN RESET button. The CASCADE LED now lights up with brief OFF phases, thereby signaling that an additional slave can now log on at the master. When the button on the slave is pressed briefly, the CASCADE LED indicates the cur- rent slave number by briefly flashing. -
Page 878: Status And Errors During Connection Setup
® Cascading R&S Configuration of a Cascade Possible LAN reset With standalone devices, holding down the button for longer than 5 seconds corre- sponds to a LAN reset with the following result: resetting of the LXI LAN default set- tings to DHCP + AutoIP / VXI-11 discovery on and restarting of the instrument. 8.4.5 Status and Errors During Connection Setup The connection log can be viewed to check setup of the connection. -
Page 879: Operating Modes
® Cascading R&S Manual Operation of a Cascade is already being used by another tool when the firmware starts, the error message "Could not open cascading server port. Please change the cascading port number." appears. If a connection has already been established between the master and slave but the port number is also being used by software on other PCs in the LAN, the error mes- sage "Cascading data handshake failed. - Page 880 ® Cascading R&S Manual Operation of a Cascade 8.6.1.1 GUI Control ALL Selecting "All" makes it possible to apply the settings made for the master to all slaves. This operating mode is recommended if the entire cascade is to behave like an instru- ment with many channels.
- Page 881 ® Cascading R&S Manual Operation of a Cascade can only be selected at the master. Trigger channel settings on the slave instruments are possible but they have no effect within the cascade. Channel selection The channels selected in the "Analyzer Config" panel of the analog instrument (Meas Channels) are forwarded to the slaves 1:1.
- Page 882 ® Cascading R&S Manual Operation of a Cascade If "AC/DC Coupl" = "Split" was selected in the "Analyzer Config" panel of the master, the "Chx Coupling" settings of the master are transferred to all slaves. To set particular channels on the slave devices, select the "GUI Control" = "Slave XX" setting. Range The relationships described for coupling also apply in the same way for "Range"...
-
Page 883: Remote Control
® Cascading R&S Remote Control 8.6.1.3 GUI Control Slave xx Settings in the GUI of the master have a direct effect on a particular slave. If the selected slave is not in the cascade, an error message is output. The setting options of the selected slave are mirrored in the user interface of the mas- ter. - Page 884 ® Cascading R&S Remote Control SENSe:FUNCtion RMS The RMS measurement function is set in the master and in all slaves. Commands addressing a specific channel In the R&S UPP there are few commands that are channel‑related. If the cascade is to behave like a single instrument, i.e.
-
Page 885: Query Commands
® Cascading R&S Remote Control 8.7.3 Query Commands 8.7.3.1 Query for Setting Commands CASCade:ASSignment ALL Commands addressing a specific channel are sent from the master – without intervention by the user – to the corresponding instrument which then returns the unique query response. Example: INPut:MCHannel20? Response: ON... - Page 886 ® Cascading R&S Remote Control 8.7.3.2 Query Commands for Measurement Results and Graphic Data Sets CASCade:ASSignment ALL The regular SENS:DATA command is channel-based and, therefore, is sent to the cor- responding instrument, e.g. SENS:DATA20? If the cascade has been composed only of 8-channel instruments, this command queries the measurement result of the 2nd slave and its channel 4.
- Page 887 ® Cascading R&S Remote Control TRACe:FFT:LOAD:AY? Possible response: " -119.95,-118.828,-119.796,-121.799,-122.835,…" CASC:ASS SLAVE02 TRACe:FFT:LOAD:AY? Possible response: " -123.181,-118.682,-117.495,-119.492,-121.138,…" CASC:ASS ALL CASCade:ASSignment MASTer Query commands that are issued in this operating mode always return only a single query response. The channel specification for channel‑related commands must be ≤ 8, otherwise an error message is output.
- Page 888 ® Cascading R&S Remote Control CASCade:ASSignment SLAVexx The content of the error queue of the master is returned even if the SYST:ERR? com- mand is specifically sent to a slave. The error queue of a slave cannot be queried – it would always be empty anyway because the slaves immediately send their error mes- sages to the master.
- Page 889 ® Cascading R&S Remote Control By comparison, the following figure shows the status registers of a R&S UPP as a standalone instrument. User Manual 1411.1055.32 ─ 10...
- Page 890 ® Cascading R&S Remote Control Figure 8-12: Overview of status registers Overview The status system of the R&S UPP has only minor differences between cascaded mode and standalone mode. For a detailed description of the registers, refer to Chap- User Manual 1411.1055.32 ─ 10...
- Page 891 ® Cascading R&S Remote Control ter 6.8, "Status Reporting System", on page 663. The following extensions are active in cascaded mode: Error queue If an error occurs on a slave during remote control, it is entered into the error queue directly on the master. There, the error queue can be queried. ESR register If an error occurs on one of the slaves, the corresponding error bit is set immedi- ately in the ESR register.
- Page 892 ® Cascading R&S Remote Control *OPT? Option identification query With the CASCade:ASSignement ALL setting, the master sends the command to all slaves and to itself and returns the options installed in all instruments in the cascade, separated by "|". Example: "B4(01.01),K21(01.00),K41(01.00),K42(01.00),K45(01.00),K601(01.00),K800(01.00)| B8(01.01),K21(01.00),K41(01.00),K42(01.00),K45(01.00),K601(01.00),K800(01.00) "...
-
Page 893: Generators In Cascade
® Cascading R&S Switcher Control in Cascade All instruments in the cascade report their states (as summary information where nec- essary) to the master; for this reason, all common commands (except *OPT?) are only allowed to be used in conjunction with CASCade:ASSignement ALL. Sending these commands specifically to a slave would cause unexpected information to be displayed. -
Page 894: Maintenance And Instrument Interfaces
® Maintenance and Instrument Interfaces R&S Changing the AC Supply Fuse 9 Maintenance and Instrument Interfaces 9.1 Introduction - Maintenance and Interfaces The following chapter contains information on maintaining the audio analyzer and also describes the instrument interfaces. How to change a module and order spare parts is described in the service manual. The service manual also contains all the ID numbers required for ordering spare parts. -
Page 895: Instrument Interfaces
® Maintenance and Instrument Interfaces R&S Instrument Interfaces Damage of instrument when using wrong fuses Using wrong fuses may cause damage of the instrument. Changing the AC supply fuses: 1. Disconnect the power cable. 2. Pry out the fuse holder with two small screwdrivers or similar tools. 3. - Page 896 ® Maintenance and Instrument Interfaces R&S Instrument Interfaces Figure 9-1: Pin assignment of IEC/IEEE-bus interface 9.4.1.2 IEC/IEEE-bus lines ● Data bus with 8 lines DIO 1...DIO 8 Data is transferred parallel by bit and serial by byte in ASCII/ISO code. DIO1 is the bit with the lowest value and DIO8 the bit with the highest value.
- Page 897 ® Maintenance and Instrument Interfaces R&S Instrument Interfaces Active LOW signals that one of the connected instruments is not ready to receive data. – NDAC (Not Data Accepted): Active LOW while the connected instrument is receiving the data on the data bus.
-
Page 898: Ethernet Interface (Lan)
® Maintenance and Instrument Interfaces R&S Instrument Interfaces Table 9-2: Universal commands Command VISUAL BASIC command Effect on instrument DCL (Device Clear) IBCMD (controller%, CHR$(20)) Terminates processing of the commands that have just been received, and sets the command- processing software to a defined initial state. - Page 899 ® Maintenance and Instrument Interfaces R&S Instrument Interfaces nection-mode communication where the sequence of the exchanged messages is retained and interrupted connections are detected. Furthermore, messages cannot be lost if this protocol is used. Connection of the R&S UPP is described in Chapter 2.10.1, "Connection to the Net- work", on page 45, and remote control via Ethernet is described in...
- Page 900 ® Maintenance and Instrument Interfaces R&S Instrument Interfaces Figure 9-3: Channels between instrument and controller with VXI-11 The number of controllers which can access an instrument is virtually unlimited in the network. In the instrument, a clear distinction is made between the individual control- lers.
-
Page 901: Usb Device Port
® Maintenance and Instrument Interfaces R&S Instrument Interfaces 9.4.2.1 VXI-11 interface messages With Ethernet connections, the interface messages are referred to as low-level control messages. They can be used to emulate the interface messages of the IEC/IEEE bus. Table 9-4: VXI-11 interface messages Command Effect on instrument &ABO... -
Page 902: Monitor Connection (Dvi-D)
® Maintenance and Instrument Interfaces R&S Instrument Interfaces Remote control via USB is described in Chapter 6.3.3, "Remote Control via the USB Device Interface", on page 646. 9.4.3.1 USB device interface messages In the case of a USB device link, the interface messages are called "Low-Level Control Messages". - Page 903 ® Maintenance and Instrument Interfaces R&S Instrument Interfaces Signal Signal Signal Shielding DDC-clock Hotplug detect CRT red DDC-data Data 0- blue CRT green Data 0+ blue CRT blue Data 1- green Shielding CRT HSync Data 1+ green CRT-ground User Manual 1411.1055.32 ─ 10...
-
Page 904: List Of Commands
® List of Commands R&S List of Commands *CLS................................685 *ESE................................685 *ESR?................................685 *GTL................................685 *IDN?................................685 *IST?................................686 *OPC................................686 *OPC?................................686 *OPT?................................686 *PRE................................686 *PSC................................687 *RST................................687 *SRE................................687 *STB?................................687 *TRG................................687 *WAI................................688 ABORt................................733 ARM:FREQuency:STARt..........................735 ARM:FREQuency:STOP..........................735 ARM:LEVel:MIN.............................735 ARM:VOLTage:STARt............................736 ARM:VOLTage:STOP............................ 736 AUXiliaries:AUDMonitor..........................777 AUXiliaries:SIGSource...........................777 AUXiliaries:SPEaker:MONitor<n3>........................778... - Page 905 ® List of Commands R&S DISPlay:BARGraph<n2>:A:LEGend:DESCription..................791 DISPlay:BARGraph<n2>:A:LEGend:SHOW....................791 DISPlay:BARGraph<n2>:A:LIMLower......................791 DISPlay:BARGraph<n2>:A:LIMLower:SOURce.................... 792 DISPlay:BARGraph<n2>:A:LIMLower:SOURce:FILE................... 792 DISPlay:BARGraph<n2>:A:LIMLower:SOURce:VALue................792 DISPlay:BARGraph<n2>:A:LIMShift......................792 DISPlay:BARGraph<n2>:A:LIMShift:PARallel....................793 DISPlay:BARGraph<n2>:A:LIMShift:SYMMetrical..................793 DISPlay:BARGraph<n2>:A:LIMUpper......................793 DISPlay:BARGraph<n2>:A:LIMUpper:SOURce.................... 794 DISPlay:BARGraph<n2>:A:LIMUpper:SOURce:FILE................... 794 DISPlay:BARGraph<n2>:A:LIMUpper:SOURce:VALue................794 DISPlay:BARGraph<n2>:A:NORMalize......................794 DISPlay:BARGraph<n2>:A:NORMalize:VALue..................... 795 DISPlay:BARGraph<n2>:A:REFerence......................795 DISPlay:BARGraph<n2>:A:REFerence:FILE....................795 DISPlay:BARGraph<n2>:A:REFerence:VALue..................... 795 DISPlay:BARGraph<n2>:A:SPACing......................796 DISPlay:BARGraph<n2>:A:TOP........................796 DISPlay:BARGraph<n2>:A:UNIT........................796 DISPlay:BARGraph<n2>:A:UNIT:AUTO......................
- Page 906 ® List of Commands R&S DISPlay:BARGraph<n2>:B:TOP........................796 DISPlay:BARGraph<n2>:B:UNIT........................796 DISPlay:BARGraph<n2>:B:UNIT:AUTO......................797 DISPlay:BARGraph<n2>:B:UNIT:TRACk...................... 797 DISPlay:BARGraph<n2>:B:UNIT:USER......................797 DISPlay:BARGraph<n2>:B:UPDate......................797 DISPlay:BARGraph<n2>:B:YSOurce......................798 DISPlay:BARGraph<n2>:B:YSOurce:FILE....................798 DISPlay:BARGraph<n2>:COPYother......................798 DISPlay:BARGraph<n2>:DLISt:FILTer......................799 DISPlay:BARGraph<n2>:MCHMode......................800 DISPlay:BARGraph<n2>:MINMax......................... 799 DISPlay:BARGraph<n2>:OCURsor:MODE....................818 DISPlay:BARGraph<n2>:OCURsor:POSMode..................... 819 DISPlay:BARGraph<n2>:OCURsor:SETTo:MAX..................820 DISPlay:BARGraph<n2>:OCURsor:SETTo:MIN................... 820 DISPlay:BARGraph<n2>:OCURsor:SETTo:XPOS..................822 DISPlay:BARGraph<n2>:OCURsor:SETTo:YPOS..................822 DISPlay:BARGraph<n2>:OCURsor:STATe....................823 DISPlay:BARGraph<n2>:OCURsor:Y?......................
- Page 907 ® List of Commands R&S DISPlay:FFT<n2>:A:LIMUpper:SOURce:VALue................... 794 DISPlay:FFT<n2>:A:MARKer:HARMonics....................816 DISPlay:FFT<n2>:A:MARKer:MODE......................817 DISPlay:FFT<n2>:A:MARKer:SETTo:OCURsor....................817 DISPlay:FFT<n2>:A:MARKer:SETTo:XCURsor.................... 817 DISPlay:FFT<n2>:A:MARKer:SETTo:XPOS....................818 DISPlay:FFT<n2>:A:NORMalize........................794 DISPlay:FFT<n2>:A:NORMalize:VALue......................795 DISPlay:FFT<n2>:A:REFerence........................795 DISPlay:FFT<n2>:A:REFerence:FILE......................795 DISPlay:FFT<n2>:A:REFerence:VALue......................795 DISPlay:FFT<n2>:A:SPACing........................796 DISPlay:FFT<n2>:A:TOP..........................796 DISPlay:FFT<n2>:A:UNIT..........................796 DISPlay:FFT<n2>:A:UNIT:AUTO........................796 DISPlay:FFT<n2>:A:UNIT:TRACk......................... 797 DISPlay:FFT<n2>:A:UNIT:USER........................797 DISPlay:FFT<n2>:A:UPDate......................... 797 DISPlay:FFT<n2>:A:YSOurce........................797 DISPlay:FFT<n2>:A:YSOurce:FILE.......................798 DISPlay:FFT<n2>:B:BOTTom........................790 DISPlay:FFT<n2>:B:CHANnel........................790 DISPlay:FFT<n2>:B:LABel:AUTO.........................
- Page 908 ® List of Commands R&S DISPlay:FFT<n2>:B:UNIT:AUTO........................796 DISPlay:FFT<n2>:B:UNIT:TRACk......................... 797 DISPlay:FFT<n2>:B:UNIT:USER........................797 DISPlay:FFT<n2>:B:UPDate......................... 797 DISPlay:FFT<n2>:B:YSOurce........................797 DISPlay:FFT<n2>:B:YSOurce:FILE.......................798 DISPlay:FFT<n2>:COPYother........................798 DISPlay:FFT<n2>:DLISt:FILTer........................798 DISPlay:FFT<n2>:MCHMode........................800 DISPlay:FFT<n2>:MINMax..........................799 DISPlay:FFT<n2>:OCURsor:MODE......................818 DISPlay:FFT<n2>:OCURsor:POSMode......................819 DISPlay:FFT<n2>:OCURsor:SETTo:MAX..................... 820 DISPlay:FFT<n2>:OCURsor:SETTo:MIN...................... 820 DISPlay:FFT<n2>:OCURsor:SETTo:MRKA....................821 DISPlay:FFT<n2>:OCURsor:SETTo:MRKB....................821 DISPlay:FFT<n2>:OCURsor:SETTo:XPOS....................822 DISPlay:FFT<n2>:OCURsor:SETTo:YPOS....................822 DISPlay:FFT<n2>:OCURsor:STATe......................823 DISPlay:FFT<n2>:OCURsor:Y?........................823 DISPlay:FFT<n2>:SCANoffset........................741 DISPlay:FFT<n2>:TITLe:DESCription......................
- Page 909 ® List of Commands R&S DISPlay:SWEep<n2>:A:LEGend:DESCription....................791 DISPlay:SWEep<n2>:A:LEGend:SHOW.......................791 DISPlay:SWEep<n2>:A:LIMLower........................ 791 DISPlay:SWEep<n2>:A:LIMLower:SOURce....................792 DISPlay:SWEep<n2>:A:LIMLower:SOURce:FILE..................792 DISPlay:SWEep<n2>:A:LIMLower:SOURce:VALue..................792 DISPlay:SWEep<n2>:A:LIMShift........................793 DISPlay:SWEep<n2>:A:LIMShift:PARallel....................793 DISPlay:SWEep<n2>:A:LIMShift:SYMMetrical....................793 DISPlay:SWEep<n2>:A:LIMUpper........................ 793 DISPlay:SWEep<n2>:A:LIMUpper:SOURce....................794 DISPlay:SWEep<n2>:A:LIMUpper:SOURce:FILE..................794 DISPlay:SWEep<n2>:A:LIMUpper:SOURce:VALue..................794 DISPlay:SWEep<n2>:A:MARKer:MODE.......................817 DISPlay:SWEep<n2>:A:MARKer:SETTo:OCURsor..................817 DISPlay:SWEep<n2>:A:MARKer:SETTo:XCURsor..................817 DISPlay:SWEep<n2>:A:MARKer:SETTo:XPOS....................818 DISPlay:SWEep<n2>:A:NORMalize......................794 DISPlay:SWEep<n2>:A:NORMalize:VALue....................795 DISPlay:SWEep<n2>:A:REFerence......................795 DISPlay:SWEep<n2>:A:REFerence:FILE..................... 795 DISPlay:SWEep<n2>:A:REFerence:VALue....................795 DISPlay:SWEep<n2>:A:SPACing........................796 DISPlay:SWEep<n2>:A:TOP.........................796 DISPlay:SWEep<n2>:A:UNIT........................796 DISPlay:SWEep<n2>:A:UNIT:AUTO......................
- Page 910 ® List of Commands R&S DISPlay:SWEep<n2>:B:MARKer:SETTo:XCURsor..................817 DISPlay:SWEep<n2>:B:MARKer:SETTo:XPOS....................818 DISPlay:SWEep<n2>:B:NORMalize......................794 DISPlay:SWEep<n2>:B:NORMalize:VALue....................795 DISPlay:SWEep<n2>:B:REFerence......................795 DISPlay:SWEep<n2>:B:REFerence:FILE..................... 795 DISPlay:SWEep<n2>:B:REFerence:VALue....................795 DISPlay:SWEep<n2>:B:SPACing........................796 DISPlay:SWEep<n2>:B:TOP.........................796 DISPlay:SWEep<n2>:B:UNIT........................796 DISPlay:SWEep<n2>:B:UNIT:AUTO......................797 DISPlay:SWEep<n2>:B:UNIT:TRACk......................797 DISPlay:SWEep<n2>:B:UNIT:USER......................797 DISPlay:SWEep<n2>:B:UPDate........................797 DISPlay:SWEep<n2>:B:YSOurce........................798 DISPlay:SWEep<n2>:B:YSOurce:FILE......................798 DISPlay:SWEep<n2>:COPYother......................... 798 DISPlay:SWEep<n2>:DLISt:FILTer........................799 DISPlay:SWEep<n2>:HISTory........................799 DISPlay:SWEep<n2>:MINMax........................799 DISPlay:SWEep<n2>:OCURsor:MODE......................818 DISPlay:SWEep<n2>:OCURsor:POSMode....................819 DISPlay:SWEep<n2>:OCURsor:SETTo:MAX....................820 DISPlay:SWEep<n2>:OCURsor:SETTo:MIN....................820 DISPlay:SWEep<n2>:OCURsor:SETTo:MRKA.....................821 DISPlay:SWEep<n2>:OCURsor:SETTo:MRKB.....................821 DISPlay:SWEep<n2>:OCURsor:SETTo:XPOS.....................
- Page 911 ® List of Commands R&S DISPlay:SWEep<n2>:XCURsor:POSMode....................819 DISPlay:SWEep<n2>:XCURsor:SETTo:MAX....................820 DISPlay:SWEep<n2>:XCURsor:SETTo:MIN....................820 DISPlay:SWEep<n2>:XCURsor:SETTo:MRKA..................... 821 DISPlay:SWEep<n2>:XCURsor:SETTo:MRKB..................... 821 DISPlay:SWEep<n2>:XCURsor:SETTo:XPOS....................822 DISPlay:SWEep<n2>:XCURsor:SETTo:YPOS....................822 DISPlay:SWEep<n2>:XCURsor:STATe......................823 DISPlay:SWEep<n2>:XCURsor:Y?....................... 823 DISPlay:WAVeform<n2>:A:BOTTom......................790 DISPlay:WAVeform<n2>:A:CHANnel......................790 DISPlay:WAVeform<n2>:A:LABel:AUTO....................... 790 DISPlay:WAVeform<n2>:A:LABel:USER....................... 790 DISPlay:WAVeform<n2>:A:LEGend:DESCription..................791 DISPlay:WAVeform<n2>:A:LEGend:SHOW....................791 DISPlay:WAVeform<n2>:A:LIMLower......................791 DISPlay:WAVeform<n2>:A:LIMLower:SOURce.....................792 DISPlay:WAVeform<n2>:A:LIMLower:SOURce:FILE..................792 DISPlay:WAVeform<n2>:A:LIMLower:SOURce:VALue................. 792 DISPlay:WAVeform<n2>:A:LIMShift......................792 DISPlay:WAVeform<n2>:A:LIMShift:PARallel....................793 DISPlay:WAVeform<n2>:A:LIMShift:SYMMetrical..................793 DISPlay:WAVeform<n2>:A:LIMUpper......................793 DISPlay:WAVeform<n2>:A:LIMUpper:SOURce.....................794 DISPlay:WAVeform<n2>:A:LIMUpper:SOURce:FILE..................
- Page 912 ® List of Commands R&S DISPlay:WAVeform<n2>:B:LIMShift......................792 DISPlay:WAVeform<n2>:B:LIMShift:PARallel....................793 DISPlay:WAVeform<n2>:B:LIMShift:SYMMetrical..................793 DISPlay:WAVeform<n2>:B:LIMUpper......................793 DISPlay:WAVeform<n2>:B:LIMUpper:SOURce.....................794 DISPlay:WAVeform<n2>:B:LIMUpper:SOURce:FILE..................794 DISPlay:WAVeform<n2>:B:LIMUpper:SOURce:VALue................. 794 DISPlay:WAVeform<n2>:B:MARKer:MODE....................817 DISPlay:WAVeform<n2>:B:MARKer:SETTo:OCURsor..................817 DISPlay:WAVeform<n2>:B:MARKer:SETTo:XCURsor.................. 817 DISPlay:WAVeform<n2>:B:MARKer:SETTo:XPOS..................818 DISPlay:WAVeform<n2>:B:REFerence......................795 DISPlay:WAVeform<n2>:B:REFerence:VALue....................795 DISPlay:WAVeform<n2>:B:SPACing......................796 DISPlay:WAVeform<n2>:B:TOP........................796 DISPlay:WAVeform<n2>:B:UNIT........................796 DISPlay:WAVeform<n2>:B:UNIT:AUTO......................796 DISPlay:WAVeform<n2>:B:UNIT:USER......................797 DISPlay:WAVeform<n2>:B:UPDate....................... 797 DISPlay:WAVeform<n2>:B:YSOurce......................798 DISPlay:WAVeform<n2>:B:YSOurce:FILE....................798 DISPlay:WAVeform<n2>:DLISt:FILTer......................
- Page 913 ® List of Commands R&S DISPlay:WAVeform<n2>:XCURsor:SETTo:MAX................... 820 DISPlay:WAVeform<n2>:XCURsor:SETTo:MIN.................... 820 DISPlay:WAVeform<n2>:XCURsor:SETTo:MRKA..................821 DISPlay:WAVeform<n2>:XCURsor:SETTo:MRKB..................821 DISPlay:WAVeform<n2>:XCURsor:SETTo:XPOS..................822 DISPlay:WAVeform<n2>:XCURsor:SETTo:YPOS..................822 DISPlay:WAVeform<n2>:XCURsor:STATe....................823 DISPlay:WAVeform<n2>:XCURsor:Y?......................823 FORMat................................. 741 HCOPy:DESTination............................829 HCOPy:FILE..............................829 HCOPy:FILE:MODE............................829 HCOPy:GSIZe............................... 829 HCOPy:PRINter:ADDition..........................830 HCOPy:PRINter:FOOTer..........................830 HCOPy:PRINter:HEADer..........................830 HCOPy:PRINter:ORIentation.........................830 HCOPy:SOURce............................829 HCOPy[:IMMediate]............................829 INITiate................................733 INITiate:CONTinuous.............................731 INITiate:CONTinuous:TIMeout........................732 INITiate:FORCe.............................
- Page 914 ® List of Commands R&S MMEMory:BARGraph<n2>:TRACe....................... 804 MMEMory:COPY............................833 MMEMory:DATA............................833 MMEMory:DELete............................834 MMEMory:FFT<n2>:EQUalization:INVert......................803 MMEMory:FFT<n2>:EQUalization:MODify....................803 MMEMory:FFT<n2>:EQUalization:NORMfrequency..................803 MMEMory:FFT<n2>:LIMit:OFFSet........................ 803 MMEMory:FFT<n2>:LIMit:OFFSet:VALue.....................804 MMEMory:FFT<n2>:STAS..........................804 MMEMory:FFT<n2>:STORe..........................804 MMEMory:FFT<n2>:TRACe.......................... 804 MMEMory:LOAD:ARBitrary........................... 708 MMEMory:LOAD:DWELl..........................718 MMEMory:LOAD:FREQuency........................718 MMEMory:LOAD:FREQuency:SLCFrequency....................755 MMEMory:LOAD:IEQualize........................... 758 MMEMory:LOAD:MCHannel<n3>:SINE:ARBitrary..................711 MMEMory:LOAD:MCHannel<n3>:SINE:EQUalize..................711 MMEMory:LOAD:OEQualize......................... 697 MMEMory:LOAD:PHASe..........................718 MMEMory:LOAD:STATe..........................
- Page 915 ® List of Commands R&S OUTPut:MCLKratio............................694 OUTPut:POLarity............................694 OUTPut:RESYnc............................695 OUTPut:SAMPle:FREQuency........................694 OUTPut:SAMPle:MODE..........................691 OUTPut:SIGNal:BALanced:LEVel......................... 691 OUTPut:SIGNal:LEVel...........................691 OUTPut:TYPE..............................690 OUTPut:WLENgth............................694 OUTPut:WOFFset............................694 SENSe[1]:BANDwidth............................755 SENSe[1]:BANDwidth:MODE........................755 SENSe[1]:CHANnel:DELay........................... 762 SENSe[1]:CHIRpbased:DISTortion<n3>:SWEep<n4>:A................765 SENSe[1]:CHIRpbased:DISTortion<n3>:SWEep<n4>:B................765 SENSe[1]:CHIRpbased:MMODe:SWEep<n4>:A..................765 SENSe[1]:CHIRpbased:MMODe:SWEep<n4>:B..................765 SENSe[1]:CHIRpbased:POINts?........................765 SENSe[1]:CHIRpbased:RESolution?......................766 SENSe[1]:FILTer<n2>............................ 773 SENSe[1]:FREQuency...........................755 SENSe[1]:FREQuency:FACTor........................755 SENSe[1]:FREQuency:LIMit..........................762 SENSe[1]:FREQuency:LIMit:LOWer......................760 SENSe[1]:FREQuency:LIMit:UPPer......................760 SENSe[1]:FREQuency:SELect........................755 SENSe[1]:FUNCtion:APERture:MODE......................753 SENSe[1]:FUNCtion:BARGraph........................
- Page 916 ® List of Commands R&S SENSe[1]:FUNCtion:SETTling:MODE......................771 SENSe[1]:FUNCtion:SETTling:RESolution....................772 SENSe[1]:FUNCtion:SETTling:TOLerance....................772 SENSe[1]:FUNCtion:SETTling:TOUT......................772 SENSe[1]:FUNCtion:SNSequence........................ 757 SENSe[1]:HDMI:ARCPort..........................728 SENSe[1]:HDMI:AUDio:CODing........................728 SENSe[1]:HDMI:AUDio:CODing:DETected:STRing?..................728 SENSe[1]:HDMI:AUDio:CTS......................... 728 SENSe[1]:HDMI:AUDio:FORMat........................729 SENSe[1]:HDMI:AUDio:FORMat:MODE....................... 729 SENSe[1]:HDMI:AUDio:INPut........................729 SENSe[1]:HDMI:AUDio:N..........................729 SENSe[1]:HDMI:CEC:HANDshake........................729 SENSe[1]:HDMI:CEC:INIT..........................729 SENSe[1]:HDMI:HDCP?..........................729 SENSe[1]:HDMI:VIDeo:COLor:DEPTh?......................730 SENSe[1]:HDMI:VIDeo:FORMat?......................... 730 SENSe[1]:HDMI:VIDeo:TIMing........................730 SENSe[1]:LIPSync:AUDio:THReshold:HIGH....................769 SENSe[1]:LIPSync:AUDio:THReshold:LOW....................769 SENSe[1]:LIPSync:COLor:THReshold:HIGH:STRing................... 770 SENSe[1]:LIPSync:COLor:THReshold:LOW:STRing..................770 SENSe[1]:MAX:FFT:SIZE..........................
- Page 917 ® List of Commands R&S SENSe[1]:VOLTage:APERture........................754 SENSe[1]:VOLTage:EQUalize........................759 SENSe[1]:VOLTage:FUNDamental........................759 SENSe[1]:VOLTage:FUNDamental:MODE....................760 SENSe[1]:VOLTage:INTVtime........................756 SENSe[1]:VOLTage:INTVtime:MODE......................756 SENSe[1]:VOLTage:RANGe<n3>:MODE...................... 723 SENSe[1]:VOLTage:RANGe<n3>:VALue...................... 724 SENSe<1|2|3|6>:DATA:ALL?.........................738 SENSe<1|2|3|6>:DATA<n2>?........................736 SENSe<1|2|3|6|7|8>:FUNCtion........................752 SENSe<1|2|6>:CONFig:COPYother......................804 SENSe<1|2|6>:LEFT............................. 808 SENSe<1|2|6>:LIMLower..........................808 SENSe<1|2|6>:LIMLower:VALue........................809 SENSe<1|2|6>:LIMUpper..........................809 SENSe<1|2|6>:LIMUpper:VALue........................809 SENSe<1|2|6>:REFerence..........................812 SENSe<1|2|6>:REFerence:MODE........................ 812 SENSe<1|2|6>:RIGHt............................ 812 SENSe<1|2|6>:UNAuto..........................812 SENSe<1|2|6>:UNIT............................813 SENSe<1|2|6>:USERunit..........................
- Page 918 ® List of Commands R&S SENSe3:PHASe:LIMUpper:VALue........................ 810 SENSe3:PHASe:REFerence......................... 810 SENSe3:PHASe:REFerence:MODE......................811 SENSe3:PHASe:RIGHt..........................811 SENSe3:PHASe:UNAuto..........................811 SENSe3:PHASe:UNIT........................... 811 SENSe3:PHASe:USERunit..........................811 SENSe7:MMODe............................767 SENSe7:TRIGger:AUTO..........................767 SENSe7:TRIGger:LEVel..........................767 SENSe7:TRIGger:PRE..........................767 SENSe7:TRIGger:SLOPe..........................767 SENSe7:TRIGger:SOURce........................... 767 SENSe7:TRIGger:TRCLength........................768 SENSe8:PROTocol:DISPlay..........................768 SENSe8:PROTocol:HIGHlight........................768 SENSe8:PROTocol:MODE..........................768 SENSe8:PROTocol:PERSistence........................768 SENSe8:PROTocol:VIEW..........................769 SOURce:ACHSine:FREQuency........................711 SOURce:ACHSine:STATe..........................711 SOURce:ACHSine:VOLTage......................... 712 SOURce:ARBitrary:MODE..........................712 SOURce:ARBitrary:RELoad.......................... 712 SOURce:ARBitrary:TIME..........................712 SOURce:FADin:VALue..........................
- Page 919 ® List of Commands R&S SOURce:MCHannel<n2>:GAIN........................713 SOURce:MCHannel<n2>:LIMittofs........................ 713 SOURce:MCHannel<n2>:SINE:ARBitrary:DELay..................713 SOURce:MCHannel<n2>:SINE:ARBitrary:STATe..................713 SOURce:MCHannel<n2>:SINE:ARBitrary:VOLTage..................713 SOURce:MCHannel<n2>:SINE:EQUalize:STATe..................713 SOURce:MCHannel<n2>:SINE:FREQuency....................714 SOURce:MCHannel<n2>:SINE:OFFSet:STATe.................... 714 SOURce:MCHannel<n2>:SINE:OFFSet:VOLTage..................714 SOURce:MCHannel<n2>:SINE:PHASe......................714 SOURce:MCHannel<n2>:SINE:STATe......................714 SOURce:MCHannel<n2>:SINE:VOLTage..................... 714 SOURce:MCHannel<n2>:TOTal:GAIN......................714 SOURce:MULTisine:COUNt.......................... 704 SOURce:ONTime............................705 SOURce:ONTime:DELay..........................706 SOURce:PHASe<n2>............................702 SOURce:PLAY:CHANnel..........................708 SOURce:PLAY:MODE........................... 709 SOURce:PLAY:MUTing..........................709 SOURce:PLAY:RESTart..........................709 SOURce:PLAY:SCALepktofs......................... 709 SOURce:PLAY:TIME.............................
- Page 920 ® List of Commands R&S SOURce:SWEep:FREQuency:STEP......................719 SOURce:SWEep:FREQuency:STOP......................719 SOURce:SWEep:NEXTstep...........................718 SOURce:SWEep:PHASe:HALT........................718 SOURce:SWEep:PHASe:HALT:VALue......................719 SOURce:SWEep:PHASe:POINts........................719 SOURce:SWEep:PHASe:SPACing....................... 719 SOURce:SWEep:PHASe:STARt........................719 SOURce:SWEep:PHASe:STEP........................719 SOURce:SWEep:PHASe:STOP........................719 SOURce:SWEep:VOLTage:HALT........................718 SOURce:SWEep:VOLTage:HALT:VALue.......................719 SOURce:SWEep:VOLTage:POINts....................... 719 SOURce:SWEep:VOLTage:SPACing......................719 SOURce:SWEep:VOLTage:STARt........................ 719 SOURce:SWEep:VOLTage:STEP......................... 719 SOURce:SWEep:VOLTage:STOP......................... 719 SOURce:SWEep:XAXis..........................720 SOURce:SWEep:ZAXis..........................720 SOURce:SYNC:INPut............................691 SOURce:SYNC:TERMination........................692 SOURce:SYNC:TO............................692 SOURce:VOLTage:CH2Stereo........................
- Page 921 ® List of Commands R&S STATus:QUEStionable:MEASuring:EVENt?....................842 STATus:QUEStionable:MEASuring:NTRansition...................842 STATus:QUEStionable:MEASuring:PTRansition................... 842 STATus:QUEStionable:NTRansition......................838 STATus:QUEStionable:OVERrange:CONDition?..................840 STATus:QUEStionable:OVERrange:ENABle....................840 STATus:QUEStionable:OVERrange:EVENt?....................840 STATus:QUEStionable:OVERrange:NTRansition..................841 STATus:QUEStionable:OVERrange:PTRansition..................841 STATus:QUEStionable:PTRansition......................838 STATus:QUEStionable:UNDerrange:CONDition?..................839 STATus:QUEStionable:UNDerrange:ENABle....................839 STATus:QUEStionable:UNDerrange:EVENt?....................839 STATus:QUEStionable:UNDerrange:NTRansition..................839 STATus:QUEStionable:UNDerrange:PTRansition..................840 STATus:QUEue:NEXT?..........................844 STATus:XQUEstionabl:CONDition?.......................842 STATus:XQUEstionabl:ENABle........................843 STATus:XQUEstionabl:EVENt?........................843 STATus:XQUEstionabl:NTRansition......................843 STATus:XQUEstionabl:PTRansition......................843 SWITcher:COMPort............................779 SWITcher:INPA..............................
- Page 922 ® List of Commands R&S SYSTem:SHUtdown............................847 SYSTem:SINFo..............................848 SYSTem:SINFo:MAC?...........................848 SYSTem:VERSion?............................848 SYSTem:WINStyle............................848 TRACe:BARGraph<n2>:LDList:AX?......................746 TRACe:BARGraph<n2>:LDList:AY?......................746 TRACe:BARGraph<n2>:LDList:BX?......................746 TRACe:BARGraph<n2>:LDList:BY?......................746 TRACe:BARGraph<n2>:LDList:COUNt:AX?....................746 TRACe:BARGraph<n2>:LDList:COUNt:AY?....................746 TRACe:BARGraph<n2>:LDList:COUNt:BX?....................747 TRACe:BARGraph<n2>:LDList:COUNt:BY?....................747 TRACe:BARGraph<n2>:LOAD:AX?......................744 TRACe:BARGraph<n2>:LOAD:AY?......................744 TRACe:BARGraph<n2>:LOAD:BX?......................744 TRACe:BARGraph<n2>:LOAD:BY?......................744 TRACe:BARGraph<n2>:LOAD:COUNt:AX?....................744 TRACe:BARGraph<n2>:LOAD:COUNt:AY?....................744 TRACe:BARGraph<n2>:LOAD:COUNt:BX?....................744 TRACe:BARGraph<n2>:LOAD:COUNt:BY?....................744 TRACe:BARGraph<n2>:STORe:AY......................825 TRACe:BARGraph<n2>:STORe:BY......................825 TRACe:FFT<n2>:LDList:AX?........................745 TRACe:FFT<n2>:LDList:AY?.........................745 TRACe:FFT<n2>:LDList:BX?........................
- Page 923 ® List of Commands R&S TRACe:SWEep<n2>:LOAD:AY?........................742 TRACe:SWEep<n2>:LOAD:BX?........................742 TRACe:SWEep<n2>:LOAD:BY?........................742 TRACe:SWEep<n2>:LOAD:COUNt:AX?.......................742 TRACe:SWEep<n2>:LOAD:COUNt:AY?.......................742 TRACe:SWEep<n2>:LOAD:COUNt:BX?.......................742 TRACe:SWEep<n2>:LOAD:COUNt:BY?.......................742 TRACe:SWEep<n2>:STORe:AX........................825 TRACe:SWEep<n2>:STORe:AY........................825 TRACe:SWEep<n2>:STORe:BX........................825 TRACe:SWEep<n2>:STORe:BY........................825 TRACe:WAVeform<n2>:LDList:AX?......................746 TRACe:WAVeform<n2>:LDList:AY?......................746 TRACe:WAVeform<n2>:LDList:BX?......................746 TRACe:WAVeform<n2>:LDList:BY?......................746 TRACe:WAVeform<n2>:LDList:COUNt:AX?....................746 TRACe:WAVeform<n2>:LDList:COUNt:AY?....................746 TRACe:WAVeform<n2>:LDList:COUNt:BX?....................746 TRACe:WAVeform<n2>:LDList:COUNt:BY?....................746 TRACe:WAVeform<n2>:LOAD:AX?.......................743 TRACe:WAVeform<n2>:LOAD:AY?.......................743 TRACe:WAVeform<n2>:LOAD:BX?.......................743 TRACe:WAVeform<n2>:LOAD:BY?.......................743 TRACe:WAVeform<n2>:LOAD:COUNt:AX?....................743 TRACe:WAVeform<n2>:LOAD:COUNt:AY?....................
-
Page 924: Index
® Index R&S Index Symbols All odd di ................. 385 Amplitude distribution of the signal spectrum -2π..0 ................454 Random ..............250 -180° to 180° ..............454 Analog analyzer .............. 301 -360° to 0° ............... 454 Analog Generator ............196 -π..+π ................454 Analysis *.npz in the time domain .......... - Page 925 ® Index R&S Automatic ................ 441 CEC - Consumer Electronics Control Automatic Sweep ............290 HDMI generator ............226 automatic sweeps ............718 Center frequency Autorange ................307 DFD ................248 Autotrigger ...............436 Center Frequency Auxiliaries panel ............177, 485 Filter ................474 Auxiliaries Panel ..............
- Page 926 ® Index R&S Command (IEC/IEEE) DC Offset Admissibility .............. 658 Arbitrary ..............256 Command Description ............. 680 Chirp ................. 267 Command sequence (IEC/IEEE) ........658 DFD ................249 Comp Factor ..............432 Mod Dist ..............246 Compensate for delays ........... 275 Multisine ..............
- Page 927 ® Index R&S Distortion Measurements ........381, 758 Example Distortion voltage ............385 Measuring frequency response ........91 Dither Measuring total harmonic distortion ......102 DFD ................248 Example setups ............... 110 Mod Dist ..............245 Examples Sine ................233 Settling of start conditions .........
- Page 928 ® Index R&S Deemph 75 ............478, 484 Format Phase ..............454 Deemph J.17 ............ 478, 484 Frame rate Delay ................. 477 HDMI generator ............223 DFD ................249 Free Text ................. 554 digital ................ 773 Freezing graphic ............. 523 FFT ................
- Page 929 ® Index R&S Gain factor HDMI, video identification code ........ 224 Multisine ..............241 HDMI, video resolution ..........223 Gen Burst ................ 433 HDMI, video source ..........223 Gen Channels ..............213 HDMI, VSYNC frequency ......... 223 Gen Off ................194 HDMI, word width .............
- Page 930 ® Index R&S Group delay measurement ..........770 Input Monitor ............456, 770 GUI Control ..............499 Input Type ............... 725 Input voltage, permissible ..........36 Installed options (remote control) ........686 Instrument ............... 301 Halt .................. 297 Instrument Concept ............113 Halt value ................
- Page 931 ® Index R&S Leg A Descript ..............554 LOCAL key .............. 640, 641 Leg B Descript ..............554 Log Points ............... 293 Lev Trig ................344 Log Steps ................ 293 Lev Trig Ch1 ..............344 Logarithmic step size ............295 Lev Trig Ch2 ..............
- Page 932 ® Index R&S Measurement Time No of Sine Level measurement RMS selective ......364 Multisine ..............241 Measurement value triggering ......... 735 Noise ................391 Measuring function Noise component Settling ..............460 DFD ................248 Memory depth ..............432 Sine ................233 Menu bar always visible ..........
- Page 933 ® Index R&S Output A ................492 Poles/zeros file ..............476 Output level ..............487 Pos Peak ..............374, 377 Output of protocol data ............750 Post FFT ............384, 407, 411 Output of protocol errors ..........750 Power supply connection ..........36 Output of trace data sets ..........
- Page 934 ® Index R&S Reading Results .............. 730 RMS measurement Recording length ............. 432 selective ..............363 Recovery wideband ..............361 Windows 7 ..............67 RMS Measurement ............754 Windows XP ............... 63 RMS Selective Measurement .......... 754 Rectangular window ............410 RMS value Ref Channel ............
- Page 935 ® Index R&S Setting the required generator signal ...... 689, 690 Source Value ............538, 541 Settings in the Menu Bar ..........170 Spacing ........... 293, 533, 551, 589 Settings in the Operating System ........177 Multisine ..............240 Settings on the Toolbar ........... 176 Random ..............
- Page 936 ® Index R&S STOP/CONT Sweeps ..............285, 717 Sweep ............... 355 Switcher ................491 Stopband ................. 472 Switcher Panel ............489, 779 Stopped ................193 Switching on the instrument ..........37 Stopped measurement ............ 342 Symmetr. Shift ..............542 Store Symmetrical ..............
- Page 937 ® Index R&S total harmonic distortion + noise ........389 Unit Auto ..........531, 550, 572, 585 Total load ................35 Unit for S/N measurement results ........185 Total Peak Unit Funct Track ............528, 571 Multisine ..............241 Unit of measurement result ..........148 Polarity ..............
- Page 938 ® Index R&S Volt LF:UF Mod Dist ..............246 Volt Mode ................ 703 X-axis .............. 160, 288, 546 Play ................261 labeling ..............549 Lower limit ..............551 Stereo sine ..............236 Volt No i Main grid ..............552 Scaling ..............550 Multisine ..............
Need help?
Do you have a question about the R&S UPP and is the answer not in the manual?
Questions and answers