
Related Manuals for Chauvin Arnoux MAP COMPACT


Summary of Contents for Chauvin Arnoux MAP COMPACT
- Page 1 EN - Installation and operating manual MS1-7582 MAP COMPACT QUAL-SRTc Three-phase power quality analyser Measure up...
- Page 2 For best results from your power quality analyzer: Read this user manual carefully before install and use the device. Comply with the precautions for use. The operator should refer to this manual whenever this symbol appears. The device must be connected to the ground This symbol indicates compliance with European standards, in particular the LVD and This symbol indicates that the product at end of life must be disposed of by collection in accordance with the WEEE directive.
- Page 3 We hope that you will experience both our products and our organization as a plus for your firm. One of CHAUVIN ARNOUX ENERGY's aims is that all of the equipment of the MAP 600 line of power quality analyzers should be user-friendly and deliver maximum flexibility, given the range of individual configurations and personal preferences of our customers.
-
Page 4: Table Of Contents
Connection to the protection CT via a separate auxiliary measurement transformer _________ 8 Installation and connection procedure ____________________________________________________ 10 4.1. SET-UP __________________________________________________________________________ 11 4.2. THE INPUTS OF THE MAP COMPACT __________________________________________________ 11 4.2.1. THE INPUT CONNECTIONS OF THE EQUIPMENT (DIGITAL PORT) ________________________ 11 4.2.2. VOLTAGE INPUTS L1-L3 _________________________________________________________ 11 4.2.3. - Page 5 6.1.4. CHOOSE THE LANGUAGE________________________________________________________ 23 6.1.5. CONFIGURING THE INSTRUMENT _________________________________________________ 24 6.1.5.1 CONNECTION _______________________________________________________________ 24 6.1.5.2 CONNECTING TO THE USB PORT________________________________________________ 25 6.1.5.3 CONNECTING TO THE REMOTE RS232 PORT ______________________________________ 25 6.1.5.4 CONNECTING TO THE RS232 PORT VIA A NULL-MODEM PORT _______________________ 26 6.1.5.5 CONNECTING TO THE ETHERNET PORT __________________________________________ 27 6.1.6.
-
Page 6: Safety Information
Use the measuring instrument only in the electrical environments indicated in the manual or on the measuring equipment. Chauvin Arnoux Energy is committed to complying with current recommendations and legislation concerning the sale of and responsibility for its products. Cleaning instructions When the appliance is disconnected from the mains, use only a dry cloth to clean the exterior surface. -
Page 7: General Information
2. GENERAL INFORMATION All MAP line equipment, including the MAP COMPACT, is designed to measure the quality of the electricity delivered by and the perturbations occurring in the electrical grid. The instruments may be connected either to distribution or delivery substations or directly to the end user's installation. -
Page 8: Installing The Equipment
LAN communication network. If necessary, MAP COMPACT devices can also have their own remote reading links via a remote RS232 port, making it possible to use an external communication device such as a modem (including a GSM modem). -
Page 9: Figure 2 - Tcr21 External Measurement Transformer
The Chauvin Arnoux Energy line includes devices just right for such cases - high-precision measurement transformers (measurement range 0-100A) that can be connected directly and simply to MAP COMPACT devices. These transformers are divided into two categories: the TCR21 fixed transformer and the TCC241 clip-on transformer. -
Page 10: Installation And Connection Procedure
4. INSTALLATION AND CONNECTION PROCEDURE MAP COMPACT instruments are designed to be easy to install. Follow the mini-instructions below. A. Install the equipment at the point of measurement. The most appropriate location is in the electrical cabinet or equivalent. B. First connect the ground to the ground symbol (... -
Page 11: Set-Up
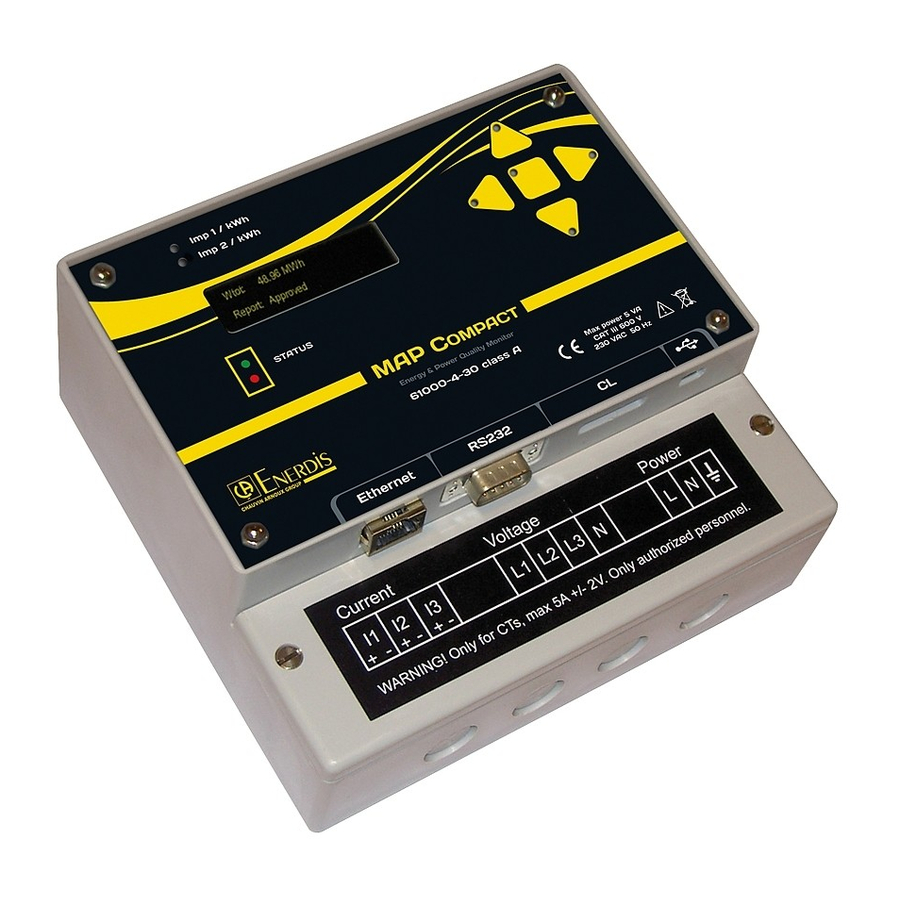
4.1. SET-UP The MAP COMPACT is installed directly in the electrical cabinet or similar situation thanks to notches on the back of the product. 4.2. THE INPUTS OF THE MAP COMPACT MAP COMPACT devices have inputs for measurements, for power supply, and for communication. Altogether, three... -
Page 12: Current Inputs I1-I3
SCREEN / PULSE COUNTER / NAVIGATION MAP COMPACT devices have a display screen and navigation keys. The screen is used to display the events counter, and the status of the last EN 50160 report. This analyzer can also be used to meter energy. -
Page 13: Connection
Always start by grounding the devices, then connect them to the power supply plugs. Imp 1 / kWh Réseau électrique Imp 2 / kWh Raccordement BT Wtot 48.96 MWh Report Approved Status MAP Compact Ethernet RS232 Voltage Current Power Transformateur de courant En principe 1-5 A secondaire Max ± 2V Aux. Source... -
Page 14: High-Voltage Connection Via Measurement Transformers (Pt/Ct)
Always start by grounding the devices, then connect them to the power supply plugs. Imp 1 / kWh Réseau électrique Imp 2 / kWh Raccordement HTA/HTB Wtot 48.96 MWh Report Approved Status MAP Compact Ethernet RS232 Voltage Current Power Transformateur de courant En principe 1-5 A secondaire Max ± 2V Aux. Source... -
Page 15: High-Voltage Connection Via Protection Transformers (Protection Ct)
HIGH-VOLTAGE CONNECTION VIA PROTECTION TRANSFORMERS (PROTECTION CT) When the device is connected to the secondary of a protection CT for current measurements, Chauvin Arnoux Energy auxiliary transformers must always be used, to prevent damage to the equipment by the fault currents that may occur (up to 20 times the rated current). -
Page 16: Power Supply
THE REMOTE RS232 PORT MAP COMPACT devices have an RS232 port (9-pin male) for connection to modems. They are connected to the modem by a standard RS232 cable (straight). The MAP COMPACT can also be connected to the computer using a Null-Modem converter for configuration by Qual-SRTc software, the use of which is explained in part 6. -
Page 17: Cl Port (Current Loop)
Current Voltage Power Figure 10 - Principle of connection between the CL converter and the MAP COMPACT device for multipoint communication 4.4.6.3 ETHERNET PORT (INTERNAL/OPTION) MAP COMPACT instruments can be equipped with an internal Ethernet port for connection via a valid LAN network,... -
Page 18: Digital Input/Output (Di/Do)
4.4.7. DIGITAL INPUT/OUTPUT (DI/DO) Figure 11-Principle of connection for Digital Input/Output 4.4.8. CHARACTERISTICS POWER SUPPLY 175 à 255 V– <10 VA – 50 Hz Alternative network : MECHANICAL CHARACTERISTICS Dimension : 155 x 165 x 68 mm (PxLxH) Weight : 900 gr Number of Terminal : Connection :... -
Page 19: Display Unit Of The Map Compact
"downloading data". To restore access to the display unit, the computer must disconnect from the device. 5.1. DISPLAY OF THE MAIN MENUS At start-up, the MAP COMPACT displays the values in real time. To view the menu, it is necessary to press the right arrow key (... -
Page 20: View Mode" Menu
5.2. "VIEW MODE" MENU The "View Mode" menu is used to display the active, reactive, and apparent power and the voltage and current measured on each phase and the active and reactive energies. View Mode Varh Energie + Statut du dernier rapport de Qualimétrie Report Passed Energie... -
Page 21: Pq Parameters" Menu
Long int: RVC: Figure 16 - "Events" menu and parameters 5.6. "SYSTEM INFO" MENU The "System Info" menu is used to display the firmware versions of the various components of the MAP COMPACT. Figure 17 - "System Info" menu and parameters... -
Page 22: Qual-Srtc Measurement Software
INSTALLING THE SOFTWARE Before installing the Qual-SRTc and Qual-View software for MAP COMPACT, make sure that your operating system is Windows NT/2000/XP or later, up to Windows 10. For report generation, Word 2000 or a later version of the Microsoft Office suite must be installed. -
Page 23: Main Window
6.1.3. MAIN WINDOW The main menu of the software is displayed when it opens. The main window provides a certain number of choices in the form of buttons and menus. Figure 18 - Main window of the software 6.1.4. CHOOSE THE LANGUAGE The software lets you change languages. -
Page 24: Configuring The Instrument
6.1.5. CONFIGURING THE INSTRUMENT 6.1.5.1 CONNECTION Communication with the MAP COMPACT is possible in several ways: Min. USB/USB Serial cable (with a Null-Modem converter)/GSM modem Ethernet (optional on the MAP COMPACT) The figure below shows the connection window: Figure 20 - Connection A. -
Page 25: Connecting To The Usb Port
6.1.5.2 CONNECTING TO THE USB PORT For the first connection, we strongly recommend using the USB port. The software automatically recognizes the connection of the instrument and the port used. If the software does not automatically recognize the product, simply press the "Update"... -
Page 26: Connecting To The Rs232 Port Via A Null-Modem Port
6.1.5.4 CONNECTING TO THE RS232 PORT VIA A NULL-MODEM PORT To configure connection to the product for serial communication, simply click the scrolling list and choose "Custom". Figure 26 - Configure a Custom communication Once you have chosen "Custom", simply click the manual configuration button and not check the "Modem" box. Figure 27 - Configuring serial communication You must enter the serial number of the instrument, the COM port used, and the speed. -
Page 27: Connecting To The Ethernet Port
6.1.5.5 CONNECTING TO THE ETHERNET PORT To configure connection to the product for Ethernet communication, you must first establish a functional connection with the product (the USB connection is recommended), then configure the IP address of the product. Simply proceed as follows (we assume that the USB communication is set up and valid): Figure 29 - Configuring the IP address Once the data have been entered, do not forget to apply and update the data. -
Page 28: Configuring The Equipment And The Grid
You must enter the serial number of the instrument, the IP address used, and the port. Once the information entered has been validated, the connection window opens as follows. Figure 31 - Configuration window for Ethernet communication Simply press the "Connect" button to connect to the product. Note: The factory IP address of the product is 192.168.50.200 (Port 5000). -
Page 29: Figure 33 - Equipment Configuration, Events Tab
The second sub-section gives the characteristics of recording of events (triggerings thresholds, pre/post-triggering recording times). Figure 33 - Equipment configuration, Events tab In the "Events" tab, you can modify: The triggering thresholds of the events The pre-triggering and post-triggering times, which define a time range around the onset of events during which the data are recorded. -
Page 30: Figure 35 - Equipment Configuration, Digital Trig Tab
The "Digital trig" option, for its part, is used to activate or deactivate the use of the digital ports and to parameterize them. The input is used to trigger a capture of an event, while the output is used to send a pulse, of which the width can be parameterized (in seconds), upon the onset of a sag, an interruption, a swell, or an anomalous report. -
Page 31: Configuring The Program
For this, check "Look for the devices of the database", enter your database instance and validate using the OK button. For this part you must have E.Qual Premium Server. E.Qual Premium Server manages the MAP COMPACT for the automatic uploading of data to a database. -
Page 32: Real-Time Analysis
6.2. REAL-TIME ANALYSIS 6.2.1. MAIN WINDOW When you have validated your connection and press the "Connect", button, the real-time window opens as follows: Figure 39 - Real-time analysis window A. Status of the connection (green, product connected; red, product disconnected) B. -
Page 33: Harmonics
6.2.2. HARMONICS Qual-SRTc also allows a detailed real-time analysis of harmonics. In the main window, simply click the "Harmonics" tab. Figure 40 - Real-time analysis of harmonics To obtain correct and legible information, we recommend choosing the channels in which you want to see the individual harmonics. -
Page 34: Manual Data Transfer
When this button is pressed, a new window opens. Figure 42 - Uploading of the data in memory Before transferring measurement data from the MAP COMPACT, it is important to decide what quantity of information to transmit. Here are the options: This choice reduces the quantity of data to be transmitted, which is desirable when transmission is by modem, for example. -
Page 35: Partial Uploading Of The Measurement Data
6.3.2. PARTIAL UPLOADING OF THE MEASUREMENT DATA Qual-SRTc allows partial uploading of the measurement data. That enables the user to choose, in addition to the measurement data, which time interval will be uploaded for each instrument. If the measuring instrument has measurement data that extend over several weeks, the user may choose to transmit a shorter period, for example a few days. -
Page 36: Software Version And Product
6.3.3. SOFTWARE VERSION AND PRODUCT The version of the Qual-SRTc software can be checked by clicking the "Help" → "About" tab. The following window then appears on screen. This window also displays information about the product being evaluated. Figure 45 - Information about the software version... -
Page 37: Analysis Of Measurement Files, Qual-View
7. ANALYSIS OF MEASUREMENT FILES, QUAL-VIEW When the transfer of the data is complete, Qual-View automatically opens with a window recapitulating the data and events recorded. You can in particular note the duration of recording of each measurement, the type and number of events, and the number of reports and their conformity according to the imposed configuration. -
Page 38: Navigation
7.1. NAVIGATION 7.1.1. LOADING A MEASUREMENT FILE To load a measurement file directly from the main window, click the button at bottom left, "Load data". Use the explorer to select the file you want to open. Measurement files must be in MPQ format (.mpq). Figure 47 - Loading the data 7.1.2. -
Page 39: Summary
Figure 48, option is used to cancel, in all tabs, all of the parameters previously selected. Only the parameters chosen subsequently will be displayed on the graph. 7.1.4. SUMMARY The "Summary" button at the bottom of the page is used to open the summary window shown in Erreur ! Source du renvoi introuvable.. -
Page 40: Scale Of The Axes
7.1.7. SCALE OF THE AXES As default, the configuration of the axes is "Automatic scale". To change the axes manually, right-click on "Configuration of the axes". Configure the axes and click "Redraw". Figure 50 - Configuring the axes To return to "Automatic scale", mode, unselect the configuration of the axes by clicking it again. 7.1.8. -
Page 41: Detailed Information About The Values
7.1.10. DETAILED INFORMATION ABOUT THE VALUES During a right click on the graph, it is possible to select the "Display values" function. With this option, placing the mouse cursor on the graph opens a bubble containing the name of the value measured and its values on the x and y axes. Figure 52 - Detailed information about a sample 7.1.11. -
Page 42: Insert A Remark In A Graph
7.1.12. INSERT A REMARK IN A GRAPH To insert a remark in a graph, right-click and select "Add/edit remark". The remark is limited in (number of?) characters. Click the second line to change lines in the remark. Figure 54 - How to insert a remark The remarks are displayed at top right in the graphic window. -
Page 43: Displaying The Min/Max And Limits Of The Standards
7.1.13. DISPLAYING THE MIN/MAX AND LIMITS OF THE STANDARDS Ticking the "Display the min/max lines" and "Display the limits of the standard" boxes displays lines showing these limits. Ticking these boxes lets you see whether the voltage is outside the limits or not. Figure 56 - Min/max limits and limits of the standard When the "Display the limits of the standard", box is ticked, it is also possible to select the standard under which the limits are acceptable, for example standard EN 50160. -
Page 44: Figure 58 - Tree On Events Log
also possible to set up a tree in order to better display this list. The tree makes distinguishing the various types of events easier and faster. To do this, simply drag the tab of a column in the greyed-out bar above the table while keeping the left mouse button pressed. -
Page 45: Figure 59 - Preview Of Table Of Events
Figure 59 – Preview of table of events... -
Page 46: Analysis Of Perturbations
7.3. ANALYSIS OF PERTURBATIONS The "Events/Reports" perturbations analysis tab is used to evaluate rapid perturbations recorded both as numerical values and in graphic form. One example of these perturbations is a sag. Figure 60 - Events / Reports A. Lets you choose the quantity to display on the graph. The colour in which the channel is represented can be changed by clicking its colour box and choosing a new colour in the palette. -
Page 47: Analysis Of Voltages And Currents (U/I)
Courbe Figure 61 - Recorded voltage sag (evaluated both by half-cycle RMS and the curves) 7.4. ANALYSIS OF VOLTAGES AND CURRENTS (U/I) The analysis window contains a tab that displays the voltages and currents. This tab shows the mean, minimum, and maximum values of each quantity. -
Page 48: Analysis Of Harmonics
7.5. ANALYSIS OF HARMONICS This tab provides information about all measurements made that are associated with harmonics. Figure 63 - Analysis of harmonics 1 → This zone is used to display the total harmonic distortion (THD) of each of the quantities measured. The voltage THD will be displayed on the top graph and the current THD will be displayed on the bottom graph. -
Page 49: Analysis Of Flickers
Figure 64 - Choice of the individual harmonics to be displayed Once the selection has been made, click the "Terminate" button in order to return to the previous page. Clicking "Redraw" opens the requested graphs, which are added one below the other. This stacking sometimes impairs legibility, making it necessary to delete a few graphs. -
Page 50: Figure 66 - Analysis Of Flickers (Pst & Plt)
Figure 66 - Analysis of Flickers (Pst & Plt) -
Page 51: Analysis Of Unbalances
7.7. ANALYSIS OF UNBALANCES Unbalances can be analysed in the "Unbalances" tab. The voltage unbalance, in percent (%), is determined by dividing the negative component by the positive component. Some MAP 600 measuring instruments can in addition even measure the homopolar component. Figure 67 - Analysis of unbalances 7.8. -
Page 52: Generating Measurement File Reports
"accepted" or "rejected" with respect to the standard. Chauvin Arnoux Energy measuring instruments are capable of analysing the reports in each instrument internally, at all times. This serves to reduce the quantity of measurement data necessary to create the reports database. This is a great advantage when there are several measuring instruments and communication is remote (by Modem, for example). -
Page 53: Generating A Report
8.2. GENERATING A REPORT The report is generated automatically when you click the "Generate Report" button. When the report has been generated, MS-Word opens automatically. You can then save the report to your disc. The user can later edit the report in MS-Word. Figure 70 - Example of the first pages of a weekly report per EN 50160 in MS-Word format The weekly reports contain both a summary of the weekly analysis report (accepted/rejected for each parameter) and detailed information about each parameter (minimum/maximum values during the measurement period) and the limits of... -
Page 54: Warranty, Responsibility And Intellectual Property
9. WARRANTY, RESPONSIBILITY AND INTELLECTUAL PROPERTY 9.1. WARRANTY The Chauvin Arnoux Energy company warrants that the product will be free of defects of materials and workmanship for a period of two years counting from the date of delivery. The warranty is void if the product becomes defective as a result of mishandling or of use outside the stipulated ranges and conditions. - Page 55 Figure 8 - Communication ports ______________________________________________________________________________ 16 Figure 9 - Multipoint communication installation ________________________________________________________________ 17 Figure 10 - Principle of connection between the CL converter and the MAP COMPACT device for multipoint communication _____________________________________________________________________________________________ 17 Figure 11-Principle of connection for Digital Input/Output ________________________________________________________ 18 Figure 12 - Menu sequence __________________________________________________________________________________ 19 Figure 13 - "View Mode"...
- Page 56 Figure 57 - List of events ____________________________________________________________________________________ 43 Figure 58 – Tree on events log _______________________________________________________________________________ 44 Figure 59 – Preview of table of events _________________________________________________________________________ 44 Figure 60 - Events / Reports _________________________________________________________________________________ 45 Figure 61 - Recorded voltage sag (evaluated both by half-cycle RMS and the curves)_______________________________ 46 Figure 62 - Analysis of voltages and currents ___________________________________________________________________ 46 Figure 63 - Analysis of harmonics _____________________________________________________________________________ 47 Figure 64 - Choice of the individual harmonics to be displayed ___________________________________________________ 47...
- Page 57 FRANCE INTERNATIONAL Chauvin Arnoux Energy Chauvin Arnoux Energy 16, rue Georges Besse - Silic 44 16, rue Georges Besse - Silic 44 92182 Antony cedex 92182 Antony cedex Tel: +33 1 7560 1030 Tel: +33 1 7560 1030 Fax : +33 1 4666 6254 Fax : +33 1 4666 6254 info@enerdis.fr...
Need help?
Do you have a question about the MAP COMPACT and is the answer not in the manual?
Questions and answers