Sign In
Upload
Manuals
Brands
Chauvin Arnoux Manuals
Measuring Instruments
MAP COMPACT
Chauvin Arnoux MAP COMPACT Manuals
Manuals and User Guides for Chauvin Arnoux MAP COMPACT. We have
1
Chauvin Arnoux MAP COMPACT manual available for free PDF download: Installation And Operating Manual
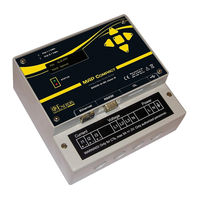
Chauvin Arnoux MAP COMPACT Installation And Operating Manual (57 pages)
QUAL-SRTc Three-phase power quality analyser
Brand:
Chauvin Arnoux
| Category:
Measuring Instruments
| Size: 2.91 MB
Table of Contents
Table of Contents
4
1 Safety Information
6
2 General Information
7
Figure 1 - Breakdown into Levels of the Distribution Grid
7
3 Installing the Equipment
8
Installation at Points of Delivery
8
Installation in Delivery Substations and Distribution Substations
8
Installation Via Measurement Ct or Relay Ct
8
Connection to the Protection CT Via a Separate Auxiliary Measurement Transformer
8
Which Current Transformer (Ct-Ti) Should be Chosen
8
Figure 2 - TCR21 External Measurement Transformer
9
Figure 3 - TCC241 External Measurement Transformer
9
4 Installation and Connection Procedure
10
Set-Up
11
The Inputs of the Map Compact
11
Figure 4 - the Inputs of the Equipment
11
The Input Connections of the Equipment (Digital Port)
11
Voltage Inputs L1-L3
11
Current Inputs I1-I3
12
Digital Inputs/Outputs
12
Rs232 Port / Current Loop / Ethernet
12
Screen / Pulse Counter / Navigation
12
Status Diode
12
Connection
13
Figure 5 - Low-Voltage Connection
13
Low-Voltage Connection
13
Figure 6 - High-Voltage Connection (Via PT/CT)
14
High-Voltage Connection Via Measurement Transformers (Pt/Ct)
14
Figure 7 - Diagram of Connection with Current Transformers CT (Protection Type Winding)
15
High-Voltage Connection Via Protection Transformers (Protection Ct)
15
Communication
16
Figure 8 - Communication Ports
16
Internal Backup
16
Power Supply
16
The Remote Rs232 Port
16
CL Port (Current Loop)
17
Ethernet Port (Internal/Option)
17
Figure 10 - Principle of Connection between the CL Converter and the MAP COMPACT Device for Multipoint Communication
17
Figure 9 - Multipoint Communication Installation
17
Characteristics
18
Digital Input/Output (DI/Do)
18
Figure 11-Principle of Connection for Digital Input/Output
18
5 Display Unit of the Map Compact
19
Display of the Main Menus
19
Figure 12 - Menu Sequence
19
View Mode" Menu
20
Report STATUS" MENU
20
Figure 13 - "View Mode" Menu and Sub-Menus
20
Figure 14 - "Report Status" Menu and Parameters
20
Pq Parameters" Menu
21
Events" Menu
21
System Info" Menu
21
Figure 15 - "PQ Parameters" Menu and Associated Parameters
21
Figure 16 - "Events" Menu and Parameters
21
Figure 17 - "System Info" Menu and Parameters
21
6 Qual-Srtc Measurement Software
22
Installation
22
General
22
Installing the Software
22
Choose the Language
23
Figure 18 - Main Window of the Software
23
Figure 19 - Selecting a Language
23
Main Window
23
Configuring the Instrument
24
Connection
24
Figure 20 - Connection
24
Figure 21 - Configuring the Connection
24
Connecting to the Remote Rs232 Port
25
Connecting to the Usb Port
25
Figure 22 - Connecting to the USB Port
25
Figure 23 - Configure a Custom Communication
25
Figure 24 - Configuring Communication by Modem
25
Figure 25 - Configuration Window for Communication by Modem
25
Connecting to the Rs232 Port Via a Null-Modem Port
26
Figure 26 - Configure a Custom Communication
26
Figure 27 - Configuring Serial Communication
26
Figure 28 - Configuration Window for Communication by Modem
26
Connecting to the Ethernet Port
27
Figure 29 - Configuring the IP Address
27
Figure 30 - Configuring Ethernet Communication
27
Configuring the Equipment and the Grid
28
Figure 31 - Configuration Window for Ethernet Communication
28
Figure 32 - Equipment Configuration, General Tab
28
Figure 33 - Equipment Configuration, Events Tab
29
Figure 34 - Equipment Configuration, Advanced Tab
29
Figure 35 - Equipment Configuration, Digital Trig Tab
30
Figure 36 - CONFIGURING System Information
30
Configuring the Program
31
Figure 37 - Program Configuration
31
Figure 38 - Devices in the Database
31
Real-Time Analysis
32
Figure 39 - Real-Time Analysis Window
32
Main Window
32
Figure 40 - Real-Time Analysis of Harmonics
33
Figure 41 - Play / Pause Button
33
Harmonics
33
Play / Pause
33
Manual Data Transfer
34
Figure 42 - Uploading of the Data in Memory
34
Transfer the Data in Memory
34
Figure 43 - Parameterizing of Upload and Free Time Interval
35
Figure 44 - Choose Time Interval
35
Partial Uploading of the Measurement Data
35
Figure 45 - Information about the Software Version
36
Software Version and Product
36
7 ANALYSIS of MEASUREMENT FILES, Qual-View
37
Figure 46 - Summary Window / Information about the Measurement File
37
Figure 47 - Loading the Data
38
Figure 48 - "Redraw" and "Unselect" Functions
38
Loading a Measurement File
38
Navigation
38
Redraw
38
Unselect
38
Copy, Record Image, Export, Choose Page Layout, and Print
39
Figure 49 - Drawing Functions
39
Functions for Analysis and Drawing the Graphs
39
Summary
39
Figure 50 - Configuring the Axes
40
Figure 51 - Zoom in
40
Scale of the Axes
40
Simultaneous Zoom
40
Zoom
40
Detailed Information about the Values
41
Figure 52 - Detailed Information about a Sample
41
Figure 53 - Use of Markers a and B
41
Markers
41
Figure 54 - How to Insert a Remark
42
Figure 55 - Min/Max Limits and Limits of the Standard
42
Insert a Remark in a Graph
42
Displaying the Min/Max and Limits of the Standards
43
Events Log
43
Figure 56 - Min/Max Limits and Limits of the Standard
43
Figure 57 - List of Events
43
Figure 58 - Tree on Events Log
44
Figure 59 - Preview of Table of Events
45
Analysis of Perturbations
46
Figure 60 - Events / Reports
46
Analysis of Voltages and Currents (U/I)
47
Figure 61 - Recorded Voltage Sag (Evaluated both by Half-Cycle RMS and the Curves)
47
Figure 62 - Analysis of Voltages and Currents
47
Analysis of Harmonics
48
Figure 63 - Analysis of Harmonics
48
ANALYSIS of Flickers
49
Figure 64 - Choice of the Individual Harmonics to be Displayed
49
Figure 65 - Simultaneous Display of THD Values and Individual Harmonics
49
Figure 66 - Analysis of Flickers (Pst & Plt)
50
Analysis of Unbalances
51
Figure 67 - Analysis of Unbalances
51
Figure 68 - Frequency Analysis
51
Frequency
51
8 Generating Measurement File Reports
52
Creating Reports
52
Figure 69 - Creating a Report
52
Generating a Report
53
Figure 70 - Example of the First Pages of a Weekly Report Per en 50160 in MS-Word Format
53
9 Warranty, Responsibility and Intellectual Property
54
Warranty
54
Responsibility
54
Property Rights
54
Table of Illustrations
55
Advertisement
Advertisement
Related Products
Chauvin Arnoux Enerdis MAP600 Series
Chauvin Arnoux Enerdis MAP607
Chauvin Arnoux Enerdis MAP620
Chauvin Arnoux Enerdis MAP610
Chauvin Arnoux Enerdis MAP640
Chauvin Arnoux DigiFlex MA4000D-350
Chauvin Arnoux DigiFlex MA4000D
Chauvin Arnoux MiniFLEX MA200
Chauvin Arnoux DigiFLEX MA400D
Chauvin Arnoux AEMC MiniFlex MA193-10-BK
Chauvin Arnoux Categories
Measuring Instruments
Multimeter
Test Equipment
Thermometer
Data Loggers
More Chauvin Arnoux Manuals
Login
Sign In
OR
Sign in with Facebook
Sign in with Google
Upload manual
Upload from disk
Upload from URL