Tektronix FCA3000 Series User Manual
Timer/counter/analyzers, microwave counter/analyzers
Hide thumbs
Also See for FCA3000 Series:
- Programmer's manual (191 pages) ,
- Quick start user manual (104 pages) ,
- Instructions manual (10 pages)

Related Manuals for Tektronix FCA3000 Series


Summary of Contents for Tektronix FCA3000 Series
- Page 1 FCA3000 and FCA3100 Series Timer/Counter/Analyzers MCA3000 Series Microwave Counter/Analyzers User Manual *P077049301* 077-0493-01...
- Page 2 FCA3000 and FCA3100 Series Timer/Counter/Analyzers MCA3000 Series Microwave Counter/Analyzers User Manual www.tektronix.com 077-0493-01...
- Page 3 Tektronix, with shipping charges prepaid. Tektronix shall pay for the return of the product to Customer if the shipment is to a location within the country in which the Tektronix service center is located. Customer shall be responsible for paying all shipping charges, duties, taxes, and any other charges for products returned to any other locations.
-
Page 5: Table Of Contents
Table of Contents General Safety Summary ..................Preface ....................... About This Manual .................... Features ......................Powerful and Versatile Functions ................No Mistakes ....................Design Innovations ..................Remote Control ....................Unpacking ......................Standard Accessories ..................Identification ....................Installation ...................... Getting Acquainted with Your Instrument ............... Front Panel ..................... - Page 6 Table of Contents Duty Factor A/B ....................Time Measurement Errors ................... Phase Measurements ....................Resolution ..................... Possible Errors ....................Totalize (FCA3100 Series Only) ................Voltage Measurements .................... , and V ........................................Math and Statistical Measurements................Averaging ...................... Mathematics ....................Statistics .......................
-
Page 7: General Safety Summary
General Safety Summary Review the following safety precautions to avoid injury and prevent damage to this product or any products connected to it. To avoid potential hazards, use this product only as specified. Only qualified personnel should perform service procedures. While using this product, you may need to access other parts of a larger system. - Page 8 General Safety Summary Terms in This Manual These terms may appear in this manual: WARNING. Warning statements identify conditions or practices that could result in injury or loss of life. CAUTION. Caution statements identify conditions or practices that could result in damage to this product or other property.
-
Page 9: Preface
Features that are specific to a particular instrument or instrument series are clearly marked. Instrument references: FCA3X00 means any FCA3000 Series or FCA3100 Series instrument FCA3000 means any FCA3000 Series instrument (FCA3000, FCA3003, FCA3020) FCA3100 means any FCA3100 Series instrument (FCA3100, FCA3103,... -
Page 10: Powerful And Versatile Functions
Preface Measurement Statistics, Histogram, and Trend Plot modes Front or rear input connection options Powerful and Versatile Functions A unique performance feature in your new instrument is the comprehensive arming possibilities, which allow you to characterize virtually any type of complex signal concerning frequency and time. -
Page 11: Design Innovations
±1 clock pulse (10 ns) is reduced to 100 ps for the FCA3000 Series and 50 ps for the FCA3100 Series. Since the measurement is synchronized with the input signal, the resolution for frequency measurements is very high and independent of frequency. - Page 12 Preface Fast GPIB Bus These counters are not only extremely powerful and versatile instruments, they also feature fast bus communications. The bus transfer rate is up to 2000 triggered measurements/s. Array measurements to the internal memory can reach 250 k measurements/s.
-
Page 13: Unpacking
If this fuse is blown, it is likely that the power supply is badly damaged. Do not replace the fuse. Send the instrument to a Tektronix Service Center. Removing the cover for repair, maintenance and adjustment must be done only by qualified and trained personnel, who are fully aware of the hazards involved. - Page 14 Unpacking Grounding Grounding faults in the line voltage supply will make any instrument connected to it dangerous. Before connecting any unit to the power line, you must make sure that the protective ground functions correctly. Only then can a unit be connected to the power line and only by using a three-wire line cord.
-
Page 15: Getting Acquainted With Your Instrument
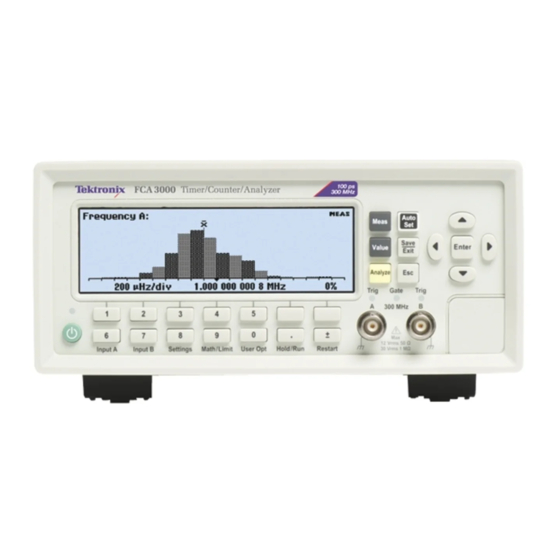
Getting Acquainted with Your Instrument Front Panel 1. Power button (See page 10, Power Button.) 2. Main screen (See page 6, Main Screen.) 3. Measurement buttons (See page 10, Measure Button.) 4. Navigation buttons (See page 11, Save/Exit Button.) 5. Input connectors (See page 4, Input Connectors.) 6. -
Page 16: Input Connectors
Factory Option RP moves the input connectors from the front panel to the rear panel for FCA3000 Series and FCA3100 Series instruments. The Gate and Trig A/B LED indicators remain on the front panel. Option RP is not available on MCA3000 Series instruments. -
Page 17: Rear Panel
Getting Acquainted with Your Instrument Rear Panel 1. Pulse Output connector (FCA3100 Series only). 2. ID label, including model, serial, and installed options numbers. 3. Line power connector. 4. USB 2.0 12 Mb/s port to connect to PC. 5. GPIB port to connect to controller. 6. -
Page 18: Main Screen
Getting Acquainted with Your Instrument Main Screen The instrument uses a monochrome LCD to show signal sources, instrument measurements (numerical and graphical), and menu items. What items are shown depends on the display mode. Measurement Value Mode Push the Value button to display a high-resolution numeric readout of the current measurement. - Page 19 Getting Acquainted with Your Instrument face when the measurement is outside of the limits). The LIM status text at the top of the screen flashes when the measurement exceeds the limits, and continues to flash even when the measurement is back within limits. Pushing Restart resets the LIM status.
- Page 20 Getting Acquainted with Your Instrument Adev: Allan deviation Std: Standard deviation Histogram display. The instrument displays successive measurements as a histogram. The number of bins along the horizontal axis are set in the Settings > Stat menu. 1. The upper and lower Limits Alarm levels (if enabled). When limit testing is active, the instrument autoscales the graph to show both the histogram and the limit.
- Page 21 Getting Acquainted with Your Instrument 1. The upper and lower frequency range of the plot display. The trend plot graph continually autoscales based on the measured data to show the measurement trend values. 2. The percent of the measurement completed. 3.
-
Page 22: Controls
Getting Acquainted with Your Instrument Controls Power Button Push the Power button to power on or off the instrument. The Power button is a secondary power switch; power is applied to some of the instrument as soon as line power is applied, indicated by the red LED above the button. To completely remove power from the instrument, disconnect the power cord. - Page 23 Getting Acquainted with Your Instrument Auto Set Button Use the Auto Set button to automatically set trigger levels for the measurement function and input signal amplitude (for relatively normal signals). This enables you to quickly set the instrument to display a measurement. Pushing the Autoset button once does the following: Sets automatic trigger levels Sets attenuators to 1x...
- Page 24 Getting Acquainted with Your Instrument Arrow and Enter Buttons The Arrow and Enter buttons provide multiple functions depending on the instrument mode: Menu mode: Use the left-arrow, right-arrow, and Enter buttons to display and select menu items. Numeric entry mode: Use the left-arrow button to clear the right-most digit in a settings field.
- Page 25 Getting Acquainted with Your Instrument To set a specific trigger level, select the Manual trigger mode, select the Trig menu item, and use the Navigation arrow buttons to increment/decrement the value. You can also use the numeric buttons and push Enter to enter a value. The Filter Settings menu lets you select a fixed 100 kHz analog filter or an adjustable digital filter.
-
Page 26: Entering Numeric Values
Getting Acquainted with Your Instrument To take a single measurement, place the instrument in Hold mode, and then press the Restart button. The measurement indicator in the upper right corner of the screen changes from HOLD to SING when the instrument is taking a single measurement. - Page 27 Getting Acquainted with Your Instrument Table 1: The Input A, Input B menus (cont.) Item Description Trig Sets the signal trigger level. The value shown is the current trigger level. Filter Sets a fixed 100 kHz analog or an adjustable digital cutoff filter. Use the Digital LP Frequency menu to set a specific frequency.
- Page 28 Getting Acquainted with Your Instrument Table 2: The Settings menu (cont.) Item Description Misc Sets miscellaneous measurement parameters: Interpolator Calibration enables or disables the instrument interpolator calibration, which increases the measurement speed at the expense of accuracy. Smart Measure sets: Smart Time Interval (for Time Interval measurements), which uses time stamping to determine which measurement channel precedes the other.
- Page 29 Getting Acquainted with Your Instrument Math/Limit Menu The Math/Limit menu provides settings for applying mathematical calculations to a measurement and enabling the instrument to perform limit testing. Table 3: The Math submenu Item Description Math Use this menu to select one of five formulas to apply to the measurement result, or select Off to disable the math function.
- Page 30 Getting Acquainted with Your Instrument User Opt Menu The User Opt menu lets you set general instrument parameters. Table 5: The User Opt menu Item Description Save/Recall Save or recall up to twenty instrument configuration setups or eight measurement data sets in nonvolatile memory. Submenu items are: Setup: Save Current Setup: Save the current instrument configuration to a specified memory.
- Page 31 Getting Acquainted with Your Instrument Table 5: The User Opt menu (cont.) Item Description Digit Blanks Sets the number of display digits to mask. Jittery measurement results can be made easier to read by masking one or more of the least significant digits. Use the Up or Down arrow keys to change the number, or enter the desired number (between 0 and 13) from the keypad.
- Page 32 Getting Acquainted with Your Instrument FCA3000, FCA3100, and MCA3000 Series User Manual...
-
Page 33: Input Signal Conditioning
Input Signal Conditioning The instrument provides input amplifiers to adapt the widely varying signals in the ambient world to the measuring logic of the instrument. These amplifiers have many controls, and it is essential to understand how these controls work together and affect the signal. - Page 34 Input Signal Conditioning Coupling Switch between AC coupling and DC coupling by toggling the softkey AC/DC. Use the AC coupling feature to eliminate unwanted DC signal components. Always use AC coupling when the AC signal is superimposed on a DC voltage that is higher than the trigger level setting range.
- Page 35 Input Signal Conditioning Figure 1: The menu choices after selecting FILTER. Analog Low-pass Filter. The instrument has analog RC low-pass filters, one each for Input A and B. The cutoff frequency is approximately 100 kHz, and the signal rejection is 20 dB at 1 MHz. Accurate frequency measurements of noisy low-frequency signals (up to 200 kHz) can be made when the noise components have significantly higher frequencies than the fundamental signal.
- Page 36 Input Signal Conditioning Figure 2: Digital LP filter operates in the measuring logic, not in the input amplifier. Trigger Mode (Man/Auto) This menu item sets the trigger mode. When Auto is active the instrument automatically measures the peak-to-peak levels of the input signal and sets the trigger level to 50% of that value.
- Page 37 Input Signal Conditioning Manual Trigger (Trig) The Trig menu lets you enter a specific trigger value. Use the arrow buttons to increment or decrement the trigger level value, or use the keypad to enter a specific value. Keep the arrow buttons depressed for faster response. Setting manual trigger levels speeds up the measurement cycle.
-
Page 38: How To Reduce Or Ignore Noise And Interference
Input Signal Conditioning How to Reduce or Ignore Noise and Interference The instrument input circuits are sensitive to noise. Matching the input signal amplitude and noise characteristics to the instrument’s input sensitivity (trigger levels) reduces the risk of wrong counts from noise and interference. For example, an incorrect trigger level with a narrow hysteresis can cause incorrect counts on variable-level signals, as shown in the following figure. - Page 39 Input Signal Conditioning You can use several of the above techniques simultaneously to make reliable measurements possible on very noisy signals. Optimizing the input amplitude and trigger level, and using the attenuator and the trigger control, is independent of input frequency and useful over the entire frequency range.
- Page 40 Input Signal Conditioning Wrong counts caused by trigger errors are much more common. To avoid incorrect counting caused by spurious signals, reduce input signal amplitudes. This is particularly true when measuring on high impedance circuitry and when using 1 MΩ input impedance. Under these conditions, the cables easily pick up noise. External attenuation and the internal 10x attenuator reduce the signal amplitude, including the noise, while the internal sensitivity control in the instrument reduces the instrument’s sensitivity, including sensitivity to noise.
- Page 41 Input Signal Conditioning This is done with a successive approximation method to determine the signal minimum and maximum trigger levels (the levels where triggering just stops). The instrument then sets the hysteresis levels to the calculated values. The default relative hysteresis levels are indicated by 70% on Input A and 30 % on Input B. These values can be manually adjusted between 50% and 100% on Input A and between 0% and 50% on Input B.
- Page 42 Input Signal Conditioning FCA3000, FCA3100, and MCA3000 Series User Manual...
-
Page 43: Frequency Measurements
Frequency Measurements Theory of Measurement Reciprocal Counting The FCA3000, FCA3100, and MCA3000 Series instruments use a high-resolution reciprocal counting technique that synchronizes the measurement start with the input signal. This results in an exact number of integral input cycles to count. Reciprocal counting is a significant improvement over simple frequency counters that count the number of input cycles during a preset, nonsynchronized gate time. - Page 44 Frequency Measurements Time-Out Mainly for GPIB use, you can manually select a fixed time-out in the menu reached by pressing Settings > Misc > Timeout. The range of the fixed time-out is 10 ms to 1000 s, and the default setting is Off. Select a time that is longer than the cycle time of the lowest frequency you are going to measure;...
- Page 45 Frequency Measurements Figure 3: Divide-by-16 prescaler. The figure shows the effect of the 3 GHz prescaler. For 16 input cycles, the prescaler gives one square wave output cycle. When the instrument uses a prescaler, it counts the number of prescaled output cycles, such as f/16. The display shows the correct input frequency since the instrument compensates for the effect of the division factor d as follows: Prescalers do not reduce resolution in reciprocal counters.
- Page 46 Frequency Measurements When measuring pulses with a low repetition rate, such as a 0.1 Hz pulse with a nonprescaled measurement like Period Sgl, the measurement requires at least the duration of one cycle, that is 10 seconds, and at worst nearly 20 seconds. The worst case is when a trigger event took place just before the beginning of a measurement time, as shown in the following figure.
- Page 47 Frequency Measurements The presence of a burst signal to be measured makes certain demands upon the signal itself. Regardless of the instrument’s ability to measure during very short measurement times, the burst duration must meet the following minimum conditions: Normally the real minimum limit is set by other factors, like the speed of the Go-detector.
-
Page 48: Input A, B
Frequency Measurements 1. Preacquisition: This process detects if there is a measurable signal present at the input and determines the LO frequency that will provide an IF signal above a certain threshold level. This is done by sequentially stepping the LO from the highest value in the look-up table to the lowest value and applying the resulting comb generator spectrum to the mixer. - Page 49 Frequency Measurements Frequencies above 100 Hz are best measured using the Default Setup. (See page 85, Default Instrument Settings.) Then Freq A is selected automatically. Other important automatic settings are AC Coupling, Auto Trig and Meas Time 200 ms. The default settings provide a successful starting point for frequency measurements.
-
Page 50: Input C
Frequency Measurements Input C FCA3X00 Series The Input C prescaler in applicable FCA3X00 Series instruments lets you measure up to 20 GHz. The Input C prescaler is fully automatic and no setup is required. Instruments MCA3000 Series The MCA3000 Series instruments measure RF frequencies up to 27 GHz or 40 GHz by means of an automatic down-conversion technique. - Page 51 Frequency Measurements The general frequency limitations for the respective measuring channel also apply to burst measurements. The minimum number of cycles in a burst on Input A or Input B is 3 below 160 MHz and 6 between 160 MHz and 400 MHz. Burst measurements on Input C involve prescaling, so the minimum number of cycles is 3 x prescaling factor.
- Page 52 Frequency Measurements 1. Push Meas > Freq > Freq Burst. 2. Select the input source A, B, or C. 3. Push Settings > Burst. 4. Push Meas Time and enter a measurement time value that is shorter than the burst duration minus two CW cycles. If you do not know the approximate burst parameters of your signal, always start with a short measurement time and increase it gradually until the readout gets unstable.
-
Page 53: Frequency Modulated Signals
Frequency Measurements After the set measurement time has started, the instrument synchronizes the start of the measurement with the second trigger event in the burst. This means that the measurement does not start erroneously during the Burst Off duration or while inside the burst. - Page 54 Frequency Measurements Frequency f To determine the carrier wave frequency, measure f which is a close mean approximation of f 1. Push Analyze to get an overview of all the statistical parameters. 2. Select the measurement time so that the instrument measures an even number of modulation periods.
- Page 55 Frequency Measurements Modulation frequencies above 1 kHz. 1. Turn off Single. 2. Set a long measurement time that is an even multiple of the inverse of the modulation frequency. You will get a good approximation when you select a long measurement time, for instance 10 s, and when the modulation frequency is high, above 1000 Hz.
-
Page 56: Am Signals
Frequency Measurements Δ f (P-P) 1. Push Settings > Stat and set No.of samples to 1000 or more. 2. Push Meas Time and select a low value. 3. Push Analyze and read P-P. Errors in f , and Δf A measurement time corresponding to 1/10 cycle, or 36° of the modulation signal, leads to an error of approximately 1.5%. - Page 57 Frequency Measurements To measure the CW frequency: 1. Push the Input A menu button. 2. Select a measurement time that gives you the resolution you want. 3. Enable Manual trigger. 4. Push Trig level and enter 0 V trigger level and Save|Exit). 5.
-
Page 58: Period
Frequency Measurements 5. Push Trig and enter a trigger level that makes the instrument trigger according to the following figure. The PRF readout shows the modulating frequency even though the main frequency reading may be unstable. Period Single A, B and Avg. A, B, Menu path: Meas >... -
Page 59: Frequency
Frequency Measurements Every positive or negative zero crossing (depending on the selected slope) up to the maximum frequency (125 kHz with interpolator calibration On or 250 kHz with interpolator calibration Off) is time-stamped. For every new time stamp the previous value is subtracted from the current value and displayed. In Value mode the display is updated every new period if the period time exceeds 200 ms. -
Page 60: Time Measurements
Time Measurements Time Measurements Introduction Measuring the time between a start and a stop condition on two separate channels is the basis for all time interval measurements. In addition to Time Interval A to B, the counters also offer other channel combinations and derived functions like Pulse Width and Rise/Fall Time. -
Page 61: Time Interval
Time Measurements Even though the input amplifiers have high sensitivity, the hysteresis band has a finite value that would introduce a small timing error for signals with different rise and fall times, for instance asymmetrical pulse signals like those in the previous figure. -
Page 62: Time Interval Error (Tie) (Fca3100 Series Only)
Time Measurements 1. Select the general Time Interval function described above and set the trigger levels manually after calculating them from the absolute peak values. Then you can benefit from the auxiliary parameters V and V . For measurements made on Input A, use the following settings: Rise Time: Trig Level A = V +0.2 (V... -
Page 63: Pulse Width A/B
Time Measurements Pulse Width A/B Menu path: Meas > Pulse > Width Positive, Meas > Pulse > Width Negative. Either Input A or Input B can be used for measuring, and both positive and negative pulse width can be selected. Positive pulse width means the time between a rising edge and the next falling edge. -
Page 64: Time Measurement Errors
Time Measurements Time Measurement Errors Hysteresis The trigger hysteresis can cause time measuring errors. Timing measurement triggers occur when the input signal crosses the entire hysteresis band, not when the input signal crosses at 50 percent of the amplitude, as shown in the following figure: The hysteresis band is about 20 mV at 1x attenuation, and 200 mV at 10x attenuation. - Page 65 Time Measurements Auto Trigger Auto trigger is very effective for measuring unknown signals. However, overshoot and ringing can cause Auto trigger to choose slightly wrong minimum and maximum signal levels. This does not affect measurements like frequency, but transition time measurements may be affected. Therefore, when working with known signals such as logic circuitry, set the trigger levels manually.
-
Page 66: Phase Measurements
Phase Measurements Phase Measurements Phase is the time difference between two signals of the same frequency, expressed as an angle. The traditional method to measure phase delay with a timer/instrument is a two-step process consisting of two consecutive measurements; a period measurement followed immediately by a time interval measurement. -
Page 67: Resolution
Phase Measurements Resolution You can take phase measurements on signals up to 160 MHz. The measurement resolution depends on the frequency. For frequencies below 100 kHz the resolution is 0.001°; for frequencies above 10 MHz it is 1°. Phase measurement resolution can be further improved by using the built-in statistics functions to average the measurement. - Page 68 Phase Measurements Use the example above and add some noise so that the S/N ratio is 40 dB. This corresponds to an amplitude ratio of 100 times (and power ratio of 10000 times). Then the trigger noise will contribute to the random error with: The sum of random errors should not be added linearly, but in an “RMS way”, because of their random nature.
- Page 69 Phase Measurements The trigger level timing error depends on the following factors: The actual trigger point is not exactly zero, due to trigger level DAC uncertainty and comparator offset error. The two signals have different slew rates at the zero-crossing. Every instrument has input hysteresis.
- Page 70 Phase Measurements Methods of compensation. The calculations above show the typical uncertainties in the constituents that make up the total systematic phase error. For a given set of input signals you can compensate for this error more or less completely by making calibration measurements.
-
Page 71: Totalize (Fca3100 Series Only)
Phase Measurements Residual systematic error. By mathematically (on the bench or in the controller) applying corrections according to one of the methods mentioned above, the systematic error is reduced, but not fully eliminated. The residual time delay error will most probably be negligible, but a trigger level error will always remain to a certain extent, especially if the temperature conditions are not constant. - Page 72 Phase Measurements Totalize A–B This measurement lets you calculate the difference between trigger events on Input A and Input B. Auxiliary parameters are A and B. Start/Stop is manually controlled by toggling the button Hold/Run, and the counting registers are reset by pressing Restart.
- Page 73 Phase Measurements Start Slope: Select Positive slope (marked by a rising edge symbol). Start Delay: Decide if you need to insert a delay (10 ns - 2 s) between the control signal and the actual opening of the gate. Stop Delay: Decide if you need to insert a delay (10 ns - 2 s) during which the gate will not respond to the control signal on the Stop Channel.
- Page 74 Phase Measurements 5. Set the trigger level for Input A manually to a suitable value. 6. Push Settings > Arm and set the following parameters: Arm on Sample/Block: Decide if each event or each block of events (STATISTICS mode) should be armed. Start Channel: Select A.
-
Page 75: Voltage Measurements
Voltage Measurements Voltage Measurements , and V The instrument can measure the input voltage levels V and V on DC input voltages (from –50 V to +50 V in two automatically selected ranges) and on repetitive signals between 1 Hz and 300 MHz. Measurement accuracy is about 1% of the reading. - Page 76 Voltage Measurements 1. Push Math/Limit > Math > Math(Off) > K*X+L. 2. Push K and enter 0.354. 3. Check that the L constant is set to its default setting of 0 (zero). 4. Confirm your choices with the menu softkeys below the display and exit the menus.
-
Page 77: Math And Statistical Measurements
Math and Statistical Measurements Math and Statistical Measurements The instruments provide Averaging, Mathematics and Statistics post-processing functions. You can use these functions separately or combine them. Averaging The Frequency and Period Average measurements use hardware-based averaging (counting clock pulses during several full input signal cycles) for their averaged measurement results. -
Page 78: Statistics
Math and Statistical Measurements For example, to measure the deviation from a certain initial frequency (instead of measuring the frequency itself), do the following: 1. Recall the default settings by pressing User Opt > Save/Recall > Recall Setup > Default. 2. - Page 79 Math and Statistical Measurements Adev: Displays the Allan deviation (σ) of a sampled population of N values and is calculated as follows. It is defined as the square root of the Allan variance. The number N in the statistic expressions is the number of samples, and is an integer value between 2 and 2*10 Allan Deviation Versus Allan deviation is a statistic used for characterizing short-term instability (such as...
- Page 80 Math and Statistical Measurements 7. Push Restart to initiate one data capture. 8. Toggle Analyze to view the measurement result in each of the different statistical presentation modes. NOTE. The instrument updates the screen with intermediate results until the complete data capture is done. Statistics and When using statistics, you must take care that a measurement does not take too long a time to perform.
- Page 81 Math and Statistical Measurements To measure the slower variation, calculate the Max, Min, or Mean values on a long series of averaged samples. Averaging eliminates the jitter in each sample and the long measuring time and large number of samples means that the measurement can record very slow variations.
- Page 82 Math and Statistical Measurements The instrument displays a Mean value = 100.020 μs and a Std Dev = 50 ns. Therefore the 95.5% confidence limits = ±2s (= ±2 * 50 ns) = ±100 ns. The 3σ limit will then be ±3 * 50 ns = ±150 ns Jitter Measurements Statistics provides an easy method to determine the short-term timing instability (jitter) of pulse signals.
-
Page 83: Limit Testing
Limit Testing Limit Testing The Limits Mode makes the instrument an efficient alarm condition monitor (limit tester). You can monitor measurement results in real time and set an action to take when a limit condition is exceeded. Push Math/Limit > Limits to open the Limits menu. - Page 84 Limit Testing If Range is selected and the presentation mode is Value, a simple graphic representation of the current measurement value in relation to the limits can be seen at the same time as the numerical value. The upper limit (UL) and the lower limit (LL) are vertical bars below the main numerical display, and their numerical values are displayed in small digits adjacent to the bars.
-
Page 85: Arming
Arming Arming starts and/or stops measurement acquisition when the instrument detects a change on a specified input signal. The available arming types are Arm Start and Arm Stop (in the Settings > Arm menu). Arming is useful for taking frequency measurements in more complex signals such as: Single-shot events or non-cyclic signals Pulse signals where pulse width or pulse positions can vary... -
Page 86: Start And Stop Arming
Arming Start and Stop Arming Arm Start Arm Start acts like an external trigger on an oscilloscope. It synchronizes the start of the actual measurement to a signal event. You can also use delay with the Arm Start function to delay the start of a measurement with respect to the arming pulse. Arm Start can be used alone to take a measurement, or combined with Arm Stop to take longer measurements. -
Page 87: Arming Input Signals
Arming The available Arm Stop parameters are Channel, Slope, and Delay. NOTE. Arm > Stop Delay time can only be used with the Totalize function in the FCA3100 Series instruments. Arm Start/Stop and Burst Burst measurements taken by using Arm Start/Stop conditions use the normal Frequency measurement mode. -
Page 88: Arming And Setup Time
Arming 1. Connect the signal to Input A, and to Input B with a power splitter. 2. Push Input A and adjust the settings to measure the waveform section of interest. 3. Push Input B and adjust the settings to detect the unique trigger point. Use DC coupling and Manual triggering to set a specific level. -
Page 89: Arming Examples
Arming The setup time is different when using arming delay. The following figure shows the time from the expired time delay until the measurement is armed (–60 to +40 ns, for a total of 100 ns delay resolution). The figure shows that a start trigger signal may be detected although it appears 60 nanoseconds before the programmed time delay has expired. - Page 90 Arming The task is to synchronize the start of the measurement (start trigger) to the leading edge of the first pulse. Depending on the signal timing, this can be easy, difficult, or very difficult. Auto synchronization without arming. It is possible to measure a pulse within a burst without using the arming function.
- Page 91 Arming Do the following to perform synchronization using start arming: 1. Connect the external sync signal toInput E (on the rear panel). 2. Connect the burst signal to Input A. 3. Adjust the trigger level to trigger on the burst signal. 4.
- Page 92 Arming 7. Repeatedly push Save | Exit to return to the main screen. 8. Push Meas > Pulse > Width Positive > A. Arming Example: This example shows how to measure the width of the second pulse in the pulse train.
- Page 93 Arming Arming Example: In the previous examples, the synchronization task identified the start of a measurement and performed a single-shot time interval measurement. The Measuring the Time following example measures the time between the rising edge of the first and Between Pulses in a Burst fourth pulses in a burst, as shown in the following figure.
-
Page 94: Arming And Profiling
Arming Make sure the start arming conditions from example #1 are maintained, that is no arming delay. Measure the signal. Using stop arming (External hold off) to delay the stop. So far in these examples, the sync signal was used exclusively as a start arming signal; that is, the measurement triggering has focused on the leading edge of the sync signal, and not its duration. - Page 95 Arming Free-Running Free-running measurements are performed over a longer period. Typical free-running measurements include determining the stability of an oscillator over Measurements a 24-hour period, measuring the initial drift of a generator during a 30-minute warm-up time, or measuring the short-term stability of a device. In these cases, measurements are taken at user-selected intervals in the range of 2 μs to 1000 s.
- Page 96 Arming Figure 11: Setup for transient profiling of a VCO. Figure 12: Results from a transient profiling measurement. Use the results of all 100 measurements to plot frequency versus time. Note that the absolute accuracy of the time scale is dependent on the input signal itself. Although the measurements are armed at 100 μs ±100 ns intervals, the actual start of measurement is always synchronized to the first input signal trigger event after arming.
-
Page 97: Appendix A: Default Instrument Settings
Appendix A: Default Instrument Settings The following table lists the factory default instrument settings. Push User Opt > Save/Recall > Setup > Recall setup > Default to set the instrument to these settings. (See page 18.) Parameter Default value Input A & B Trigger Level Auto Trigger Slope... - Page 98 Appendix A: Default Instrument Settings Burst Sync Delay 400 μs Start Delay Measure Time 200 μs Freq. Limit 400 MHz Miscellaneous Function Freq A Smart Frequency Auto Smart Time Interval Measure Time 200 ms Auto Trig Low Freq 100 Hz Time base Reference Auto Blank Digits...
-
Page 99: Appendix B: Controlling Measurement Timing
Appendix B: Controlling Measurement Timing The Measurement Process Since these instruments use the reciprocal counting technique, they always synchronize the start and stop of the actual measuring period to the input signal trigger events. A new measurement automatically starts when the previous measurement is finished (unless Hold is on). - Page 100 Appendix B: Controlling Measurement Timing A gradual increase of the measurement time reduces the instability in the LSD caused by the quantization uncertainty. At a specific measurement time setting, the instrument is justified to display one more digit. That one additional digit suddenly gives ten times more display resolution, but not a ten times less quantization uncertainty.
-
Page 101: Index
Index Average period measurement, 46, About (the instrument), 19 Calculating measurement Above (limit testing), 71 confidence limits, 69 AC input coupling, 22 Calibrate, 18 Additional measurement Calibration date, 19 Back-to-back frequency controls, 88 Capture (limit testing), 71 measurement, 47 Adev, 67 Carrier wave frequency, 42 Back-to-back period Alarm (limit testing), 71... - Page 102 Index Examples Limit submenu calculating confidence Limit Behavior, 17 Impedance, input, 21 limits, 69 Limit Mode, 17 Inaccuracies (phase), 55 math expressions, 66, 67 Lower Limit, 17 Input measure deviation from Upper Limit, 17 A and B (Arming), 75 specified frequency, 66 Limit testing, 71 analog low-pass filter, 22 measure first pulse width in a...
- Page 103 Index Adev (Allan deviation), 66 math expressions, 65 setting sampling alarms (limit testing), 71 Max, 66 parameters, 67 AM carrier wave, 44 maximum frequency, 43 setup time, arming, 76 AM signals, 44 Mean, 66 single period, 46 amplitude modulating measure deviation from speed up statistical frequency, 45 specified frequency, 66,...
- Page 104 Index RF signal measurement theory, 34 Statistics, 66 Right arrow button, 12 Statistics and mathematics, 69 Navigation buttons, 12 Rise/Fall time measurement, 49 Statistics and Measurement Noise, 26 Speed, 68 Non-cyclic signals, 73 Std, 66 Numerical statistical Stop measurements (Hold), 13 measurements, 7 Safety Summary, iii Sync delay, 40...
- Page 105 Index Trigger Auto (Wide) Hysteresis, 28 UL (limit testing), 72 Value button, 10 convert auto trigger level to Uncertainty calculation, 69 Vmax, 63 manual, 25 Up arrow button, 12 Vmin, 63 faster measurements, 24 Upper Limit, 17 Voltage measurements, 63 harmonic distortion, 29 User Opt button, 13, 18 Vpp, 63...
Need help?
Do you have a question about the FCA3000 Series and is the answer not in the manual?
Questions and answers