
Subscribe to Our Youtube Channel
Related Manuals for PASCO SE-9654


Summary of Contents for PASCO SE-9654
- Page 1 Instruction Manual 012-14266B Zeeman Effect Experiment Model SE-9654 Brolight Technology Co., Ltd...
-
Page 2: Table Of Contents
Table of Contents Equipment List - - - - - - - - - - - - - - - - - - - - - - - - - - - - - - - - - - - - - - - - - - - - - - - - - - - - 1 Limited Warranty and Limitation of Liability - - - - - - - - - - - - - - - - - - - - - - - - - - - - - - - - 3 Safety Information - - - - - - - - - - - - - - - - - - - - - - - - - - - - - - - - - - - - - - - - - - - - - - - - - 3 Electrical Symbols - - - - - - - - - - - - - - - - - - - - - - - - - - - - - - - - - - - - - - - - - - - - - - - - - 4... -
Page 3: Equipment List
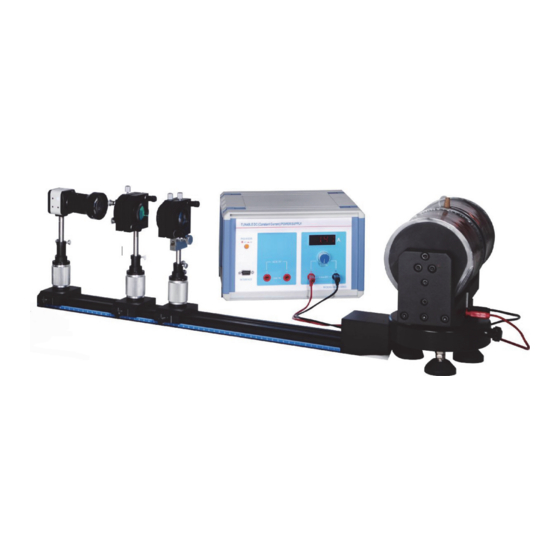
Instruction Manual 012-14266B Zeeman Effect Experiment SE-9654 5. and 6. 3. and 4. Equipment List Included Items Model Quantity Zeeman Effect Experiment SE-9654 1. CMOS Camera 2. Camera Lens 3. Fabry-Perot Interferometer 4. Interference Filter 5. Polarizing Filter 6. Collimating Lens 7. - Page 4 Zeeman Effect Experiment Information Sheet (not shown) Software Description The PASCO Capstone Software (included) allows the user to record video of the Zeeman Effect interference patterns, and then play back the video frame-by-frame to measure the triplet rings in the patterns. The software also allows the user to apply calculations to the data and to display the results in tables.
-
Page 5: Limited Warranty And Limitation Of Liability
Zeeman Effect Experimen t Limited W a r r a n t y a n d L i m i t a t i o n o f Li a bi l i ty Storage Case The Storage Case has cut-out areas for the various components of the Zeeman Effect Experiment. The Fabry-Perot Interferom- eter (3) is used with the interference filter (4), polarizing filter (5), and collimating lens (6) to view the interference pattern that results when the 546.1 nanometer (nm) “green”... -
Page 6: Electrical Symbols
SE-9654 Z eeman E ffect E xperiment • Do not use the equipment if it operates abnormally. Protection may be impaired. When in doubt, have the equipment serviced. • Do not operate the equipment where explosive gas, vapor, or dust is present. Don't use it under wet conditions. -
Page 7: Introduction
The included CMOS (complementary metal-oxide semiconductor) camera sends the interference pattern to a computer where the PASCO Capstone software (included) records and analyzes the pattern. Data from the pattern that is polarized perpendicular to the magnetic field axis is then used to calculate the Bohr magneton, the intrinsic magnetic dipole moment of an electron in the ground state. - Page 8 SE-9654 Z eeman E ffect E xperiment Figure 1 is not to scale. The splitting between the 2J + 1 levels is much less (~10 ) than the splitting between the original two levels. Figure 1: Energy Levels for 546.1 nm Mercury Spectral Line In the diagram, M is the projection of the orbital angular momentum on the z axis.
-
Page 9: Fabry-Perot Interferometer
Zeeman Effect Experimen t Theory where A is the area of the current loop. Note that this derivation is not quantum mechanically correct and gives the wrong value for the first Bohr orbit of hydrogen, but the value for the Bohr magneton is correct. The Landé... -
Page 10: Final Theory
SE-9654 Z eeman E ffect E xperiment ----------- - 2d l ----------- - ----------- - 2d -------------------- AB CB – – – 2d 1 – ... - Page 11 Zeeman Effect Experimen t Final Theo ry Eqn. 12 By measuring the R values in the B = 0 pattern, the constant C can be determined to better than 0.5%. With an applied magnetic field, through a polarizer parallel to the magnetic field, the spectral lines each split into three lines.
-
Page 12: Setup
SE-9654 Z eeman E ffect E xperiment Setup CAUTION: Do not look with your naked eye at the pen type mercury lamp when it is lit. The mer- cury lamp has bright emission lines in the ultraviolet part of the spectrum which can damage your eyes permanently. - Page 13 Zeeman Effect Experimen t S etup the P ower Su pply Setup the Power Supply The SE-9656 TUNABLE DC (Constant Cur- rent) POWER SUPPLY supplies power to the pen-type mercury lamp and the electromagnet (SE-9655). The output for the mercury lamp is 1500 V (volts) AC (alternating current) with a Amperemeter maximum current of 145 mA (milliamperes).
- Page 14 SE-9654 Z eeman E ffect E xperiment NOTE: A good way to check that the mercury lamp is Pen Type Mercury Lamp centered properly is to remove the axial iron core plug (with the knurled silver knob) from one end of the elec-...
-
Page 15: Polarizing Filter
Ze ema n Effe c t E x p e r im e nt M ount th e Polarizing Filter and Collimat i n g Mount the Polarizing Filter and Collimating Lens Set Screws Assemble the polarizing filter and collimating lens on the precision kine- Polarizing Filter matic optical mount that has the one-dimensional (horizontal) adjustable... - Page 16 SE-9654 Z eeman E ffect E xperiment Adjust the two black X - Y adjustment screws on the collimating lens side of the assembly so the polarizer is roughly par- allel to the collimating lens plane. Do this by adjusting the gap between the collimating lens holder and the polarizer holder.
-
Page 17: Experiment Procedure
Use the Included PASCO Capstone Workbook File or the Microsoft Word File... NOTE: The SE-9654 Zeeman Effect Experiment includes the ZEEMAN EFFECT Flash Drive that contains three folders: Zee- man Capstone Files, Zeeman Graphics, and Zeeman Word Files. One of the Zeeman Capstone files (Zeeman Effect.cap) is already configured for use in the Zeeman Effect experiment. - Page 18 ... or, Setup the Experiment in the PASCO Capstone Software Program NOTE: The following pages describe the step-by-step process for configuring a PASCO Capstone workbook file for the Zee- man Effect Experiment, including the setup of displays, calculations, and data tables. Use these pages if you want to learn more about the setup of the Capstone software and the creation of the calculations used to analyze the data.
- Page 19 ) on the Displays Palette at the right side of the workbook to open a four-part Movie dis- play. Figure 14: PASCO Capstone Movie Display In the Movie display, click “Record Movie with Synced Data” in the lower right-hand box.
- Page 20 SE-9654 Z eeman E ffect E xperiment • By default, the movie panel will be in “Monitoring” mode. The displayed image is not being recorded yet. Monitoring Properties Mode Icon Preview button Figure 15: Interference Pattern Example • The interference pattern should appear. See Figure 16.
- Page 21 Zeeman Effect Experimen t . .. or, Setup the Experimen t i n the PASC O C a p - Center the pattern horizontally approximately by moving the camera. To do this, hold the camera, loosen the upper screw on the adjustable post holder, and rotate the camera left or right. Tighten the upper screw. Then use the black X - Y adjust- ment knobs on the interferometer assembly to adjust the vertical position and fine tune the horizontal position.
-
Page 22: Data Recording
SE-9654 Z eeman E ffect E xperiment Data Recording NOTE: Three runs of data will be recorded, but only the first run of data, Run #1, will be used for measuring and analysis. Run #1: Power at 0 A and then Power at 5 A - Polarizer at 90°, Check that the polarizer is set to 90°... - Page 23 Zeeman Effect Experimen t Measuring • NOTE: This means that the radius tool will not be calibrated. This will affect the value of C , but it will not affect the final result. An examination of Equations 12 and 13 shows that the radii are squared in both the denominator and the numerator, so any scale factor cancels out.
- Page 24 SE-9654 Z eeman E ffect E xperiment Farther down in the Properties window, click “Radius Tool” to open the Radius Tool choices. Set the “Number of Decimal Places” to 3. Click “OK” to close the Proper- ties window. One at a time, drag the three circular handles on the Radius tool until they are all on the k = 4 ring and the handles are about 120 degrees apart.
- Page 25 R minus (m) Setup the Data Displays in Capstone Create a new page in PASCO Capstone by clicking the Add Page button to the left of the first tab (Page#1). Label it Data Analysis. Click the Four Displays icon at the lower right of the workbook.
- Page 26 SE-9654 Z eeman E ffect E xperiment Click the icon ( ) in the center of the upper left display and select “Table” from the pop-up. Figure 21: Select Table from the menu Setup Table 1 Click the Table display where it says “Table title here” and label this table: “Table 1: B = 0 Data”. Add a third column to the table by clicking the “Insert empty column to the right”...
- Page 27 Zeeman Effect Experimen t Setup the Data Displays in Capstone Click the black triangle button ( ) next to the Statistics icon (a capital sigma ) and deselect “Minimum” and “Maxi- mum”. Next, click the Statistics icon to display “Mean” and “Std. Dev.” at the bottom of the table. Click “Statistics”...
- Page 28 SE-9654 Z eeman E ffect E xperiment • The workbook page with three table displays should appear as below. Figure 24: Workbook page with three table displays Label the First Two Columns of Each Table Click “Select Measurement” at the top of column 1 in Table 1. Click “Create New” and select “User-Entered Data” from the menu.
- Page 29 Zeeman Effect Experimen t Setup the Data Displays in Capstone • The workbook page should appear as below. Figure 26: Workbook page with table columns labeled Setup the Calculations 14. Click the “Calculator” button ( ) on the left Tools palette to open the Calculator window. 15.
- Page 30 SE-9654 Z eeman E ffect E xperiment 17. Similarly, create lines 6-10. Figure 29: Calculations 6 through 10 18. Create line 6, C , with terms from the Calculator list (click the multi-colored triangle ( )) and with icons from the Calcu- lator keypad.
- Page 31 Zeeman Effect Experimen t Setup the Data Displays in Capstone • The finished workbook page should look like the one below. Figure 31: Finished Workbook Page of Tables 1, 2, and 3 Enter Data into the Tables 26. Type in the measured values for R into the cells in the Capstone “Table 1: B = 0” for the k = 4 to k = 1 rings. 27.
-
Page 32: Conclusions
SE-9654 Z eeman E ffect E xperiment Conclusions If you wish to enter your answers using Capstone, create a new workbook page and label it “Conclusions”. • Double click the icon at the right that says “Text Entry Box” to open an empty text area. -
Page 33: Appendix A: Intensity Of Current (A) And Intensity Of Magnetic Induction (T)
Zeeman Effect Experimen t A ppendix A: Intensity of Curren t (A) an d Inten- Appendix A: Intensity of Current (A) and Intensity of Magnetic Induction (T) The following is an example of the TEST REPORT that is included with the Electromagnet. Each electromagnet should have its own unique TEST REPORT. -
Page 34: Appendix B: Teacher's Notes
SE-9654 Z eeman E ffect E xperiment Appendix B: Teacher’s Notes Sample Data Images: Run #1 and Run #2 Run #1: B 0, Polarizer at 90° (3.50 A) Run #1: B = 0, Polarizer at 90° Run #2: B 0, Polarizer at 0° (3.50 A) Run #2: B ... - Page 35 Zeeman Effect Experimen t Sample Data Table 2: Run #1, B 0, k = 1 Table 3: Run #1, B 0, k = 0 Trial R+ (m) R- (m) Trial R plus (m) R minus (m) 0.274 0.097 0.680 0.630 0.274...
- Page 36 SE-9654 Z eeman E ffect E xperiment Questions: Do the “Mean” values for the Bohr magneton, Bohr and B, from Table 2 and Table 3 agree with theory (9.27 x 10 T)? Discuss fully. The values are close. The k = 0 mean value is about 3% low and the k = 1 mean value is about 2% low. Based on the stan- dard deviation of the three runs, the precision is about 2.5% for the k = 1 values but less than 0.5% for the k = 0 values.
-
Page 37: Appendix C: Maintenance And Storage
Copyright Notice The PASCO scientific manual is copyrighted and all rights reserved. However, permission is granted to non-profit educational institutions for reproduction of any part of the providing the reproductions are used only for their laboratories and are not sold for profit.
Need help?
Do you have a question about the SE-9654 and is the answer not in the manual?
Questions and answers