Table of Contents
Advertisement
Quick Links
Franck-Hertz Experiment
Introduction
In 1914, in the course of their investigations, James Franck and
Gustav Hertz discovered an "energy loss in distinct steps for
electrons passing through mercury vapor", and a corresponding
emission at the ultraviolet line ( = 254 nm) of mercury. As it is
not possible to observe the light emission directly, demonstrating
this phenomenon requires an extensive and cumbersome
experiment apparatus. Performance of this experiment has
become one of the classic demonstrations of the quantization of
atomic energy levels. Franck and Hertz were awarded the Nobel
Prize for this work in 1925.
In this experiment, we will repeat Franck and Hertz's energy-loss
observations, using argon, and interpret the data in the context
of modern atomic physics. We will not attempt the spectroscopic
measurements, as the emissions are weak and in the extreme
ultraviolet portion of the spectrum.
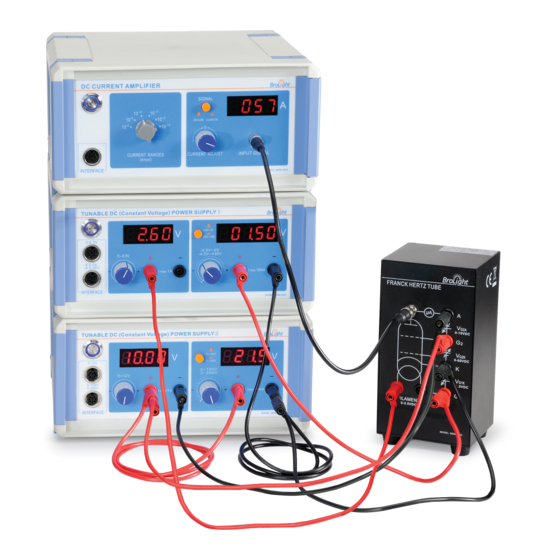
Equipment list
DC Current Amplifier (SE-6621)
Tunable DC (Constant Voltage) Power Supply I
(SE-6615)
Tunable DC (Constant Voltage) Power Supply II
(SE-9644)
Franck-Hertz Enclosure (SE-9660)
5× Connecting cable, 850 mm, red (EM-9740)
5× Connecting cable, 850 mm, black (EM-9745)
Not pictured:
Franck-Hertz Argon Tube (SE-9645A)
3× Power cord (not pictured)
BNC cable (not pictured)
2× 8-pin DIN Extension Cable (UI-5218; not pictured)
(SE-9639)
Recommended Items:
• 850 Universal Interface (UI-5000) or 550 Universal
Interface (UI-5001)
• PASCO Capstone data collection software
Principle of the experiment
Figure 1. Layout of a Franck-Hertz tube
the cathode (K), with a voltage of about 1.2 V between them. A
variable potential difference is applied between the cathode and
Grid 2 (G
) so that electrons emitted from the cathode can be
2
accelerated to a range of electron energies. The distance
between the cathode and the anode is large compared to the
mean free path length in the argon, in order to ensure a high
collision probability. On the other hand, the separation between
G
and the collector anode (A) is small.
2
A small constant negative potential U
potential") is applied between G
words, A is less positive than G
between G
and anode A opposes the motion of electrons to the
2
collector electrode, preventing electrons with kinetic energy less
than e•U
at Grid 2 from reaching anode A. As will be shown
G2A
later, this retarding voltage helps to differentiate the electrons
that experience inelastic collisions from electrons that do not.
A sensitive current amplifier is connected to the collector
electrode so that the current due to electrons reaching the
collector plate may be measured. As the accelerating voltage is
increased, the following is expected to happen: Up to a certain
voltage (which we will call V
as more electrons reach the plate. When the voltage V
reached, it is noted that the plate current I
is due to the fact that, at this voltage, the electrons have gained
just enough energy to collide inelastically with the argon atoms
before reaching the grid G
atoms, these electrons do not have sufficient energy to
overcome the retarding voltage between G
decrease in the plate current I
However, as the voltage is further increased, the electrons
continue to gain energy until they have enough to reach the
anode even after an inelastic collision with an argon atom. As
such, I
will increase again as more and more electrons arrive at
A
the plate. This continues until another specific voltage V
reached, at which point I
sharply decreases again. This second
A
drop indicates that the electrons have now obtained enough
Product Guide | 012-14264B
The Franck-Hertz tube
is an evacuated glass
cylinder containing
argon, with four
electrodes (collectively
called a "tetrode"). The
four electrodes consist
of: an indirectly heated
oxide-coated cathode
as an electron source
(cathode K); two grids,
G
and G
; and a plate,
1
2
A, which serves as an
electron collector
(anode A). Grid 1 (G
positive with respect to
(the "retarding
G2A
and collector plate A (in other
2
). The resulting electric field
2
), the plate current I
will increase
1
A
suddenly drops. This
A
. Having lost energy to the argon
2
and A, causing the
2
.
A
) is
1
is
1
is
2
1
Advertisement
Table of Contents

Related Manuals for PASCO SE-9639


Summary of Contents for PASCO SE-9639
- Page 1 Gustav Hertz discovered an "energy loss in distinct steps for electrons passing through mercury vapor", and a corresponding • PASCO Capstone data collection software emission at the ultraviolet line ( = 254 nm) of mercury. As it is not possible to observe the light emission directly, demonstrating...
-
Page 2: Safety Information
Franck-Hertz Experiment | SE-9639 energy to experience two inelastic collisions before reaching G • Do NOT disconnect the power cord safety ground feature. but not enough to overcome the retarding voltage afterwards. As • When plugging in the equipment, always plug it into a... -
Page 3: Setup And Maintenance
Product Guide | 012-14264B Equipment components "In" position of a bi-stable push control "Out" position of a bi-stable push control Tunable DC (Constant Voltage) Power Supply I Setup and maintenance WARNING: To reduce the risk of electric shock or damage to the instrument, turn off the power switch AND disconnect the power cord before installing or replacing the argon tube or fuse. - Page 4 Franck-Hertz Experiment | SE-9639 Data interface DANGER: High voltage is applied to the argon Use to connect the power supply to the analog channels of tube! Avoid contact with any part of the body, the 850 or 550 Universal Interface.
- Page 5 Product Guide | 012-14264B Experiment Procedure 1 Adjust Operating Voltages NOTE: Before switching on the power, be sure that all voltage controls are turned fully counterclockwise. 1. Connect all the cables and cords as shown in Connect cables and cords. 2.
- Page 6 Franck-Hertz Experiment | SE-9639 Table 1.2: Peak and Valley Voltage First Second Third Fourth Fifth Sixth Peak positions (×10 Valley positions (×10 Analysis 1. Plot the graphs of Current (y-axis) versus Voltage (x-axis). 2. Find the peak (or valley) positions which match the accelerating voltages. Label them as V , and V 3.
-
Page 7: Hardware Setup
Product Guide | 012-14264B Experiment Procedure 2 Using a PASCO interface and data acquisition software 850 Universal Interface (can be substituted with 550 Universal Interface) Analog Input A Analog Input B 8-pin DIN extension cable Power Supply II Power Supply I... -
Page 8: Software Setup
Software setup 1. Connect the Universal Interface to your computer if you have not already done so. 2. Start the PASCO Capstone software. The software should automatically recognize the Universal Interface and the devices connected to it. 3. Double-click the Graph icon in the Displays palette to create a Graph display. Click the <Select Measurement> boxes to plot Current on the y-axis and Voltage on the x-axis. -
Page 9: Recording Data
Product Guide | 012-14264B Recording Data 1. Make sure that the accelerating voltage V is zero. 2. After the filament has warmed up for about 15 minutes, click Record. 3. Over the course of the next two minutes, slowly increase the accelerating voltage. Do not exceed 100 V. CAUTION: While increasing the voltage, if you see the current suddenly increase, immediately return the voltage to zero and decrease the filament voltage slightly. - Page 10 Franck-Hertz Experiment | SE-9639 Teacher’s Notes Sample Data 1: Manual measurements Filament voltage (V) = 3.55 V = 1.5 V = 11.0 V Table 1: Accelerating Voltage and Tube Current (×10 (×10 (×10 (×10 (×10 (×10 1032 1174 1216 1101 (×10...
- Page 11 J•s) is given by: h = |(h - h ) / h | × 100% = 1.5% Sample Data 2: Using a PASCO interface Filament voltage (V) = 3.55 V = 1.5 V = 11.0 V Figure 4. Capstone Graph display containing a sample data set.
- Page 12 Franck-Hertz Experiment | SE-9639 Figure 5. Table data from the data set in Figure 4. Analysis: By taking the average of the mean differences for the peak and trough voltages, we obtain the value of an argon atom’s first excitation potential V = (11.23 + 11.64)/2 = 11.44 V...
-
Page 13: Software Help
Item Specifications PASCO and PASCO scientific are trademarks or registered trademarks of PASCO scientific, in the United States and in other countries. All other brands, products, or service names are or may be trademarks or service marks of, and are used to Tunable DC 0~6.3 V DC, I...
Need help?
Do you have a question about the SE-9639 and is the answer not in the manual?
Questions and answers