
Related Manuals for EXFO FTB-860 NetBlazer Series


Summary of Contents for EXFO FTB-860 NetBlazer Series
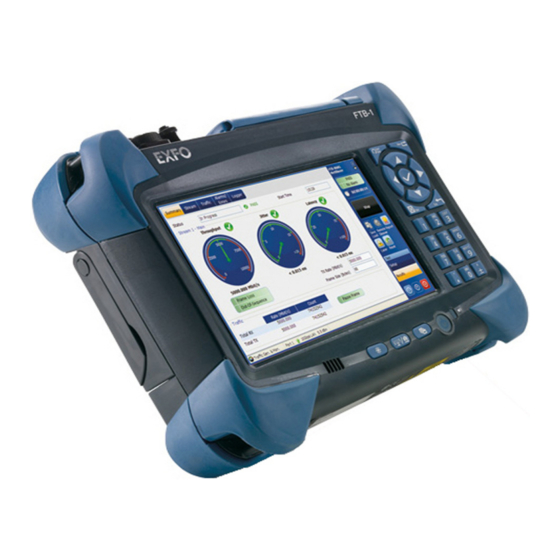
- Page 1 User Guide Ethernet/Packet Sync/FC/ Wireless Test Applications FTB-860/880 NetBlazer Series for FTB-1...
- Page 2 EXFO Inc. (EXFO). Information provided by EXFO is believed to be accurate and reliable. However, no responsibility is assumed by EXFO for its use nor for any infringements of patents or other rights of third parties that may result from its use.
-
Page 3: Table Of Contents
Contents Certification Information ..................... viii 1 Introducing the FTB-860/880 NetBlazer Series ..........1 Key Features and Benefits .......................1 Conventions ..........................3 2 Safety Information ..................5 Laser Safety Warnings ......................5 Installation Instructions Warnings ..................6 3 Getting Started .................... 7 Starting Module Application ....................7 4 Physical Interfaces and LEDs ............... - Page 4 7 RFC 2544 Test Setup and Results ...............73 Configuring an RFC 2544 Test ....................74 Global Configuration ......................77 Subtests Configuration ......................80 Summary Results ........................88 Graph ...........................96 8 EtherBERT Test Setup and Results ..............99 Configuring a EtherBERT Test ....................101 Global Configuration ......................102 Summary Results ........................106 9 Traffic Gen &...
- Page 5 14 Cable Test Setup and Results ..............171 Configuring Cable Test ......................172 Global Configuration ......................173 Summary Results ........................175 15 1588 PTP Test Setup and Results ............. 181 Configuring a 1588 PTP Test ....................182 1588 PTP ..........................184 Summary (1588 PTP) ......................190 PTP Stats ..........................194 Quality Level (1588 PTP) ....................196 16 SyncE Test Setup and Results ..............
- Page 6 22 Troubleshooting ..................357 Solving Common Problems ....................357 Contacting the Technical Support Group ................358 Transportation ........................358 23 Warranty ....................359 General Information ......................359 Liability ..........................360 Exclusions ...........................361 Certification ........................361 Service and Repairs ......................362 EXFO Service Centers Worldwide ..................363 A Specifications ....................365 FTB-860/880...
- Page 7 B Glossary ....................371 Acronym List ........................371 VLAN ..........................379 1588 PTP ..........................380 SyncE ..........................385 NetBlazer...
-
Page 8: Certification Information
Electronic test and measurement equipment is exempt from FCC part 15, subpart B compliance in the United States of America and from ICES-003 compliance in Canada. However, EXFO Inc. makes reasonable efforts to ensure compliance to the applicable standards. The limits set by these standards are designed to provide reasonable protection against harmful interference when the equipment is operated in a commercial environment. - Page 9 Certification Information Laser Your product is a Class 1 laser product in compliance with standards IEC 60825-1 and 21 CFR 1040.10. European Union (CE) Information Please refer to the CE Declaration of Conformity on page x. Note: If the equipment described herein bears the CE symbol, the said equipment complies with the applicable European Union Directive and Standards mentioned in the Declaration of Conformity.
- Page 10 Tel.: +44 2380 246810 Equipment Type/Environment: Test & Measurement / Basic Trade Name/Model No.: Ethernet Testers / FTB-860 NetBlazer Series Standard(s) to which Conformity is declared: Safety requirements for electrical equipment for measurement, EN 61010-1:2001 Edition 2.0 control, and laboratory use – Part 1: General requirements Electrical equipment for measurement, control and laboratory use –...
- Page 11 1999/5/EC The R&TTE Directive 2011/65/UE Restriction of the use of certain hazardous substances (RoHS) And their amendments Manufacturer’s Name and Address: EXFO Inc. EXFO Europe 400 Godin Avenue Omega Enterprise Park, Electron Way Quebec City, Quebec Chandlers Ford, Hampshire G1M 2K2 CANADA SO53 4SE ENGLAND Tel.: +1 418 683-0211...
-
Page 13: Introducing The Ftb-860/880 Netblazer Series
touchscreen/keypad navigation and data entry. Increase technician autonomy and productivity with intelligent discovery of remote EXFO Ethernet testers, as well as in-service testing via dual-port Through mode. Eliminate errors in data interpretation with revolutionary new GUI on ... - Page 14 Introducing the FTB-860/880 NetBlazer Series Key Features and Benefits Extend field testing operations with a compact, lightweight platform equipped with a long-duration battery pack. EXFO Connect-compatible: automated asset management; data goes through the cloud and into a dynamic database. FTB-860/880...
-
Page 15: Conventions
Introducing the FTB-860/880 NetBlazer Series Conventions Conventions Before using the product described in this guide, you should understand the following conventions: ARNING Indicates a potentially hazardous situation which, if not avoided, could result in death or serious injury. Do not proceed unless you understand and meet the required conditions. -
Page 17: Safety Information
Safety Information Laser Safety Warnings ARNING Do not install or terminate fibers while a light source is active. Never look directly into a live fiber and ensure that your eyes are protected at all times. ARNING The use of controls, adjustments and procedures other than those specified herein may result in exposure to hazardous situations or impair the protection provided by this unit. -
Page 18: Installation Instructions Warnings
Safety Information Installation Instructions Warnings ARNING When the LASER LED is on, the FTB-860/880 NetBlazer Series is receiving/emitting an optical signal. Installation Instructions Warnings AUTION No user serviceable parts are contained inside. Contact the manufacturer regarding service of this equipment. MPORTANT All wiring and installation must be in accordance with local building and electrical codes acceptable to the authorities in the countries... -
Page 19: Getting Started
Getting Started If the NetBlazer has been purchased at the same time as the FTB-1, the NetBlazer Application module is pre-installed with the appropriate Mini ToolBox software version. If the NetBlazer is not already installed, refer to the FTB-1 User Guide for more information on how to install the module. Starting Module Application The module can be configured and controlled by starting the NetBlazer application. -
Page 21: Physical Interfaces And Leds
Physical Interfaces and LEDs This section describes the connectors (ports) and LEDs available on each module. Modules FTB-860 Module Electrical 10/100/1000 Mbit/s, optical 100/1000 Mbit/s Ethernet testing, CPRI/OBSAI 2.4576/3.072 Gbit/s optical testing, and Fibre Channel 1X/2X/4X. The FTB-860 also offers UTP cable testing. Ethernet 100/1000 Mbit/s, CPRI/OBSAI 2.4576/3.072 Gbit/s and Ethernet 10/100/1000 Mbit/s... - Page 22 Physical Interfaces and LEDs Modules FTB-860G Module Electrical 10/100/1000 Mbit/s, optical 100/1000 Mbit/s, optical 10 Gbit/s Ethernet testing, CPRI/OBSAI 2.4576/3.072 Gbit/s optical testing, and Fibre Channel 1X/2X/4X/8X/10X. The FTB-860G also offers UTP cable testing. Ethernet 100/1000 Mbit/s, CPRI/OBSAI 2.4576/3.072 Gbit/s, Ethernet 10 Gbit/s and and Fibre Channel 1X/2X/4X Ethernet 10/100/1000 Mbit/s...
- Page 23 Physical Interfaces and LEDs Modules FTB-880 Module Electrical 10/100/1000 Mbit/s, optical 100/1000 Mbit/s, optical 10 Gbit/s, Ethernet testing, CPRI/OBSAI 2.4576/3.072 Gbit/s optical testing, Fibre Channel 1X/2X/4X/8X/10X. The FTB-880 also offers UTP cable testing. SONET/SDH and DSn/PDH testing up to 10 Gbit/s are also available; refer to the “Transport Test Application”...
-
Page 24: Port Availability On Ftb-860/880 Netblazer Series Module
Physical Interfaces and LEDs Port Availability on FTB-860/880 NetBlazer Series Module Port Availability on FTB-860/880 NetBlazer Series Module The following table shows the list of available ports as well as a description and signals supported for each module. For FTB-880, refer to the “Transport Test Application”... -
Page 25: Ethernet 10/100/1000 Mbit/S Electrical Port
Physical Interfaces and LEDs Ethernet 10/100/1000 Mbit/s Electrical Port Ethernet 10/100/1000 Mbit/s Electrical Port The NetBlazer module provides one (FTB-860GL) or two electrical ports (Port#1 and Port#2) for 10Base-T, 100Base-TX, or 1000Base-T. These ports may also be used for cable testing. The electrical ports are RJ-45 for category 5 unshielded twisted pair (UTP). -
Page 26: Ethernet 100/1000 Mbit/S And Fc 1X/2X/4X Optical Port
The optical ports are Small Form Factor Pluggable (SFP) slot type (Duplex or Simplex LC connector). Insert one of the following SFP modules into the optical slot. EXFO Part Description Number FTB-85911 100Base-LX10, 1310 nm, SM, 15 Km FTB-85910 100Base-FX, 1310 nm, MM, 2 Km... - Page 27 Physical Interfaces and LEDs Ethernet 100/1000 Mbit/s and FC 1X/2X/4X Optical Port Carefully connect optical fiber cables to the SFP’s IN and OUT ports. To ensure good signal quality, make sure that the optical fiber connector is fully inserted into the optical connector port. LEDs Status Description...
-
Page 28: Cpri/Obsai 2.0457/3.072 Gbit/S Optical Port
The optical port is Small Form Factor Pluggable (SFP) slot type (Duplex LC connector). Insert one of the following SFP modules into the optical slot EXFO Part Description Number FTB-8590 GigE/FC/2FC, PRI/OBSAI 2.45/3.07 Gbit/s, 850 nm, <500 m FTB-8190 155/622 Mbit/s, 2.5/2.7 Gbit/s, GigE/FC/2FC, CPRI/OBSAI 2.45/3.07 Gbit/s, 1310 nm, 15 km... -
Page 29: Ethernet 10 Gbit/S And Fc 8X/10X Optical Port
10Gbit/s LAN/WAN Ethernet or 8X/10X Fibre Channel BERT testing. The optical port is Small Form Factor Pluggable (SFP+) slot type. Insert one of the following SFP+ modules into the optical slot. EXFO Part Description Number FTB-8690 SFP+ module 10 GigE at 850 nm, MM, 300 m... -
Page 31: Using The Graphical User Interface
Using the Graphical User Interface This chapter describes the NetBlazer graphical user interface for the Ethernet and Fibre Channel Tests. Main Application Window The following main application window is displayed when the NetBlazer application is started. FTB-860 Series (FTB-860G) Title Bar Global Indicator Main... - Page 32 Using the Graphical User Interface Main Application Window Main Window The main window allows to setup a test and to view test status and results. The NetBlazer provides the following test applications. Note: Navigation buttons appear when there is not enough room on one page to display all available test applications.
- Page 33 Using the Graphical User Interface Main Application Window Traffic Gen & Mon: Traffic Gen & Mon test is to qualify the performance of Ethernet or IP network. The Traffic Gen & Mon test can be used to confirm the Service Level Agreements between service providers and the customers.
- Page 34 Using the Graphical User Interface Main Application Window Fibre Channel FC BERT: The Fibre Channel Test runs the BERT test over a configured Fibre Channel Interface. The test measures the data traffic for the local and remote ports. Refer to FC BERT Test Setup and Results on page 213.
- Page 35 Using the Graphical User Interface Main Application Window Status Bar Lpbk Tool Lpbk Tool Information Speed PTP Status ESMC Status Test Port LINK Status Remote Connection Optical Power Laser The status bar displays the following from left to right: Ethernet, Packet Sync, Fibre Channel, and Wireless Test Applications: ...
- Page 36 Using the Graphical User Interface Main Application Window Laser indicates that the laser control is ON per port. The laser icon is not displayed when the laser is off. The laser icon is only displayed for optical interfaces. Remote Connection indicates that a connection is established with ...
- Page 37 Using the Graphical User Interface Main Application Window Global Indicator The global indicator displays the pass/fail verdict, global alarm, and the test duration. Global Global Verdict indicator area Current Global Alarm History Test Timer The global indicators can be maximized for distant view. Press anywhere within the global indicator area to view the maximized view of these indicators.
- Page 38 Using the Graphical User Interface Main Application Window Global Alarm: Reports current and history states of the global test alarm/error status. Background Alarm/ Text Description color Error displayed Gray Current No test result available. History Green Current No alarm/error has occurred in No Alarm the last second.
- Page 39 Using the Graphical User Interface Main Application Window Test Control The following test control buttons are available: Button For more information, refer to: Start/Stop Start/Stop Button on page 15 Save/Load Button on page 16 Save/Load Discover Remote Discover Remote Button on page 251 Phone Book Button on page 25 Phone Book Reports...
- Page 40 Using the Graphical User Interface Main Application Window Results allows to view respective test results. For Ethernet, refer to EtherSAM Test Setup and Results on page 35, RFC 2544 Test Setup and Results on page 73, EtherBERT Test Setup and Results on page 99, Traffic Gen &...
- Page 41 Using the Graphical User Interface Main Application Window Application Buttons Help About Exit Help button The help button displays the help information related to the content of the active main window. It is also possible to navigate through the remainder of the help information.
- Page 42 Using the Graphical User Interface Main Application Window Following is the list of available software options: Options Description 100optical Enable support for 100 Mbit/s optical interfaces. GigE _Optical Enable support for 1000Base-T and GigE optical interfaces. GigE_ Electrical Enable support for Ethernet 1000Base-T electrical Interfaces.
-
Page 43: Arrow Buttons
Using the Graphical User Interface Arrow Buttons Options Description 3RD-PARTY_LOOPBACK Enables a Smart Loopback test with a third-party device. CPRI Enables CPRI test. OBSAI Enables OBSAI test. 2ND-PORT_SL Second Port Smart Loopback Tool. Exit Button: The Exit button is used to close the application. ... -
Page 44: Keyboard Usage
Using the Graphical User Interface Keyboard Usage Keyboard Usage The GUI pops up different keyboards to modify data. Following are the usual keyboard keys: Left arrow: Moves the cursor one position to the left. Right arrow: Moves the cursor one position to the right. ... - Page 45 Using the Graphical User Interface Keyboard Usage For full keyboard, the Back, Del, Shift, and Space bar keys have the same functionality as a regular PC keyboard. The Trace message keyboard (WAN) allows entering alphanumerical characters (ITU T.50) required for J0/J1 Trace fields. Press the Control Characters button to access these characters.
- Page 46 Using the Graphical User Interface Keyboard Usage ITU T.50 Characters b7 to b1 Character Description b7 to b1 Character Description 000 0000 NUL Null 001 0000 DLE Data Link Escape 000 0001 SOH Start Of Heading 001 0001 DC1 Device Control 1 000 0010 STX Start of Text 001 0010 DC2...
-
Page 47: Ethersam Test Setup And Results
EtherSAM Test Setup and Results Y.1564 is the newly introduced draft standard for turning-up and troubleshooting carrier Ethernet services. This new methodology is completely adapted to today's Ethernet services especially mobile backhaul and commercial services. Contrary to other methodologies, EtherSAM supports new multiservice offerings. - Page 48 EtherSAM Test Setup and Results Submenu Page Results Summary Service Configuration Test Service Performance Test - Key Performance Indicators 63 Service Performance Test - F.Loss/OOSeq Traffic - Statistics Alarm/Errors - Ethernet/Fibre Channel Alarm/Errors - WIS WIS Traces/Label MPLS Result - EtherSAM/Traffic Gen & Mon Logger FTB-860/880...
-
Page 49: Configuring An Ethersam Test
EtherSAM Test Setup and Results Configuring an EtherSAM Test Configuring an EtherSAM Test To configure the EtherSAM test: 1. From the Test menu, press Setup. 2. From the Test Applications tab, under Ethernet group, press EtherSAM. 3. From the Interface tab, configure the Port, Network settings, and view the information on the SFP/SFP+ page. - Page 50 EtherSAM Test Setup and Results Configuring an EtherSAM Test 10. Press Start to start the test. Summary result page will be automatically displayed. See Summary Results on page 55. Note: At least one of the EtherSAM test procedures (Service Configuration Test or Service Performance Test) has to be enabled to start the test.
- Page 51 EtherSAM Test Setup and Results Configuring an EtherSAM Test To configure the EtherSAM Dual Test Set (DTS) test: 1. From the Test menu, press Setup. 2. From the Test Applications tab, press EtherSAM. 3. From the Interface tab, configure the Port, Network settings, and view the information on the SFP/SFP+ page.
- Page 52 EtherSAM Test Setup and Results Configuring an EtherSAM Test 12. Press Start to start the test. Summary result page will be automatically displayed. See Summary Results on page 55. Note: At least one of the EtherSAM test procedures (Service Configuration Test or Service Performance Test) has to be enabled to start the test.
-
Page 53: Global Configuration
EtherSAM Test Setup and Results Global Configuration Global Configuration From the Test menu, press Setup, and the Global tab. Dual Test Set Dual Test Set (DTS): Enable or disable Dual Test Set. By default, Dual Test Set is disabled. If enabled, set the Mode for the Dual Test Set. - Page 54 EtherSAM Test Setup and Results Global Configuration Subtests Service Configuration Test: The objective of this test is to verify if the network configuration is correct for each service before starting a long term test (Service Performance Test). In order to test the network configuration, a ramp will be generated for each configured service.
- Page 55 EtherSAM Test Setup and Results Global Configuration Global Options Note: The Per direction configuration is only available with DTS on the Local module. Per direction configuration: When Per direction configuration is enabled, the configuration values are not coupled, that is, the values can be configured independently for each direction (local to remote and remote to local).
-
Page 56: Configuring Services
EtherSAM Test Setup and Results Configuring Services Configuring Services You can configure the services 1 to 10 from this tab. Note: Services page is not available when the Dual Test Set parameter is set to Remote in Global Configuration on page 41. From the Test menu, press Setup, and the Services tab. - Page 57 EtherSAM Test Setup and Results Service Profile Configuration Copy Service The Copy Service allows to copy the configuration of a service to one or several services. To copy the service settings, press the Copy Service button. To copy the service configuration to one or several services: 1.
- Page 58 EtherSAM Test Setup and Results Service Profile Configuration Framing: Select the frame structure of the service. The choices are Ethernet, Ethernet/IPv4/UDP, and Ethernet/MPLS/IPv4/UDP . By default, Ethernet is selected. The Framing settings depends on the interface settings, for more details, see Interface - Network on page 285.
- Page 59 EtherSAM Test Setup and Results Service Profile Configuration For Fixed type, select the frame size. The size is configurable for Data service profile. The accepted range is from 64 to 10000 bytes. The default value will be equal to the minimum frame size. The following table lists each component that may affect the minimum size value.
- Page 60 EtherSAM Test Setup and Results Service Profile Configuration Profile The Profile Indicates and allows to change the selected emulation profile: Voice ( ), Video ( ), or Data ( ) service. The default setting is Data. When the profile parameter is set to Data, the Framing, Frame Size, and CIR shall be configurable.
- Page 61 EtherSAM Test Setup and Results Service Profile Configuration For Video: Video Codec choices are SDTV (MPEG-2), HDTV (MPEG-2), and HDTV (MPEG-4). Only SDTV (MPEG-2) is available with the 10 Mbps interface. The default setting is SDTV (MPEG-2). Number of Channels allows the selection of the equivalent ...
- Page 62 EtherSAM Test Setup and Results Service Profile Configuration SLA/Transmit The SLA (Service-Level Agreement) parameters allows defining the pass/fail verdict thresholds for the service. Use the EIR, Max Jitter, Max Latency, and Frame Loss check boxes to enable the pass/fail verdict for these parameters.
- Page 63 EtherSAM Test Setup and Results Service Profile Configuration Overshoot allows to stress the rate limiting of the network by sending traffic at higher rate than committed by the SLA. Note: The CIR, EIR, and Overshoot values must comply to the following rule: CIR ...
-
Page 64: Ramp Configuration
EtherSAM Test Setup and Results Ramp Configuration Ramp Configuration You can ramp a service into multiple steps to reach and exceed the Committed Information Rate using Ramp tab. The ramp defined in this tab is used in the Service Configuration Test. The ramp parameters are common to all Services, in both directions. - Page 65 EtherSAM Test Setup and Results Ramp Configuration Dynamic Ramp The graphic displays the percentage of each CIR level step in time. Step Time The step time represents the test duration for each ramp step (from 5 to 60 seconds). Ramp Duration The ramp duration indicates the total time required to perform all the ramp steps for each service.
- Page 66 EtherSAM Test Setup and Results Ramp Configuration Delete Step The Delete Step button allows you to delete a selected step from the ramp. To delete the step, press Delete Step button. The Delete Step window is displayed, select the ramp to be deleted and press Delete.
-
Page 67: Summary Results
EtherSAM Test Setup and Results Summary Results Summary Results When the EtherSAM test is run, a summary of the results as well as the detailed results per subtest is collected. The Summary results page displays the progress of each subtest. The progress per subtest is monitored and updated on a per second basis. - Page 68 EtherSAM Test Setup and Results Summary Results The Summary page displays the following results. The Service Configuration Test and the Service Performance Test field displays the current status of the respective tests. The verdict is displayed only, if it is enabled. To set the Pass/Fail verdict, see Pass/Fail Verdict on the Global Configuration on page 41.
- Page 69 EtherSAM Test Setup and Results Summary Results Aborted – No remote connection Aborted – Loss of remote connection: This status will appear only when the Dual Test Set Connection is lost during the DTS EtherSAM test. Start Time: The time when the EtherSAM test was started. ...
- Page 70 EtherSAM Test Setup and Results Summary Results Note: When the Dual Test Set mode is set to Local on page 41, the results are presented independently for each direction: Local-to-Remote (L->R) and Remote-to-Local (R->L). Note: For DTS EtherSAM, the results for the Local-to-Remote direction are obtained between test iterations.
-
Page 71: Service Configuration Test Results
EtherSAM Test Setup and Results Service Configuration Test Results Service Configuration Test Results Displays the service configuration test results in detail. From the Test menu, press Results, and the Service Configuration Test tab. Select the services from to 10 to view the service configuration test result. Service name The Service name indicates the name of the selected service. - Page 72 EtherSAM Test Setup and Results Service Configuration Test Results TX rate (Mbit/s): Indicates the transmission rate for each step. Note: All SLA parameters are related to specified step in the Step column. SLA Verified Max Jitter (ms): indicates the maximum measured delay ...
- Page 73 EtherSAM Test Setup and Results Service Configuration Test Results Informational Note: The Informational parameters are for information purpose only, that is, they are not included in the test verdict. Max Jitter (ms): indicates the maximum measured delay variation. % Frame Loss: It specifies the percentage of the frame loss value.
- Page 74 EtherSAM Test Setup and Results Service Configuration Test Results Note: When the Dual Test Set mode is set to Local on page 41, the results are presented independently for each direction: Local-to-Remote (L->R) and Remote-to-Local (R->L). For DTS EtherSAM, the results for the Remote-to-Local direction are obtained between test iterations.
-
Page 75: Service Performance Test Results
EtherSAM Test Setup and Results Service Performance Test Results Service Performance Test Results Displays the service performance test results in detail. From the Test menu, press Results, and the Service Performance Test tab. NetBlazer... -
Page 76: Key Performance Indicators
EtherSAM Test Setup and Results Key Performance Indicators Key Performance Indicators From the Test menu, press Results, and the Service Performance Test tab. By default, Key Performance Indicators tab is selected. Select service from 1 to 10 for which you want to view the service performance test result. - Page 77 EtherSAM Test Setup and Results Key Performance Indicators SLA Parameters CIR: The CIR (Committed Information Rate) allows to set the service rate guaranteed by the SLA. Max Jitter (ms): indicates the maximum measured delay variation. Max Latency (ms): ms) indicates the maximum measured round trip ...
- Page 78 EtherSAM Test Setup and Results Key Performance Indicators Latency (ms): The latency (delay) is measured for each stream on all valid frames. The maximum, minimum, current, and average delay values are reported. The pass or fail verdict is also displayed for the maximum latency.
-
Page 79: Frame Loss / Out Of Sequence (F.loss/Ooseq)
EtherSAM Test Setup and Results Frame Loss / Out of Sequence (F.Loss/OOSeq) Frame Loss / Out of Sequence (F.Loss/OOSeq) From the Test menu, press Results, Service Performance Test, and the F.Loss/OOSeq tab. Select service from 1 to 10 for which you want to view the service performance test result. - Page 80 EtherSAM Test Setup and Results Frame Loss / Out of Sequence (F.Loss/OOSeq) RX Frame Count The RX Frame Count indicates the number of frame received matching the selected service ID. CIR (Mbit/s): The CIR (Committed Information Rate) is the average rate of the service frames up to which the network delivers service frames and meets the performance objectives defined by the CoS Service Attribute.
- Page 81 EtherSAM Test Setup and Results Frame Loss / Out of Sequence (F.Loss/OOSeq) Out of Sequence Out of sequence is declared when a valid packet has its sequence number smaller than the previously received packet. Seconds, count, rate, and percentage values are reported. The Out of Sequence will not be considered in the global verdict.
-
Page 82: Traffic - Statistics Results
EtherSAM Test Setup and Results Traffic - Statistics Results Traffic - Statistics Results From the Test menu, press Results, Traffic, and the Statistics tab. Frame Type: Displays the TX Count and RX Count of the number of frames transmitted and received. Multicast: The number of Multicast frames transmitted/received ... - Page 83 EtherSAM Test Setup and Results Traffic - Statistics Results Frame Size: Displays the Frame Size, RX Count, and %. Total number of frames received with an Frame size Ethernet frame size <64 Smaller than 64 bytes. Of 64 bytes. 65-127 Greater than 64 bytes but smaller than 128 bytes.
-
Page 85: Rfc 2544 Test Setup And Results
RFC 2544 Test Setup and Results The FTB-860/880 NetBlazer Series allows performance testing as per RFC 2544, including Throughput, Back-to-Back, Frame Loss, and Latency subtests. The RFC 2544 test has to be executed in conjunction with a remote module. The remote module can be either in loopback configuration for unidirectional testing or in the Dual Test Set RFC 2544 mode for bidirectional testing. -
Page 86: Configuring An Rfc 2544 Test
RFC 2544 Test Setup and Results Configuring an RFC 2544 Test Configuring an RFC 2544 Test To configure the RFC 2544 test: 1. From the Test menu, press Setup. 2. From the Test Applications tab, under Ethernet group, press RFC 2544. 3. - Page 87 RFC 2544 Test Setup and Results Configuring an RFC 2544 Test Note: At least one of the RFC 2544 test procedures (Throughput, Back-to-Back, Frame Loss, or Latency) has to be enabled to start the test. Test procedures, those that are enabled will be performed following this order: Throughput, Back-to-Back, Frame Loss, and Latency.
- Page 88 RFC 2544 Test Setup and Results Configuring an RFC 2544 Test 10. For additional results, refer to Graph on page 96, Alarms/Errors - Ethernet/Fibre Channel on page 329, and WIS Traces/Label on page 343. 11. Press Start to start the test. Summary result page will be automatically displayed.
-
Page 89: Global Configuration
RFC 2544 Test Setup and Results Global Configuration Global Configuration From the Test menu, press Setup, and the Global tab. Dual Test Set Dual Test Set (DTS): Enable or disable Dual Test Set. By default, Dual Test Set is disabled. If enabled, set the Mode for the Dual Test Set. - Page 90 RFC 2544 Test Setup and Results Global Configuration Subtests Throughput Back-to-Back Frame Loss Latency Global Options Pass /Fail Verdict: Enable or disable the Pass/Fail Verdict. The default setting is Enabled. If enabled, the Pass/Fail verdict is displayed in the result pages and in the side panel.
- Page 91 RFC 2544 Test Setup and Results Global Configuration Frame Distribution Frame Distribution: Select the Frame Distribution. Choices are RFC 2544 and User Defined. By default, RFC 2544 is selected. Nb. of Frames is only available when User Defined is selected. ...
-
Page 92: Subtests Configuration
RFC 2544 Test Setup and Results Subtests Configuration Subtests Configuration You can configure the Throughput, Back-to-Back, Frame Loss and Latency test parameters from this tab. Note: Subtests page is not available when the Dual Test Set parameter is set to Remote in Global Configuration on page 77. - Page 93 RFC 2544 Test Setup and Results Subtests Configuration Throughput Configuration The objective of this test is to find the throughput of the device under test for which there is no frame loss. Starting at the specified maximum rate (Max. Rate), the rate converges towards the highest throughput without frame loss with the test having a predefined duration (Test Time).
- Page 94 RFC 2544 Test Setup and Results Subtests Configuration Nb. of Validations: Select the number of times the result should be validated. Choices are 1 to 50 times. The default setting is 1 time. Max. Rate: Select the Maximum Rate so that the throughput test should ...
- Page 95 RFC 2544 Test Setup and Results Subtests Configuration Threshold: Select the threshold value in percentage of the line rate (%), Mbit/s, or in Gbit/s. If the determined throughput value is greater or equal to the threshold value, the test is declared as PASS. If the determined throughput value for a specific frame size is lower than the threshold value, the test is declared as FAIL.
- Page 96 RFC 2544 Test Setup and Results Subtests Configuration Back-to-Back Configuration The objective of this test is to find the maximum number of frames that can be sent at maximum throughput without frame loss. A burst of frames (Max. Burst Duration) is sent with minimum inter-frame gaps to the device under test and the number of forwarded frames is counted.
- Page 97 RFC 2544 Test Setup and Results Subtests Configuration Frame Loss Configuration The objective of this test is to find the percentage of frames that are lost due to lack of resources. Starting at the specified maximum rate (Max. Rate), the test is performed for a specific frame size and for the specified duration (Test Time).
- Page 98 RFC 2544 Test Setup and Results Subtests Configuration Latency Configuration The objective of the test is to measure the time required for the frame to go through the device under test and return back to source. Starting by sending a stream of frames for the predefined duration (Test Time) and throughput (Max.
- Page 99 RFC 2544 Test Setup and Results Subtests Configuration Copy From Throughput: Enable to get values from the Throughput subtest results. This setting is enabled by default. When the Copy From Throughput parameter is enabled, the Throughput subtest results max rate value will be used as the Max.
-
Page 100: Summary Results
RFC 2544 Test Setup and Results Summary Results Summary Results When the RFC 2544 test is run, a summary of the results as well as the detailed results per subtest is collected. The Summary results page displays the progress of each subtest. The progress per subtest is monitored and updated on a per second basis. - Page 101 RFC 2544 Test Setup and Results Summary Results The Summary page displays the following results. The progress Status of each subtest is indicated as follows: “--” (test has not started) In Progress Completed Aborted Aborted – No remote connection ...
- Page 102 RFC 2544 Test Setup and Results Summary Results Trial #: Available for Back-to-Back, and Latency subtests. This value indicates the number of phases. Step#: Available for Frame Loss subtest. The value indicates the amount of throughput decrease in steps of 10 %. TX Frames: Available only for Throughput, Frame Loss and ...
- Page 103 RFC 2544 Test Setup and Results Summary Results RX Frames: The count of received frames for the iteration in progress after the test frames have been transmitted and a pause of 2 seconds has passed. This value is kept throughout the iteration until the next iteration begins.
- Page 104 RFC 2544 Test Setup and Results Summary Results Back-to-Back Results In: The back-to-back value is expressed in Mbit/s by default. The default is Gbit/s for 10G interface. The user can also specify the values to be displayed as a percentage (%) of the maximum number of frames in a burst as specified by the burst duration or in Frames per Burst (f/burst), and Gbit/s for 10G interface.
- Page 105 RFC 2544 Test Setup and Results Summary Results Frame Loss Results In: The frame loss value is expressed in percentage (%). Step: Determines which step is displayed. The Frame Loss results displayed on the bottom half of the page are displayed for the selected frame size distribution.
- Page 106 RFC 2544 Test Setup and Results Summary Results The latency results displayed on the bottom half of the page are displayed for the selected frame size distribution. Note: When the Dual Test Set mode is set to Local on page 77, the results are presented independently for each direction: Local-to-Remote (L->R) and Remote-to-Local (R->L).
- Page 107 RFC 2544 Test Setup and Results Summary Results The Subtests status reflects the test phase as follows: Initializing Learning Testing Waiting Not measurable Test completed Aborted Aborted – No remote connection Aborted – Invalid configuration ...
-
Page 108: Graph
RFC 2544 Test Setup and Results Graph Graph Gives the graph showing the Throughput, Back-to-Back, Frame Loss, and Maximum Latency measurements. From the Test menu, press Results, and the Graph tab. The X axis shows the frame sizes for Throughput, Back-to-Back, Latency and Frame Loss. - Page 109 RFC 2544 Test Setup and Results Graph The Graph result page displays the following results. Select any subtest to view the enlarged graph of that subtest. Choices are: All, Throughput, Back-to-Back, Frame Loss, and Latency. Note: By selecting All, you can view the graphs of all the four subtests. For Frame Loss subtest, select the Step parameter to display the result ...
-
Page 111: Etherbert Test Setup And Results
EtherBERT Test Setup and Results The Ether Bit Error Rate Test (BERT) measures the level of transmission impairment on a communication channel. Specific test patterns are sent through Ethernet frames and then analyzed to detect data integrity problem (bit error). The EtherBERT test case offers several options: Traffic configuration: ... - Page 112 EtherBERT Test Setup and Results Unidirectional EtherBERT testing is performed whereby the test stream is transmitted from the local module to a remote device in loopback, and the test stream is received back and locally analyzed. The results are reported at the local end.
-
Page 113: Configuring A Etherbert Test
EtherBERT Test Setup and Results Configuring a EtherBERT Test Configuring a EtherBERT Test To configure the EtherBERT test: 1. From the Test menu, press Setup. 2. From the Test Applications tab, under Ethernet group, press EtherBERT. 3. From the Interface tab, configure the Port, Network settings, and view the information on the SFP/SFP+ page. -
Page 114: Global Configuration
EtherBERT Test Setup and Results Global Configuration Global Configuration From the Test menu, press Setup, and the Global tab. Note: Service Disruption Time feature is always active. Framing Framing: Select Ethernet, Ethernet/IPv4/UDP , or Ethernet/IPv6/UDP . The default value is Ethernet. For more details, See Interface on page 280. - Page 115 EtherBERT Test Setup and Results Global Configuration If Ethernet/IPv6/UDP framing is selected, the minimum frame size is according to the number of VLAN layers: No VLAN = 84 bytes One VLAN = 88 bytes Two VLAN = 92 bytes ...
- Page 116 EtherBERT Test Setup and Results Global Configuration Service Disruption No Traffic Time: The No Traffic Time configuration allows you to configure the time between two Ethernet Frames that is acceptable without raising an alarm. It also describes when a Service Disruption event occurs.
- Page 117 EtherBERT Test Setup and Results Global Configuration If the Pass/Fail Verdict is Bit Error Count & SDT, the accepted BER threshold range is 0 to 999999 with default value of 0. The BER Threshold indicates the number of accepted errors before failing the Test.
-
Page 118: Summary Results
EtherBERT Test Setup and Results Summary Results Summary Results The Summary Results page allows you to not only view the status of the test, but to also change certain parameters dynamically as the test is running, such as injecting errors, changing the transmission rate, and thresholds. - Page 119 EtherBERT Test Setup and Results Summary Results Start Time Start Time: The time when the EtherBERT test was started. Pattern Pattern Loss: Alarm is raised when the bit error rate is above 0.2. No Traffic: Alarm is raised when there is no traffic for a period ...
- Page 120 EtherBERT Test Setup and Results Summary Results BER Threshold: Enter the threshold amount as follows (if the bit error results exceed this value, the test will be declared as failed): If the Pass/Fail Verdict is Bit Error Count & SDT, the accepted ...
- Page 121 EtherBERT Test Setup and Results Summary Results Service Disruption Time The Service Disruption results allows you to view the results and change the SDT Threshold parameter dynamically as the test is running. Service Disruption Time: Longest (ms): Displays the longest service disruption time ...
-
Page 123: Traffic Gen & Mon Test Setup And Results
Traffic Gen & Mon Test Setup and Results The main goal of Traffic Gen & Mon test is to qualify the performance of Ethernet or IP network. The Traffic Gen & Mon test can be used to confirm the Service Level Agreements between service providers and the customers. - Page 124 Traffic Gen & Mon Test Setup and Results The Traffic Gen & Mon test offers the following structure: SubMenu Page Setup Global Stream - Stream Profile Stream - QoS Metrics Stream - MAC/IP/UDP Stream - VLAN Stream - MPLS Results Summary Stream - Throughput Stream - QoS Metrics...
-
Page 125: Configuring A Traffic Gen & Mon Test
Traffic Gen & Mon Test Setup and Results Configuring a Traffic Gen & Mon Test Configuring a Traffic Gen & Mon Test To configure the Traffic Gen & Mon Test: 1. From the Test menu, press Setup. 2. From the Test Applications tab, under Ethernet group, press Traffic Gen &... - Page 126 Traffic Gen & Mon Test Setup and Results Configuring a Traffic Gen & Mon Test 8. For additional results, refer to Stream - Throughput Results on page 130, Alarms/Errors - Ethernet/Fibre Channel on page 329, WIS Traces/Label on page 343, and Logger on page 347. 9.
-
Page 127: Global Configuration
Traffic Gen & Mon Test Setup and Results Global Configuration Global Configuration The Global page allows configuring the global Test Timer parameters. From the Test menu, press Setup, and the Global tab. Test Timer Duration: Set the duration of the test. Choices are 15-Min, 1-Hour, ... -
Page 128: Streams Configuration
Traffic Gen & Mon Test Setup and Results Streams Configuration Streams Configuration The Streams page allows configuring the 1 -Main stream and streams 2 to 10. From the Test menu, press Setup, and the Streams tab. From the Streams tab, you can configure Stream Profile, QoS Metrics (only for 1- Main stream), MAC/IP/UDP , and VLAN. - Page 129 Traffic Gen & Mon Test Setup and Results Streams Configuration For streams 2 to 10, press any of the streams number. Profile Profile is available only for 1- Main stream. Here you can set the profile parameter, and selection of Profile depend on the activation of Jitter. For more details, see Jitter on page 123.
- Page 130 Traffic Gen & Mon Test Setup and Results Streams Configuration The following pre-defined profiles are available when frame structure Ethernet/IPv4/UDP or Ethernet/IPv6/UDP is selected. Jitter pre-defined profile Supporting speed VoIP G.711 10/100/1000 Mbit/s VoIP G.723.1 10/100/1000 Mbit/s VoIP G.729 10/100/1000 Mbit/s IPTV SDTV (MPEG-2) 10/100/1000 Mbit/s Note: For Ethernet frame structure, only User Defined is available.
- Page 131 Traffic Gen & Mon Test Setup and Results Streams Configuration Frame Size (Bytes): Enter the frame size. The default value will be equal to the minimum frame size or to 98 bytes if the minimum frame size is under 98 bytes. The minimum frame size varies with the framing selection, number of VLAN layers configured, and proprietary information insertion for jitter, latency and sequence tracking.
- Page 132 Traffic Gen & Mon Test Setup and Results Streams Configuration Transmit TX: Enable or Disable current stream transmission. The default setting is Enabled. Note: If TX is enabled for any stream, that stream button will be highlighted with a green border. TX Rate: Set the transmission rate in terms of a percentage of the line ...
- Page 133 Traffic Gen & Mon Test Setup and Results Streams Configuration Shaping Note: Shaping is available for 1- Main stream configuration only. Shaping: Select the shape of the 1- Main stream. Choices are Constant, Burst, and Ramp. The default setting is Constant. Note: The shaping is forced to Constant when Jitter is enabled.
- Page 134 Traffic Gen & Mon Test Setup and Results Streams Configuration Max. TX Rate: Determine the maximum transmit rate for Burst or Ramp shaping mode.The accepted range is from 0.001 to 100. Copy Main Stream to All Streams: Press Copy Main Stream to All ...
- Page 135 Traffic Gen & Mon Test Setup and Results Streams Configuration Stream Tags Frame Loss/ Out-Of-Sequence: Enable or disable the Frame Loss/ Out-Of-Sequence. The default value is Enabled. This determines if proprietary information is inserted in the payload of the transmitted frames for Frame Loss and Out-Of-Sequence detection.
- Page 136 Traffic Gen & Mon Test Setup and Results Streams Configuration When the Throughput Pass/Fail Verdict is selected as Disabled, the Pass/Fail Verdict is not displayed. Frame Loss Pass/Fail Verdict: Select the type of verdict for declaring the frame loss. Choices are Count, Rate, and Disabled. The default value is Count.
-
Page 137: Summary Results
Traffic Gen & Mon Test Setup and Results Summary Results Summary Results From the Test menu, press Results, and the Summary tab. By default, Summary page will be displayed, when the test starts. Note: The summary results apply to 1-Main stream only. NetBlazer... - Page 138 Traffic Gen & Mon Test Setup and Results Summary Results Status Status: The status field displays the current status of the Traffic Gen & Mon test. Verdict is displayed only, if it is enabled. The Pass/Fail Verdict is displayed on the screen with the help of the following icons: = Pass = Fail The status displays the following:...
- Page 139 Traffic Gen & Mon Test Setup and Results Summary Results Stream 1-Main Throughput: Throughput meter displays current RX rate of the 1- Main stream graphically. The green region is delimited by the minimum and maximum thresholds corresponding to a PASS verdict. The red regions beyond the minimum and maximum thresholds corresponds to a FAIL verdict.
- Page 140 Traffic Gen & Mon Test Setup and Results Summary Results The Alarm LEDs are described as follows: LED Label Color Meaning Frame Loss Green No frame loss declared. Frame loss declared in the last second. Amber Frame loss was declared (History).
- Page 141 Traffic Gen & Mon Test Setup and Results Summary Results Traffic Total RX Rate: The Total RX Rate displays the sum of the receive rate of all streams enabled for transmission. Total TX Rate: The Total TX Rate displays the sum of the transmit rate ...
-
Page 142: Stream - Throughput Results
Traffic Gen & Mon Test Setup and Results Stream - Throughput Results Stream - Throughput Results From the Test menu, press Results, Stream, and the Throughput tab. TX Rate: Displays the transmission rate in terms of a percentage of the ... - Page 143 Traffic Gen & Mon Test Setup and Results Stream - Throughput Results Throughput Threshold Min/Max: Displays the minimum and maximum threshold value. You can configure the Throughput Threshold Min/Max value, while the test is running. For minimum, the accepted range is 0.000 to 100.000. The default value is 0.000. For maximum, the accepted range is 0.000 to 100.000.
-
Page 144: Stream - Qos Metrics Result
Traffic Gen & Mon Test Setup and Results Stream - QoS Metrics Result Stream - QoS Metrics Result From the Test menu, press Results, Stream, and the QoS Metrics tab. Frame Loss/Out-Of-Sequence (Stream 1-Main) Frame Loss: Frame Loss is declared when a missing sequence ... - Page 145 Traffic Gen & Mon Test Setup and Results Stream - QoS Metrics Result Out-Of-Sequence: Out-Of-Sequence is declared when a frame/packet has its sequence number smaller than the previously received frame/packet. The out-of-sequence parameters are applied to the Stream 1-Main only. Frame Loss Threshold: Set the threshold value for Count or Rate as ...
- Page 146 Traffic Gen & Mon Test Setup and Results Stream - QoS Metrics Result Out-Of-Sequence Threshold: Set the threshold value for Count or Rate as per the selected type of verdict. This field is also configurable, when the test is running. See Out-Of-Sequence Pass/Fail Verdict on page 124.
- Page 147 Traffic Gen & Mon Test Setup and Results Stream - QoS Metrics Result Jitter/Latency (Stream 1-Main) Jitter (ms): Displays the statistics of the Jitter parameter. Latency (ms): Displays the statistics of the Latency parameter. Jitter Threshold (ms): When the Jitter Pass/Fail Verdict is enabled, ...
-
Page 148: Traffic - Statistics Results
Traffic Gen & Mon Test Setup and Results Traffic - Statistics Results Traffic - Statistics Results From the Test menu, press Results, Traffic, and the Statistics tab. Frame Type Multicast: Displays the number of multicast frames transmitted and received with a valid FCS and multicast destination MAC address. Broadcast: Displays the number of broadcast frames transmitted and ... - Page 149 Traffic Gen & Mon Test Setup and Results Traffic - Statistics Results Frame Size RX Count: The RX Count parameter gives the count of each received frames (with or without FCS error). %: The % parameter gives the percentage ratio of each received ...
-
Page 150: Traffic - Flow Control Results
Traffic Gen & Mon Test Setup and Results Traffic - Flow Control Results Traffic - Flow Control Results From the Test menu, press Results, Traffic, and the Flow Control tab. Pause Time Maximum: Displays the maximum pause time received from the link ... - Page 151 Traffic Gen & Mon Test Setup and Results Traffic - Flow Control Results Frame Count Pause Frames: Displays the total number of valid flow control frames received, excluding Abort Frames RX. Abort Frames: Displays the total number of valid Flow Control frames ...
-
Page 153: Through Mode Test Setup And Results
10 Through Mode Test Setup and Results The Through Mode test feature is intended to monitor Ethernet traffic between two end points, with as much transparency as possible. This type of application allows in-line monitoring without using an external tapping module, a switch mirror port or any other traffic redirection scheme simply based on the interface setup parameters. -
Page 154: Configure A Through Mode Test
Through Mode Test Setup and Results Configure a Through Mode Test Configure a Through Mode Test To configure a Through Mode Test: 1. From the Test menu, press Setup. 2. From the Test Applications tab, under Ethernet group, press Through Mode. -
Page 155: Summary Results
Through Mode Test Setup and Results Summary Results Summary Results From the Test menu, press Results, and the Summary tab. Status Status: The status field displays the current status of the Through Mode test. Different status are: In Progress: The test is running. ... - Page 156 Through Mode Test Setup and Results Summary Results Rate Rate: Displays the receive rate from Port#1 to Port#2 and Port#2 to Port#1 in terms of a percentage (%) of the line rate, Mbit/s, or in Gbit/s. Current: Displays average receive rate value of the last second. ...
-
Page 157: Traffic - Statistics Results
Through Mode Test Setup and Results Traffic - Statistics Results Traffic - Statistics Results From the Test menu, press Results, Traffic, and the Statistics tab. Frame Type: Displays the number of Frames transmitted from Port 1 to Port 2, and Port 2 to Port 1. Multicast: Displays the number of multicast frames transmitted ... - Page 158 Through Mode Test Setup and Results Traffic - Statistics Results Frame Size: Displays the frame Size, transmitted between Port#1 to Port#2 and Port#2 to Port#1. Total number of frames received with an Frame size Ethernet frame size <64 Smaller than 64 bytes. Of 64 bytes.
-
Page 159: Traffic - Flow Control Results
Through Mode Test Setup and Results Traffic - Flow Control Results Traffic - Flow Control Results From the Test menu, press Results, Traffic, and the Flow Control tab. Pause Time Maximum: Displays the maximum pause time received from the link ... - Page 160 Through Mode Test Setup and Results Traffic - Flow Control Results Frame Count Pause Frames: Displays the total number of valid flow control frames received, excluding Abort Frames RX. Abort Frames: Displays the total number of valid Flow Control frames ...
-
Page 161: Smart Loopback Test Setup And Results
11 Smart Loopback Test Setup and Results The Smart Loopback test allows looping back an Ethernet data stream simply based on the interface setup parameters. To configure Interface setup, see Interface on page 280. The Smart Loopback test can be created from a local device or remote device. -
Page 162: Summary Results
Smart Loopback Test Setup and Results Summary Results Summary Results From the Test menu, press Results, and the Summary tab. Status Status: The status field displays the current status of the Traffic Gen & Mon test. “--”: Test is not running and results are not available. ... - Page 163 Smart Loopback Test Setup and Results Summary Results Loopback Mode Loopback Mode: The Loopback Mode parameter shall determine at which layer the address/port swapping is limited. Select the Loopback Mode. Choices are: UDP/TCP: Swap MAC addresses, IP addresses, UDP or TCP ports ...
- Page 164 Smart Loopback Test Setup and Results Summary Results Traffic Total TX Rate: Indicates the transmission rate as a percentage of the line rate (%), Mbit/s, or Gbit/s. Total RX Rate: Indicates the receive rate as a percentage of the line ...
-
Page 165: Third-Party Remote Loopback
This feature is used for unidirectional testing, where the test stream is transmitted from the third party device to a remote EXFO device. The looped back test stream is received and analyzed by the third-party device. -
Page 167: 12 Ping Test Setup And Results
12 Ping Test Setup and Results The Ping test is used to determine if a network device is reachable. The Ping menu offers the following structure: SubMenu Tab/Page Page Ping Global Summary NetBlazer... -
Page 168: Configuring A Ping Test
Ping Test Setup and Results Configuring a Ping Test Configuring a Ping Test To configure the Ping test: 1. From the Test menu, press Setup. 2. From the Test Applications tab, under Ethernet group, press Ping. 3. From the Interface tab, configure the Port, Network settings, and view the information on the SFP/SFP+ page. -
Page 169: Global Configuration
Ping Test Setup and Results Global Configuration Global Configuration From the Test menu, press Setup, Ping, and the Global tab. IPv4 IPv6 NetBlazer... - Page 170 Ping Test Setup and Results Global Configuration Source IP Address: Displays the Source IP Address configured in the Network page. To modify the Source IP Address, press IP Config. For more details, see Source IP Configuration Pop-Up on page 309. Note: For IPv6, instead of Source IP Address, configure Source Link Local IPv6 Address and Source Global IPv6 Address.
- Page 171 Ping Test Setup and Results Global Configuration Flow Label (For IPv6 Only): Enter the Flow Label value. The acceptable range is from 0 to 1048575. The default value is 0. Procedure Timeout (ms): Enter the maximum time allowed between an ICMP ...
-
Page 172: Summary Results
Ping Test Setup and Results Summary Results Summary Results From the Test menu, press Results, and the Summary tab. To succeed, a Ping command shall be acknowledged by the network device within a given delay (Timeout). Typically a Ping command can fail for the following reasons: The IP address is unavailable or unknown. - Page 173 Ping Test Setup and Results Summary Results Status Description Successful Valid ICMP echo reply received. Aborted When a user has manually stopped the Ping function before the end of attempts. When an ICMP echo reply was not received within the Time Out defined timeout.
- Page 174 Ping Test Setup and Results Summary Results Replied From: Indicates the IP address of the replier. Bytes: Indicates the buffer size of the ICMP echo response. Time: Indicates the time of response in milliseconds. TTL for IPv4 and Hop Limit (TTL) for IPv6: Indicates the TTL of the ...
-
Page 175: Trace Route Test Setup And Results
13 Trace Route Test Setup and Results The Trace Route test is used to obtain the list of all hops identified between the local port (FTB-860/880 NetBlazer Series) and the destination IP port. The Trace Route menu offers the following structure: SubMenu Tab/Page Page... -
Page 176: Configuring A Trace Route Test
Trace Route Test Setup and Results Configuring a Trace Route Test Configuring a Trace Route Test To configure the Trace Route test: 1. From the Test menu, press Setup. 2. From the Test Applications tab, under Ethernet group, press Trace Route. -
Page 177: Global Configuration
Trace Route Test Setup and Results Global Configuration Global Configuration From the Test menu, press Setup, Trace Route, and the Global tab. IPv4 IPv6 NetBlazer... - Page 178 Trace Route Test Setup and Results Global Configuration Source IP Address: Displays the Source IP Address configured in the Network page. To modify the Source IP Address, press IP Config. For more details, see Source IP Configuration Pop-Up on page 309. Note: For IPv6, instead of Source IP Address, configure Source Link Local IPv6 Address and Source Global IPv6 Address.
-
Page 179: Summary Results
Trace Route Test Setup and Results Summary Results Summary Results From the Test menu, press Results, and the Summary tab. To succeed, a Trace Route command shall be acknowledged by the network device within a given delay (Timeout). Typically a Trace Route command can fail for the following reasons: The IP address is unavailable or unknown. - Page 180 Trace Route Test Setup and Results Summary Results Status Description Successful Valid ICMP echo reply received. Aborted When a user has manually stopped the Trace Route function before the end of attempts. When an ICMP echo reply was not received Time Out within the defined timeout.
- Page 181 Trace Route Test Setup and Results Summary Results Status Description Packet Too Big message is received in Packet Too Big response to a packet that the router cannot forward because the packet is larger than the MTU of the outgoing link. It is only applicable for the IPv6 version.
-
Page 183: 14 Cable Test Setup And Results
14 Cable Test Setup and Results The Cable Test is used to diagnose UTP twisted pairs cables (up to Category 6e/Class E). Note: The Cable Test can only be configurable once the Cable Test software option is activated. Cable test can be performed everywhere in the network where an electrical 10/100/1000 Mbit/s Ethernet interface is available for testing. -
Page 184: Configuring Cable Test
Cable Test Setup and Results Configuring Cable Test Configuring Cable Test To configure the Cable Test: 1. From the Test menu, press Setup. 2. From the Test Applications tab, under Ethernet group, press Cable Test. Note: If the interface type is other then 10/100/1000 Mbit/s Electrical, application displays a message to change interface type to 10/100/1000 Mbit/s Electrical. -
Page 185: Global Configuration
Cable Test Setup and Results Global Configuration Global Configuration From the Test menu, press Setup, Cable Test, and the Global tab. Global Options Wiring Standard: Select the pin-to-pair assignment corresponding to the UTP cable used. Choices are T568A and T568B. The default setting is T568A. - Page 186 Cable Test Setup and Results Global Configuration Note: The following parameters are only available when the Pass/Fail Verdict is Enabled. Prop. Delay Threshold (ns): Set the threshold value as the maximum time for a pulse to reach the far end. If the determined propagation delay is less than or equal to the threshold value, the test is declared as PASS.
-
Page 187: Summary Results
Cable Test Setup and Results Summary Results Summary Results The cable test result Summary tab gives the cable test status and Pass/Fail verdict, when enabled. The worst pair’s Wire Map, Prop. Delay, Delay Skew, and Length results are also displayed with the Pass/Fail verdict (when Enabled). - Page 188 Cable Test Setup and Results Summary Results Cable Note: When no value is available, “--” is displayed. Wire Map: Indicates the Wire Map result for the pair having the worst Wire Map. The distance to fault is also displayed when a fault is identified.
- Page 189 Cable Test Setup and Results Summary Results Pairs Note: When no value is available, “--” is displayed. Pair: Indicates the pair number. Pins: Indicates the pair’s pin numbers and color of each wire corresponding to the selected wiring standard (see page 173). W-BL White-Blue Blue...
- Page 190 Cable Test Setup and Results Summary Results MDIX (-): For 1Gbit/s, crossed pair with pair A swapped with pair B and/or pair C swapped with pair D. Noise: Excessive noise on a pair most likely caused by a link partner running in 10/100 Mbit/s forced mode. In this case, no propagation delay or length is reported and there is no comparison with any threshold.
- Page 191 Cable Test Setup and Results Summary Results Prop. Delay (ns): Indicates the propagation delay of a signal through each pair. Length (m/ft): Indicates the cable length of each pair If the determined Wire Map is either MDI, MDIX, MDI (-), MDIX (-), or Noise (Link up), the test is declared as PASS.
-
Page 193: 1588 Ptp Test Setup And Results
15 1588 PTP Test Setup and Results The 1588 PTP (Precision Time Protocol) test application handles the 1588 PTP communication with the Grand Master (GM) clock, collects statistics related to packets, and monitors the clock Quality Level. The 1588 PTP menu offers the following structure: Submenu Page Setup... -
Page 194: Configuring A 1588 Ptp Test
1588 PTP Test Setup and Results Configuring a 1588 PTP Test Typical Test Application: FTB-860/880 Grand Master Clock Source Network under test Testing Unit GM Clock Configuring a 1588 PTP Test To configure the 1588 PTP test: 1. From the Test menu, press Setup. 2. - Page 195 1588 PTP Test Setup and Results Configuring a 1588 PTP Test 3a. Press the Modify Structure button and select the interface/rate. Refer to Test Configurator - Modify Structure on page 293 for more information. 3b. Press the interface block to configure the interface, network, and to see SFP/SFP+ information (optical ports).
-
Page 196: 1588 Ptp
1588 PTP Test Setup and Results 1588 PTP 1588 PTP From the Test menu, press Setup, Test Configurator, and the 1588 PTP test block. Profile is not configurable and is set to ITU G.8265.1, also called Telecom Profile, which is for frequency synchronization. Mode is not configurable and is set to Unicast which implies a ... - Page 197 1588 PTP Test Setup and Results 1588 PTP Quick Ping: Press the Quick Ping button to test if the Grand Master IP address can be reached. A message is returned indicating if the ping attempt was Successful or Failed. IP TOS/DS: Enter the Type of Service: 0x00 (default) to 0xFF.
- Page 198 1588 PTP Test Setup and Results 1588 PTP Message Rate Announce determines the transmission interval of the Announce messages: 1 message/2s (default), 1 message/s, or 8 message/s. Sync determines the transmission interval of the Sync messages: 32 (default), 64, or 128 message/s. Delay-Request determines the transmission interval of the Delay ...
- Page 199 1588 PTP Test Setup and Results 1588 PTP GM Info Note: Only available when Grand Master clock information is available. The Grand Master Information window displays the decoded clock information. Identity report the 8-byte identification code of the Grand Master ...
- Page 200 1588 PTP Test Setup and Results 1588 PTP PTP Alarm Timeout/Threshold Note: The following parameters are also used to declared the Pass/Fail verdict (see Pass/Fail Verdict on page 189). Receipt Timeout defines the threshold used to declare a Loss Announce or Loss Sync message alarm: 2 to 255 messages (default is 3 messages).
- Page 201 1588 PTP Test Setup and Results 1588 PTP Pass/Fail Verdict Pass/Fail Verdict check box when selected (default) enables the use of the pass/fail verdict leaving no room for misinterpretation of the test results. The Pass/Fail verdict is displayed on the screen with the help of the following icons: = Pass = Fail...
-
Page 202: Summary (1588 Ptp)
1588 PTP Test Setup and Results Summary (1588 PTP) Summary (1588 PTP) From the Test menu, press Results, and the Summary tab. Test Status displays the current status of the 1588 PTP test. The pass/fail verdict is also displayed when enabled. Test Status Description Idle state, the test is not running or results are not... - Page 203 1588 PTP Test Setup and Results Summary (1588 PTP) The global test pass/fail verdict is displayed next to the Test Status field when enabled (see Pass/Fail Verdict on page 189). The verdict is Pass when all verdicts are Pass, the verdict is Fail as soon as one of the verdict is Fail.
- Page 204 1588 PTP Test Setup and Results Summary (1588 PTP) GM Info Note: Only available when Grand Master clock information is available. The Grand Master Information window displays the decoded clock information. Identity report the 8-byte identification code of the Grand Master ...
- Page 205 1588 PTP Test Setup and Results Summary (1588 PTP) Delay Measurement Sync IPDV meter displays the average of the inter packet delay variation of consecutive Sync messages in the last second. The value and the pass/fail verdict is also displayed when enabled. Delay Req IPDV meter displays the average of the inter packet delay ...
-
Page 206: Ptp Stats
1588 PTP Test Setup and Results PTP Stats PTP Stats From the Test menu, press Results, and the PTP Stats tab. TX/RX PTP Message Count/Rate Gives the transmitted/received count and average rate for each PTP message, and the total count for all messages. Signaling Announce Req Signaling Announce Grant Signaling Sync Req... - Page 207 1588 PTP Test Setup and Results PTP Stats Note: In the case where messages are lost while the Receipt Timeout is set to a large value (slow communication), the last valid recorded rate value will be preceded with “<” to indicate that the reception rate is not stable. This applies to Delay Resp, Announce, Sync, and Follow UP.
-
Page 208: Quality Level (1588 Ptp)
1588 PTP Test Setup and Results Quality Level (1588 PTP) Quality Level (1588 PTP) The quality level characterizes the clock quality in terms of network synchronization. From the Test menu, press Results, and the Quality Level tab. Last QL Received indicates the last Quality Level value received. The ... - Page 209 1588 PTP Test Setup and Results Quality Level (1588 PTP) Expected QL allows the selection of the Expected Quality Level value. Available when the QL Mismatch Monitoring check box is selected. Quality Level PTP Clock Description value Class QL-PRS Primary Reference Source Traceable (G.811) (default) QL-STU/UNK...
- Page 210 1588 PTP Test Setup and Results Quality Level (1588 PTP) Count gives the count for each QL code (PTP Clock Class) included in the announce message received. Other includes all clock class codes (0 to 255) included in the ...
-
Page 211: 16 Synce Test Setup And Results
16 SyncE Test Setup and Results The Synchronous Ethernet (SyncE) test application provides elementary test primitives to interactively validate the clock management functions of a SyncE capable network equipment. The SyncE menu offers the following structure: Submenu Page Setup Test Configurator - Modify Structure Test Configurator - Interface Test Configurator - Network Interface / Test Configurator - SFP/SFP+... - Page 212 SyncE Test Setup and Results Typical Test Applications: FTB-860/880 Network under test Testing Unit Network Equipment FTB-860/880 FTB-860/880 Network under test Testing Unit Testing Unit FTB-860/880...
-
Page 213: Configuring A Synce Test
SyncE Test Setup and Results Configuring a SyncE Test Configuring a SyncE Test To configure the SyncE test: 1. From the Test menu, press Setup. 2. From the Test Applications tab, under Packet Sync group, press SyncE. 3. From the Test Configurator tab, configure the interface structure and its parameters. - Page 214 SyncE Test Setup and Results Configuring a SyncE Test 3b. Press the interface block to configure the interface, network, and to see SFP/SFP+ information (optical ports). Ensure that the link is up and the power level (when supported) is present in the status bar before proceeding to the next step (refer to Status Bar on page 23).
-
Page 215: Synce
SyncE Test Setup and Results SyncE SyncE From the Test menu, press Setup, Test Configurator, and the SyncE test block. ESMC Monitoring ESMC (Ethernet Synchronization Message Channel) is a live value monitored even when the test is not started. An arrow next to the ESMC label indicates that ESMC valid information frames are received or not. - Page 216 SyncE Test Setup and Results SyncE QL Mismatch Monitoring check box when selected (default) enables the Quality Level mismatch monitoring. The quality level characterizes the clock quality in terms of network synchronization. Expected QL available when the QL Mismatch Monitoring check box ...
- Page 217 SyncE Test Setup and Results SyncE QL Rate (frame/s) defines the frame rate at which the ESMC transmit the QL message value: 1 (default), 5, or 10 frames per second. For 1GE Electrical interface using Local Clock set to Slave, the QL Rate is not configurable and is set to 1 frame/s.
-
Page 218: Summary (Synce)
SyncE Test Setup and Results Summary (SyncE) Summary (SyncE) From the Test menu, press Results, and the Summray tab. Test Status displays the current status of the SyncE test. The pass/fail verdict is also displayed when enabled. Test Status Description The test is not running or results are not available. - Page 219 SyncE Test Setup and Results Summary (SyncE) The global test pass/fail verdict is displayed next to the Test Status field when enabled (see Pass/Fail Verdict on page 204). The verdict is Pass when all verdicts are Pass, the verdict is Fail as soon as one of the verdict is Fail.
- Page 220 SyncE Test Setup and Results Summary (SyncE) Last QL Message indicates the last Quality Level value received. The pass/fail verdict is also displayed when both QL Mismatch Monitoring and Pass/Fail Verdict check boxes are selected. Last Change indicates the date and time of the Last QL Message has changed.
-
Page 221: Quality Level (Synce)
SyncE Test Setup and Results Quality Level (SyncE) Quality Level (SyncE) The quality level characterizes the clock quality in terms of network synchronization. From the Test menu, press Results, and the Quality Level tab. Generated QL indicates the Quality Level value that is generated. ... - Page 222 SyncE Test Setup and Results Quality Level (SyncE) Expected QL allows the selection of the Expected Quality Level value. Available when the QL Mismatch Monitoring check box is selected. Quality Level Description value QL-STU/UNK Synchronized - Traceability Unknown QL-PRS Primary Reference Source Traceable (G.811) QL-PRC Primary Reference Clock Traceable (G.811)
- Page 223 SyncE Test Setup and Results Quality Level (SyncE) QL Mismatch Frame Count gives the total count of information and/or event frames received not matching the expected Quality Level. Only available when the QL Mismatch Monitoring check box is selected. ...
-
Page 225: 17 Fc Bert Test Setup And Results
17 FC BERT Test Setup and Results The Fibre Channel feature provides the capability to perform tests on Fibre Channel networks. In the Fibre Channel network, multiple servers and storage devices can be accessed in a shared network. In the Fibre Channel Test and Measurement product, a BERT test can be performed on the local and remote fibre channel ports using the point-to-point or fabric topology. -
Page 226: Configuring A Fibre Channel Test
FC BERT Test Setup and Results Configuring a Fibre Channel Test Configuring a Fibre Channel Test To configure the Fibre Channel test: 1. From the Test menu, press Setup. 2. From the Test Applications tab, under Fibre Channel group, press FC BERT. -
Page 227: Interface
FC BERT Test Setup and Results Interface Interface The Interface is used to configure the local test interface. The required parameters correspond to the physical interface, World Wide Name (WWN), Buffer-to-Buffer Flow, and Login management. Configuring the interface includes configuring the Port settings and you can view the information on SFP/SFP+ tab. -
Page 228: Interface - Port
FC BERT Test Setup and Results Interface - Port Interface - Port The Port tab allows the selection and the configuration of the physical port, World Wide Name (WWN), Buffer-to-Buffer Flow Control, and Login management. From the Test menu, press Interface and the Port tab. FTB-860/880... - Page 229 FC BERT Test Setup and Results Interface - Port Physical Interface Port: Select either Port 1 or Port 2. Speed: Select the fibre channel speed based on the port that you select. If you select Port 1, choices are as follows: ...
- Page 230 FC BERT Test Setup and Results Interface - Port World Wide Name (WWN) Only available when Enable Login is selected. Source: Allows to set the 64 byte WWN address. This is the address of the local fibre channel port. The accepted range is 00-00-00-00-00-00-00-00 to FF-FF-FF-FF-FF-FF-FF-FF.
- Page 231 FC BERT Test Setup and Results Interface - Port Buffer to Buffer Flow Control Buffer to Buffer (BB) Flow Control is also called as Flow Control Management. This manages the control of data traffic between the local and remote fibre channel ports based on the network, distance, and congestion in the traffic.
- Page 232 FC BERT Test Setup and Results Interface - Port Login Management After a link is established, you can logon to the Fibre Channel Network. To send and receive data between a local and remote fibre channel port, there has to be a connection between the Fibre Channel Network. This connection is established using the Login process.
- Page 233 FC BERT Test Setup and Results Interface - Port Discovered Topology: There are two types of topologies: Point To Point and Fabric. Fabric: Ports are interconnected to a fabric switching network. When the Discovered Topology is Fabric, the fabric topology icon is displayed.
- Page 234 FC BERT Test Setup and Results Interface - Port Fabric Status: Indicates the status of the Fabric switching network. The status is not available when the discovered topology is Point-to-Point. It has the following status: Logged in, Failed, In Progress, Logged-out (default status).
-
Page 235: Global Configuration
FC BERT Test Setup and Results Global Configuration Global Configuration From the Test menu, press FC BERT, and the Global tab. Frame Frame Size (Bytes): Select the frame size. Frame size is the number of bytes in a frame. The value has to be in multiples of 4. When you enter any value, which is not in multiples of 4, automatically, the next higher value is taken, which is a multiple of 4. - Page 236 FC BERT Test Setup and Results Global Configuration Pass/Fail Verdict Pass/Fail Verdict: The Pass/Fail Verdict configuration enables or disables the use of the pass/fail verdict for the Bit Error Rate, Bit Error Count, and Round Trip Latency threshold. Select the Pass/Fail Verdict as Bit Error Count &...
- Page 237 FC BERT Test Setup and Results Global Configuration If the Pass/Fail Verdict is Bit Error Count & Latency or Bit Error Count, the accepted BER threshold range is 0 to 999999 with default value of 0. The BER Threshold indicates the number of accepted errors before failing the Test.
- Page 238 FC BERT Test Setup and Results Global Configuration Test Timer Duration: Select the duration of the test. The choices are as follows: 15-Min 1-Hour 2-Hours 4-Hours 6-Hours 12-Hours 24-Hours User Defined: Select the duration field next to User Defined and a ...
-
Page 239: Summary Results
FC BERT Test Setup and Results Summary Results Summary Results The Summary Results page allows you to not only view the status of the test, but to also change certain parameters dynamically as the test is running, such as injecting errors, changing the transmission rate, and thresholds. - Page 240 FC BERT Test Setup and Results Summary Results Status Status: The FC test progress is monitored and updated on a per second basis. The status displays the following: “--”: Test is not running or results are not available.Once the Fibre ...
- Page 241 FC BERT Test Setup and Results Summary Results Bit Error: A bit error indicates that there are logic errors in the bit stream. (i.e. zeros that should be ones and vice versa). Mismatch ‘0’: A mismatch ‘0’ error indicates a bit error on a binary ‘0’ ...
- Page 242 FC BERT Test Setup and Results Summary Results Round Trip Latency Round Trip Latency(ms): The round trip latency is measured for each local and remote port. The current, average, maximum, minimum, and sample values are reported. The pass or fail verdict is also displayed for the maximum round trip latency.
-
Page 243: Cpri/Obsai Test Setup And Results
18 CPRI/OBSAI Test Setup and Results The Common Public Radio Interface (CPRI) is an industry cooperation aimed at defining a publicly available specification for the key internal interface of radio base stations between the Radio Equipment Control (REC) and the Radio Equipment (RE). The Open Base Station Architecture Initiative (OBSAI) is a standard that defines the internal modular structure and interface for base stations. -
Page 244: Configuring A Cpri/Obsai Bert Test
CPRI/OBSAI Test Setup and Results Configuring a CPRI/OBSAI BERT Test Configuring a CPRI/OBSAI BERT Test To configure the CPRI/OBSAI BERT test: 1. From the Test menu, press Setup. 2. From the Test Applications tab, under Wireless group, press CPRI/OBSAI BERT. 3. -
Page 245: Global Configuration
CPRI/OBSAI Test Setup and Results Global Configuration Global Configuration From the Test menu, press Setup, Global and the BERT tab. Interface Port: Indicates that Port 1 will be used for the CPRI/OBSAI test. Rate: Select the rate for the CPRI/OBSAI test either 2.4576G or 3.072G. ... - Page 246 CPRI/OBSAI Test Setup and Results Global Configuration The Global Pass/Fail verdict is declared as Fail when at least one of the following errors is raised during the test: Bit Error Symbol Error RTD Calibration Failed BER Threshold: If the Pass/Fail verdict is enabled, select the threshold ...
- Page 247 CPRI/OBSAI Test Setup and Results Global Configuration Pattern Test Pattern: Select a test pattern. Choices are as follows: PRBS9 PRBS11 PRBS15 PRBS20 PRBS23 PRBS31 User Pattern: Go to the next field to define the user pattern parameter that indicates the test pattern to be used. The user pattern is a 32-bit (4-byte) value.
- Page 248 CPRI/OBSAI Test Setup and Results Global Configuration Test Timer Duration: Select the duration of the test. The choices are as follows: 15 minutes 1 hour 2 hours 4 hours 6 hours 12 hours 24 hours 72 hours 7 days User Defined: Go to the next field to define the test duration.
-
Page 249: Summary Results
CPRI/OBSAI Test Setup and Results Summary Results Summary Results The Summary results page allows you to not only view the status of the test, but also to change parameters dynamically as the test is running, such as error selection and injecting errors. The Summary result page will be automatically displayed when the test is started from any Setup configuration page. - Page 250 CPRI/OBSAI Test Setup and Results Summary Results Start Time Start Time: The time when the CPRI/OBSAI test was started. Interface LOS (Loss Of Signal): LOS is declared when there is no input signal. Symbol Error: A Symbol Error is declared when invalid symbols are ...
- Page 251 CPRI/OBSAI Test Setup and Results Summary Results Bit Error Rate/Count graphically displays a meter representing either the bit error rate or the bit error count depending on the Pass/Fail Verdict selection (refer to Bit Error on page 233). When the verdict is enabled, the values under the threshold are presented in green while the value above are in red.
-
Page 252: Test Functions - Rtd
CPRI/OBSAI Test Setup and Results Test Functions - RTD Test Functions - RTD Round Trip Delay (RTD) measurements are needed to quantify the time it takes for a bit to travel from the NetBlazer transmitter back to its receiver after crossing a far-end loopback. Transport delay is mainly caused by fibre distance. - Page 253 CPRI/OBSAI Test Setup and Results Test Functions - RTD Measure Delay button Allows enabling the round trip delay measurement. The test is performed once and stops (the Measure Delay button turns off by itself). The Measure Delay button is only available when the test is running.
- Page 254 CPRI/OBSAI Test Setup and Results Test Functions - RTD Delay Indicates the time required for a bit to travel from the NetBlazer transmitter back to its receiver after crossing a far-end loopback. Last indicates the result of the last RTD measurement. ...
-
Page 255: 19 Test Control
19 Test Control This chapter describes the test control buttons available on the right navigation bar of the application. Test Control NetBlazer... - Page 256 Test Control The following control buttons are available: Button Caption Description Page Start Starts the test. Stops the test. Stop Saves and loads test configuration. Save Load Phone Configures, saves, loads, imports, and exports phone numbers and phone books. Book Discover Discovers and allows to loop up/connect to a remote Remote...
-
Page 257: Start/Stop Button
Test Control Start/Stop Button Start/Stop Button The Start/Stop button allows you to start or stop the test. To start the test: Press the Start button to start the test. Start is available when the test is not running. To stop the test: Press the Stop button to stop the test. -
Page 258: Save/Load Button
Test Control Save/Load Button Save/Load Button The Save/Load button allows to save, load, import, export, and delete configuration file(s). Note: Save and load are only possible when the test is stopped. Save/Load Tab Press the Save/Load button and select the Save/Load tab. The save function stores the configuration of the module including all test settings to a file. - Page 259 Test Control Save/Load Button The load function opens a previously saved configuration file. To load a configuration: 1. Select the Media where is located the file to load. 2. Select the file from the list. 3. Press the Load Config button. Media: Allows the selection of either the Internal Flash or Removable ...
- Page 260 Test Control Save/Load Button Restore Default at Start-Up: Allows to display a pop-up upon start-up of the module asking to restore the factory default settings or not. If enabled, the user will be prompted at start-up if the factory default settings should be restored.
- Page 261 Test Control Save/Load Button Import/Export Tab The import/export function is used to either copy multiple files from one media to another or to delete file(s). Press the Save/Load button and select the Import/Export tab. Media: Allows the selection of either the Internal Flash or Removable ...
- Page 262 Test Control Save/Load Button Copy to: Allows the selection of either the Internal Flash or Removable Disk as the destination location where the file(s) will be copied. The Copy to field is enabled, only when a removable disk/key is connected to the FTB-1 USB port. When Internal Flash is selected, the configuration file will be in My Documents\810-880-NetBlazer\Configuration or My Documents\860-NetBlazer\Configuration.
-
Page 263: Discover Remote Button
The Discover Remote function allows to perform Ethernet tests in conjunction with a second test set (module) by scanning and connecting to any available EXFO Datacom remote module. The remote module is used to loop back the traffic via Smart Loopback or Dual Test Set (DTS) for simultaneous bidirectional EtherSAM and RFC 2544 results. - Page 264 Test Control Discover Remote Button Under Remote Modules Discovery, configure the following parameters. Scan Subnet: When scan subnet is enabled, the local module scans the subnet to discover remote compatible modules. Compatible remote modules are: NetBlazer modules (FTB-860 Series, FTB-880, and AXS-85x) ...
- Page 265 Test Control Discover Remote Button Remote Capability: Select Remote Loopback, DTS EtherSAM, or DTS RFC 2544 as remote capability. The default setting is Remote Loopback. Remote Loopback discovers the NetBlazer modules supporting the Remote Loopback feature. Remote Loopback is only supported on NetBlazer modules.
- Page 266 Test Control Discover Remote Button Connect establishes the connection with the selected remote module. For connection between two NetBlazer modules, the connect also sets the remote module into either DTS RFC 2544 or DTS EtherSAM test application, depending on the Remote Capability selected. Connect is available when the Remote Capability is set to DTS RFC 2544 or DTS EtherSAM, and a remote module is selected from the list.
- Page 267 Test Control Discover Remote Button Manual Selection Tab The Manual Selection tab offers a manual selection of the remote module. For the module to be auto-discovered, see the Scan tab. Press the Discover Remote button and select the Manual Selection tab. Under Remote Module Manual Selection, configure the following parameters.
- Page 268 Test Control Discover Remote Button Refresh Status: Enable Refresh Status to refresh the Status and Remote ID of the specified target IP address periodically. Remote ID: Indicates the remote NetBlazer module ID. Under Local Modules Identification, enter a module ID if required. Module ID is used to easily identify a remote NetBlazer module when ...
-
Page 269: Phone Book Button
Test Control Phone Book Button Phone Book Button The Phone Book is used to configure, save, load, import, and export phone numbers and phone books. Configure tab The Configure tab allows you to save a phone number and associate a name with it. - Page 270 Test Control Phone Book Button To delete an entry in the Phone Book: 1. Select the entry in the phone book that has to be deleted by selecting its check box. Note: Press (Un)Select All to select or un-select all entries in a phone book. 2.
- Page 271 Test Control Phone Book Button Save/Load tab The Save tab allows you to store a phone book. The Load function allows access to a previously stored phone book. Media: Allows the selection of either the Internal Flash or Removable Disk as the source location for the file(s) to be saved/loaded.
- Page 272 Test Control Phone Book Button Load Phone Book: The main aim of the load function is to load previously saved Phone Book from either Internal Flash or Removable Disk. Press Load Phone Book to load up the selected Phone Book from the list.
- Page 273 Test Control Phone Book Button File Type: Select the phone book file type. File and Format: Displays the File name and the format. (Un) Select All: Press (Un) Select All to select or unselect all phone books in the list. The phone book can even be selected by using the scrolling buttons to navigate through the list and then pressing selecting a file.
-
Page 274: Report Button
Test Control Report Button Report Button Reports can be generated for all tests at the exception of Smart Loopback test. The report contains all the information about the test including the job information, system information, interface setup, test summary, test configuration, results, etc. - Page 275 Test Control Report Button Config/Save Tab The Config/Save tab allows to configure the report parameters and generate/save the report. Press the Report button and select the Config/Save tab. Job Information: These parameters are used to identify the source of the report and are not mandatory.
- Page 276 Test Control Report Button Report Title: Enter the report title which can be up to 30 characters long. This can be the name of the product, name of test, or test number for example. Logger in Report when checked will include the Logger details in ...
- Page 277 Test Control Report Button Save Report File Name: Enter the name of the report to be generated. By default, the name of the report will contain the name of the test, the date (YY_MM_DD), and the time (HH_MM_SS). Save To: Select the media where the report file will be saved.
- Page 278 Test Control Report Button Open Tab Report files can be opened from this page. Press the Report button and select the Open tab. Media: Allows the selection of either the Internal Flash or Removable Disk to load the report file. Removable Disk option is available only when there is one connected to the FTB-1 USB port.
- Page 279 Test Control Report Button Import/Export Tab Report files can be transferred to and from an external USB media as well as deleted. Press the Report button and select the Import/Export tab. Media: Allows the selection of either the Internal Flash or Removable ...
- Page 280 Test Control Report Button Copy to: Allows the selection of either the Internal Flash or Removable Disk as the destinaltion location where the file(s) will be copied. The Copy to field is enabled, only when a removable disk/key is connected to the FTB-1 USB port. Copy: Import/exports the selected file(s).
-
Page 281: Laser Button
Test Control Laser Button Laser Button The Laser button enables or disables the laser for optical interfaces. Laser Button Border Color Description Black Laser is off. Laser is on. Note: For SFP+ power level 2, a delay of up to 90 seconds may be required before generating/transmitting (TX) the laser signal as defined in the Specifications for Enhanced Small Form Factor Pluggable Module (SFF-8431). -
Page 282: Headset/Dtmf
Test Control Headset/DTMF Headset/DTMF The Headset/DTMP pop-up window allows to connect a B-Channel (Speech or 3.1 kHz) to the headset and DTMF tones can be generated using the keyboard. The volume of the headset speaker and microphone is adjustable. The settings here and on the platform are independent but platform settings may limit level control. -
Page 283: Reset Button
Test Control Reset Button The Disconnect Headset/DTMF to Channel button disconnects the headset or DTMF for the first Speech or 3.1 kHz channel. The DTMF phone-style button grid is used to enter the standard DTMF tone (0-9,*,#). The slide bar of the Speaker Volume and Mic Volume is used to increase or decrease the volume of the Speaker and Mic for calls. -
Page 284: Lpbk Tool Button (Loopback Tool)
Test Control Lpbk Tool Button (Loopback Tool) Lpbk Tool Button (Loopback Tool) The Loopback Tool provides the capability of looping back the Ethernet frames/packets that are received on the port unused by the main test application. Pressing the Lpbk Tool button opens the Loopback Tool pop-up and powers up the port unused by the main test application (it does not start looping back the frames yet). - Page 285 Test Control Lpbk Tool Button (Loopback Tool) Loopback Tool tab The Loopback Tool tab allows you to configure Loopback, Loopback Mode, and Rate Unit. Press the Lpbk Tool button and select the Loopback Tool tab. Status: The status field displays the current status of the Loopback test. ...
- Page 286 Test Control Lpbk Tool Button (Loopback Tool) Loopback Mode: The Loopback Mode parameter shall determine at which layer the address/port swapping is limited. Select the Loopback Mode. Choices are: UDP/TCP: Swap MAC addresses, IP addresses, UDP or TCP ports ...
- Page 287 Test Control Lpbk Tool Button (Loopback Tool) Port Tab The Port tab allows you to configure the Physical Interface and Link. Press the Lpbk Tool button and select the Port tab. Physical Interface Port: Displays the port on which the Loopback Tool runs. The port ...
- Page 288 Test Control Lpbk Tool Button (Loopback Tool) Cable Mode: Select Cable Mode if the Interface Type is Electrical. Choices are Auto Detect and Manual. If Manual is selected, go to the next field and select the type of cable (MDI for straight through, MDIX for crossover).
- Page 289 Test Control Lpbk Tool Button (Loopback Tool) Note: For Auto, the negotiated duplex is displayed beside the duplex configuration parameter. Flow Control: The Flow Control is not configurable and set to None. The FTB-860/880 will stop transmitting for the requested time value specified by the valid flow control frame received.
- Page 290 Test Control Lpbk Tool Button (Loopback Tool) Network tab The Network tab allows you to configure the MAC Address, IP Address, and VLAN. Press the Lpbk Tool button and select the Network tab. For MAC, IP, and VLAN settings, refer to Interface - Network on page 285. FTB-860/880...
-
Page 291: Common Test Setup, Results, And Functions
20 Common Test Setup, Results, and Functions The following tabs/pages are commonly used by Ethernet, Packet Sync, Fibre Channel, and/or Wireless Test Applications. Submenu Tab/Page Page Setup Interface - Port Interface - Network Interface / Test Configurator - SFP/SFP+ Test Configurator - Modify Structure Test Configurator - Interface Test Configurator - Network MAC/IP/UDP Configuration... -
Page 292: Interface
Common Test Setup, Results, and Functions Interface Interface The Interface is used to configure the local test interface. The required parameters correspond to the physical, data link, and network layers. The parameters are globally configured and applied to all tests at the exception of Packet Sync tests. - Page 293 Common Test Setup, Results, and Functions Interface - Port Physical Interface Port: Select either Port 1 or Port 2. Note: Only Through Mode test supports dual ports and the port configurations are coupled. Changing the configuration of Port 1 will also change the Port 2 configurations and vice versa.
- Page 294 Common Test Setup, Results, and Functions Interface - Port Clock Mode: This field is enabled, only when the 10G LAN or 10G WAN interface type is selected. Choices are. Internal: Internal clock of the unit (STRATUM 3). Internal is the only available clock when 10GigE LAN transceiver mode is selected with RFC 2544, EtherBERT, Traffic Gen &...
- Page 295 Common Test Setup, Results, and Functions Interface - Port Link Auto-Negotiation: Enable Auto-Negotiation, if the remote connected port is also set to Auto-Negotiation, otherwise it should be disabled. This is available only with the 10/100/1000 Mbit/s Electrical interface. Speed: Select the Speed of the interface. ...
- Page 296 Interface Type. J0 Trace: Enter the J0 Trace value in the 16 bytes format. The default value is EXFO 10GigE. J1 Trace: Enter the J1 Trace value in the 16 bytes format. The default value is EXFO 10GigE.
-
Page 297: Interface - Network
Common Test Setup, Results, and Functions Interface - Network Interface - Network The Network tab allows the configuration of the Ethernet port parameters. From the Test menu, press Setup, Interface, and the Network tab. IPv4 Note: The source MAC Address field is fixed and is not configurable. IP Version: Select the IP Version. - Page 298 Common Test Setup, Results, and Functions Interface - Network If IPv4 is selected as the IP version, configure the remaining fields as below. DHCP: Enable or disable the DHCP . Note: If DHCP is Enabled, all parameters are set to the values obtained through DHCP .
- Page 299 Common Test Setup, Results, and Functions Interface - Network Default Gateway: Enable or disable the Mode of Default Gateway. The default setting is Disabled. If Enabled, enter the default gateway address for the Ethernet port. The default value is 0.0.0.0. If IPv6 is selected as the IP version, configure the remaining fields as below.
- Page 300 Common Test Setup, Results, and Functions Interface - Network Address: This field is configurable only when the Mode is Static. The Link-Local IPv6 Address must start with FE80. The accepted range is from FE80:0000:0000:0000:0000:0000:0000:0000 to FE80:0000:0000:0000:FFFF:FFFF:FFFF:FFFF. The default address is FE80::[Interface ID], where [Interface ID] is generated from the source MAC address.
- Page 301 Common Test Setup, Results, and Functions Interface - Network Interface ID Coupled: This field is available when the Global IPv6 Address Mode is Static. This field allows to couple the interface ID of the Global address to the Link-Local source address. Enable or Disable the Interface ID Coupled.
- Page 302 Common Test Setup, Results, and Functions Interface - Network VLAN The FTB-860 supports up to 2 stacked layers of VLAN. VLAN allows users to configure the layers: ID, Priority, Type, and Drop Eligible. Select the number of VLAN layers. Choices are None, 1, and 2 layers. ...
-
Page 303: Interface / Test Configurator - Sfp/Sfp
Common Test Setup, Results, and Functions Interface / Test Configurator - SFP/SFP+ Interface / Test Configurator - SFP/SFP+ The 100/1000 optical interface on the module is made available via a Small Form Factor Pluggable Module (SFP) and the 10G optical via an Enhanced Small Form Factor Pluggable Module (SFP+). - Page 304 Common Test Setup, Results, and Functions Interface / Test Configurator - SFP/SFP+ SFP/SFP+ Parameters Module ID Vendor Name Part Number Serial Number Revision Connector Type: LC, MT-RJ, etc. Speed: 100Base-FX, 1000Base-SX, etc. Note: Ensure that the speed selected corresponds to the speed of the SFP installed.
-
Page 305: Test Configurator - Modify Structure
Common Test Setup, Results, and Functions Test Configurator - Modify Structure Test Configurator - Modify Structure Note: Available with Packet Sync test applications. From the Test menu, press Setup, Test Configurator, and the Modify Structure button. Interface/Rate Allows the selection of the interface/rate. Interface/Rate Connector 10/100/1000M Electrical... -
Page 306: Test Configurator - Interface
Common Test Setup, Results, and Functions Test Configurator - Interface Test Configurator - Interface Note: Available with Packet Sync test applications. From the Test menu, press Setup, Test Configurator, the interface block, and the Interface tab. LINK A green/red arrow next to the LINK label is used to indicate the status ... - Page 307 Common Test Setup, Results, and Functions Test Configurator - Interface Auto-Negotiation check box, available with 10/100/1000M Electrical interface, should be selected if the remote connected port is also set to Auto-Negotiation, otherwise its check box should be cleared. When selected, the test application indicates to the remote port which parameters to use.
- Page 308 Common Test Setup, Results, and Functions Test Configurator - Interface Physical Interface The following parameters are only available for optical interfaces. Laser indicates the status of the laser: ON with the laser pictogram (emitting an optical laser signal) or OFF. TX Power (dBm) indicates, when supported, the transmit power level ...
- Page 309 Common Test Setup, Results, and Functions Test Configurator - Interface TX Frequency TX Frequency indicates the frequency (actual frequency + offset) that will be used for transmission. Note: The following frequency offset generation parameters are only available for SyncE test application with optical interfaces. Offset (ppm) check box when selected (cleared by default), allows to ...
- Page 310 Common Test Setup, Results, and Functions Test Configurator - Interface RX Frequency Note: RX Frequency analysis is not available for 10Base-T test. Frequency (MHz) indicates the frequency of the input signal. Offset indicates the offset between the standard rate specification and ...
-
Page 311: Test Configurator - Network
Common Test Setup, Results, and Functions Test Configurator - Network Test Configurator - Network Note: Available with Packet Sync test applications. From the Test menu, press Setup, Test Configurator, the interface block, and the Network tab. MAC Address indicates the default and unique Media Access Control ... - Page 312 Common Test Setup, Results, and Functions Test Configurator - Network IP Version is not configurable and is set to IPV4. Automatic IP (DHCP) check box when selected (cleared by default) allows to dynamically obtain an IP address from a DHCP (Dynamic Host Configuration Protocol) server.
- Page 313 Common Test Setup, Results, and Functions Test Configurator - Network VLAN VLAN Tag check box when selected (cleared by default) allows to set up to 3 VLAN tags. Select the number of VLAN tag to be enabled: 1, 2, and 3 tags. ...
-
Page 314: Mac/Ip/Udp Configuration
Common Test Setup, Results, and Functions MAC/IP/UDP Configuration MAC/IP/UDP Configuration You can configure MAC, IP, and UDP parameters for EtherSAM, RFC 2544, EtherBERT, and Traffic Gen & Mon tests from this window. Note: The IP parameters are coupled with the Interface. See Interface on page 280 for more details. - Page 315 Common Test Setup, Results, and Functions MAC/IP/UDP Configuration Streams (For Traffic Gen & Mon only): Press 1-Main to configure main stream parameters. To configure streams 2 to 10, press any of the streams displayed. Note: The 1 - Main stream parameter is coupled with the test interface, while the streams 2 to 10 have individual configuration.
- Page 316 Common Test Setup, Results, and Functions MAC/IP/UDP Configuration Services (For EtherSAM only): To configure services 1to 10, press any of the services displayed. FTB-860/880...
- Page 317 Common Test Setup, Results, and Functions MAC/IP/UDP Configuration Source MAC Address: This is the unique MAC address of the device. This address cannot be edited. Destination MAC Address: Enter the Destination MAC Address if the Resolve MAC Address is disabled. The default setting is FE:FE:FE:FE:FE:FE.
- Page 318 Common Test Setup, Results, and Functions MAC/IP/UDP Configuration Source IP Address: Displays the Source IP Address configured in the Network page. To modify the Source IP Address, press IP Config. See Source IP Configuration Pop-Up on page 309, for more details. Note: For IPv6, instead of Source IP Address, configure Source Link Local IPv6 Address and Source Global IPv6 Address.
- Page 319 Common Test Setup, Results, and Functions MAC/IP/UDP Configuration It should be a valid Link-Local IPv6 Address or Global IPv6 Address address. IPv4 IPv6 The accepted range for IPv4 is 0.0.0.0 to 255.255.255.255. The default value is 0.0.0.0. The IPv6 Address can either be the Link-Local IPv6 Address or the Global IPv6 Address.
- Page 320 Common Test Setup, Results, and Functions MAC/IP/UDP Configuration Note: When a remote module is looped up, the Destination IP Address is not configurable (read only). When a remote module is looped down, the Destination IP Address reverts to the previously configured value. IP TOS/DS for IPv4 and Traffic Class (TOS/DS) for IPv6.
- Page 321 Common Test Setup, Results, and Functions MAC/IP/UDP Configuration Source IP Configuration Pop-Up The IP Config page for IPv4/IPv6 is coupled with the Interface-Network tab. Any changes made in the IP Config page is displayed in the Network tab and vice-versa. IPv4 IPv6 NetBlazer...
- Page 322 Common Test Setup, Results, and Functions MAC/IP/UDP Configuration Configure the IPv4 Parameters DHCP: Select Enabled or Disabled to enable or disable the DHCP . Note: If DHCP is enabled, all parameters are set to the values obtained through DHCP . Note: If DHCP is disabled, IP Address and Subnet Mask fields become configurable.
- Page 323 Common Test Setup, Results, and Functions MAC/IP/UDP Configuration Link-Local IPv6 Address (LLA) is used for local communication between on-link neighbors and for Neighbor Discovery process. Under Link-Local IPv6 Address, configure the following parameters. Mode: StatelessAuto allows automatic generation of the IPv6 address ...
- Page 324 Common Test Setup, Results, and Functions MAC/IP/UDP Configuration Address: This field is configurable only when the Mode is Static. The accepted range is from 0000:0000:0000:0000:0000:0000:0000:0000 to FEFF:FFFF:FFFF:FFFF:FFFF:FFFF:FFFF:FFFF. The default address is 2001::[Interface ID], where the [Interface ID] is generated from the source MAC address.
- Page 325 Common Test Setup, Results, and Functions MAC/IP/UDP Configuration The Link-Local/Global IPv6 Address Status is as below: Mode Status Description StatelessAuto Undefined Generating Stateless address auto configuration in progress. Successful IP address has been generated but duplication has been detected. Duplication Detected IP address has been generated but duplication has been detected.
- Page 326 Common Test Setup, Results, and Functions MAC/IP/UDP Configuration Mode: Automatic allows automatic selection of the default gateway. The default setting is Automatic. Static allows entering the default gateway IP address. Address: If the Mode is Static, enter the IP address of the Default Gateway.
- Page 327 Common Test Setup, Results, and Functions MAC/IP/UDP Configuration IP TOS/DS Configuration Pop-Up You can configure the Type of Service (TOS) or Differentiated Services (DS) from this window. Configure the TOS/DS parameters as explained below. TOS/DS: Select Type of Service (TOS) or Differentiated Services (DS). ...
- Page 328 Common Test Setup, Results, and Functions MAC/IP/UDP Configuration Type of Service (TOS) The possible values are shown as follow for TOS: Parameter Value Precedence 000 (Routine), 001 (Priority), 010 (Immediate), 011 (Flash), 100 (Flash Override), 101 (CRITIC/ECP), 110 (Internet Control), 111 (Network Control) Default: 000 (Routine) Delay...
- Page 329 Common Test Setup, Results, and Functions MAC/IP/UDP Configuration Differentiated Services (DS) The possible values are shown as follow for DS: Parameter Value DSCP Codepoints 000000 (CS0), 001000 (CS1), 010000 (CS2), 011000 (CS3), 100000 (CS4), 101000 (CS5), 110000 (CS6), 111000 (CS7), 001010 (AF11), 001100 (AF12), 001110 (AF13), 010010 (AF21), 10100 (AF22), 010110 (AF23), 011010 (AF31), 011100 (AF32), 011110 (AF33), 100010 (AF41), 100100 (AF42),...
-
Page 330: Streams/Services - Vlan Configuration
Common Test Setup, Results, and Functions Streams/Services - VLAN Configuration Streams/Services - VLAN Configuration VLAN Configuration page allows to enable VLAN and configure its parameters. For Traffic Gen & Mon: Press Stream and the VLAN tab. For EtherSAM: Press Services and the VLAN tab. Note: The Streams are referred as Services in EtherSAM. - Page 331 Common Test Setup, Results, and Functions Streams/Services - VLAN Configuration For EtherSAM, select any of the services from 1 to 10 to configure. VLAN VLAN: Select the number of VLAN layers for which VLAN parameters are to be configured. Choices are None, 1 Layer, and 2 Layers. NetBlazer...
- Page 332 Common Test Setup, Results, and Functions Streams/Services - VLAN Configuration VLAN #1 (C-VLAN) and VLAN #2 (S-VLAN) For each layer, set the following parameters. ID: Enter the VLAN ID. The accepted range is from 0 to 4095. The default value is 2. See VLAN on page 319. Priority: Select the VLAN Priority.
-
Page 333: Mpls Configuration
Common Test Setup, Results, and Functions MPLS Configuration MPLS Configuration The Multi Protocol Label Switching (MPLS) feature on EXFO devices allows Ethernet testing within an MPLS enabled network. You can configure MPLS for EtherSAM and Traffic Gen & Mon tests. When MPLS is enabled, management frames and test frames can be transmitted or received. - Page 334 Common Test Setup, Results, and Functions MPLS Configuration The NetBlazer Application allows MPLS configuration of streams and services with up to two layers of MPLS labels, COS, and TTL parameters. Note: MPLS should be enabled during test setup. Select Ethernet/MPLS/IPv4/UDP or Ethernet/MPLS/Ipv6/UDP from the Framing drop-down list in the Stream Profile tab for the Traffic Gen &...
-
Page 335: Timer
Common Test Setup, Results, and Functions Timer Timer Note: The Timer tab is only available with Packet Sync test applications. Allows to automatically start and/or stop the test at a given time or for a specific duration. From the Test menu, press Setup, and Timer. Timer Duration: Selects the test duration based on the test start time. - Page 336 Common Test Setup, Results, and Functions Timer Start Time selects the time the test will automatically start. The Start Time check box has to be selected to be included in the test timer. Note: A valid start time has to be subsequent to the current time. Stop Time selects the time the test will automatically stop.
-
Page 337: System
Common Test Setup, Results, and Functions System System Note: The Timer tab is only available with Packet Sync test applications. From the Test menu, press Setup, and System. Factory Default Restore Default button restores the factory default settings for all test applications. -
Page 338: Mpls Result - Ethersam/Traffic Gen & Mon
Common Test Setup, Results, and Functions MPLS Result - EtherSAM/Traffic Gen & Mon MPLS Result - EtherSAM/Traffic Gen & Mon In EtherSAM and Traffic Gen & Mon test applications, MPLS provides the capability to generate and analyze services/streams with up to two layers of MPLS labels and to filter received traffic for each MPLS service/stream. - Page 339 Common Test Setup, Results, and Functions MPLS Result - EtherSAM/Traffic Gen & Mon For Traffic Gen & Mon: From the Test menu, press Results, Stream, and the MPLS tab. Service/Stream Label 1 (Bottom) TX: Displays the label ID that is transmitted for Label 1 for that ...
- Page 340 Common Test Setup, Results, and Functions MPLS Result - EtherSAM/Traffic Gen & Mon Note: If the Label 2 is absent in the TX field, then Label 2 field displays None. If non MPLS data is transmitted, the Label 1 and Label 2 fields display None in the TX and RX field.
-
Page 341: Alarms/Errors - Ethernet/Fibre Channel
Common Test Setup, Results, and Functions Alarms/Errors - Ethernet/Fibre Channel Alarms/Errors - Ethernet/Fibre Channel The Ethernet/Fibre Channel Traffic Analyzers detect the alarms and errors for EtherSAM, RFC 2544, EtherBERT, Traffic Gen & Mon, Through Mode, and FC BERT tests. The Traffic Analyzers also report the associated statistics (Seconds, Count, Rate). - Page 342 Common Test Setup, Results, and Functions Alarms/Errors - Ethernet/Fibre Channel The alarms and errors are displayed with green, red, or amber background when applicable, else will be displayed in gray. The error count and the amount of time in seconds that the alarm remained raised during test execution are also displayed.
- Page 343 Common Test Setup, Results, and Functions Alarms/Errors - Ethernet/Fibre Channel The Alarm LEDs are described as follows: LED Label Color Meaning Link Down Green Link up. Link Down (Current) Amber Link Down was present (History). Gray Not applicable. LOS (Los of Signal) Green No LOS is present during test.
- Page 344 Common Test Setup, Results, and Functions Alarms/Errors - Ethernet/Fibre Channel LED Label Color Meaning Local Fault Green No PMA link down is present, no PCS link down is present, no High Ber is present and no WIS link down (Ethernet) is present.
- Page 345 Common Test Setup, Results, and Functions Alarms/Errors - Ethernet/Fibre Channel Errors Symbol: A Symbol error is declared when an invalid code-group in the transmission code is detected. Symbol error is not available for Ethernet 10G LAN/WAN and for FC 10X interface. Block: Indicates the count of error block received in frames.
- Page 346 Common Test Setup, Results, and Functions Alarms/Errors - Ethernet/Fibre Channel The following errors are only applicable for Ethernet and available with Half Duplex mode (only for electrical interface at speeds of 10 Mbit/s and 100 Mbit/s). Collision: Indicates the number of collisions on the link. ...
-
Page 347: Alarms/Errors - Wis
Common Test Setup, Results, and Functions Alarms/Errors - WIS Alarms/Errors - WIS When 10G WAN is selected as the interface type, additional monitoring is performed by the WIS Analyzer for RFC 2544, EtherBERT, and Traffic Gen & Mon tests. From the Test menu, press Results, Alarms/Errors, and the WIS tab. Alarms SEF (Severely Errored Framing): A SEF defect indicates that a ... - Page 348 Common Test Setup, Results, and Functions Alarms/Errors - WIS AIS-P (Alarm Indication Signal - Path): The AIS-P alarm is declared when the H1 and H2 bytes for a STS path contain an all-ones pattern in three consecutive frames or more. RDI-P (Remote Defect Indication - Path): The RDI-P alarm is declared ...
- Page 349 Common Test Setup, Results, and Functions Alarms/Errors - WIS Errors B1 (BIP-8, Bit-Interleave Parity - 8 bits): The B1 (BIP-8) error indicates a Section parity error by performing a routine even-parity check over all Section bits of the previous frame of a composite signal (located in the first STS-1 of an STS-n signal).
- Page 350 Common Test Setup, Results, and Functions Alarms/Errors - WIS REI-P (Remote Error Indicator - Path): The REI-P error is declared when bits 1 through 4 of the G1 byte contain one pattern from the following binary range: “0001" through “1000" (1 to 8) (located in every STS-1 of an STS-n signal).
-
Page 351: Alarms/Errors (Packet Sync Applications)
Common Test Setup, Results, and Functions Alarms/Errors (Packet Sync Applications) Alarms/Errors (Packet Sync Applications) Note: Available with Packet Sync test applications. From the Test menu, press Results, and the Alarms/Errors tab. Interface LOS, available with optical ports, indicates a loss of signal on the port. ... - Page 352 Common Test Setup, Results, and Functions Alarms/Errors (Packet Sync Applications) IP/UDP The following errors are available with 1588 PTP test application. IP Chksum (IP Checksum) indicates that the IP datagrams received have invalid IP header checksum. UDP Chksum (UDP Checksum) indicates that the UDP segments ...
- Page 353 Common Test Setup, Results, and Functions Alarms/Errors (Packet Sync Applications) SyncE The following alarms are available with SyncE test application. ESMC Loss alarm indicates that no ESMC valid information frames were received for more than 5 seconds. QL Mismatch alarm, available when the QL Mismatch Monitoring ...
- Page 354 Common Test Setup, Results, and Functions Alarms/Errors (Packet Sync Applications) False Carrier (available with 100M, 1000M, and 1GE Electrical interfaces) indicates that data is being received with invalid start of frame. Alignment (available with 10M and 100M interfaces) indicates the ...
-
Page 355: Wis Traces/Label
Common Test Setup, Results, and Functions WIS Traces/Label WIS Traces/Label When the Interface Type selection is set to 10G WAN, the information collected by the WAN Interface Sublayer (WIS) Analyzer is displayed in the WIS Results of the test in progress. WIS Results are continuously updated in every second. -
Page 356: Traffic (Packet Sync Applications)
Common Test Setup, Results, and Functions Traffic (Packet Sync Applications) Traffic (Packet Sync Applications) Note: Available with Packet Sync test applications. From the Test menu, press Results, and the Traffic tab. Traffic Line Utilization (%) indicates the current percentage of the ... - Page 357 Common Test Setup, Results, and Functions Traffic (Packet Sync Applications) Frame Type Displays the TX and RX count of the following frame types. Multicast indicates the number of multicast frames transmitted/received without FCS errors. Broadcast frames are not counted as multicast frames. Broadcast indicates the number of broadcast frames ...
- Page 358 Common Test Setup, Results, and Functions Traffic (Packet Sync Applications) Frame Size RX Count gives the count of each received frames (with or without FCS error). % gives the percentage ratio of each received frames (with or without FCS error) based on the total count of frames.
-
Page 359: Logger
Common Test Setup, Results, and Functions Logger Logger The Logger page allows you to configure and view the Logger events for EtherBERT, Traffic Gen & Mon, EtherSAM, FC BERT, and CPRI/OBSAI BERT Tests. From the Test menu, press Results, and the Logger tab. Sort By Sort By: Select the Sort By parameter to sort the events. - Page 360 Common Test Setup, Results, and Functions Logger Time Mode: Select the mode of time representation. Choices are: Relative: Displays the time relative to the beginning of the test or the last test results reset. The format of the time is Dd HH:MM:SS. Absolute: Displays the time relative to the test start time and start ...
- Page 361 Common Test Setup, Results, and Functions Logger Following are example of detailed information reported by type of event: Type of Event Details Test Started Start Date Test Stopped Pass/Fail Verdict Bit Error Events Current Count and Total Count SDT Events Service Disruption Time BER Threshold Value at the end of the test...
-
Page 362: Ping & Trace Route
Common Test Setup, Results, and Functions Ping & Trace Route Ping & Trace Route Note: Only available for Packet Sync test applications. From the Test menu, press Functions, and the Ping & Trace Route tab is displayed. Source IP Address Displays the configured Source IP Address. - Page 363 Common Test Setup, Results, and Functions Ping & Trace Route Ping Data Size (Bytes): Enter the data size that will be sent to the network device to be detected: 0 to 1472 bytes; 32 bytes by default. TTL: Enter the maximum number of hops the packet can go through: ...
- Page 364 Common Test Setup, Results, and Functions Ping & Trace Route The IP address is unavailable or unknown. The time allowed to perform the ping or trace route command is too short. The remote device is not supporting ICMP messaging. ...
- Page 365 Common Test Setup, Results, and Functions Ping & Trace Route Reply Details For ping, indicates the IP address of the replier, the buffer size of the ICMP echo response, the time of response in milliseconds, and the TTL of the ICMP echo response. For trace route, indicates the IP address of the replier, and the time of response in milliseconds.
-
Page 367: 21 Maintenance
21 Maintenance To help ensure long, trouble-free operation: Always inspect fiber-optic connectors before using them and clean them if necessary. Keep the unit free of dust. Clean the unit casing and front panel with a cloth slightly dampened ... -
Page 368: Recalibrating The Unit
You should determine the adequate calibration interval for your unit according to your accuracy requirements. Under normal use, EXFO recommends calibrating your unit every two years. Recycling and Disposal (Applies to European Union Only) For complete recycling/disposal information as per European Directive WEEE 2012/19/UE, visit the EXFO Web site at www.exfo.com/recycle. -
Page 369: 22 Troubleshooting
22 Troubleshooting Solving Common Problems Before calling EXFO’s technical support, please read the following common problems that can occur and their respective solution. Problem Possible Cause Solution Optical Laser LED is off and The Interface type is Ensure that the ... -
Page 370: Contacting The Technical Support Group
Contacting the Technical Support Group To obtain after-sales service or technical support for this product, contact EXFO at one of the following numbers. The Technical Support Group is available to take your calls from Monday to Friday, 8:00 a.m. to 7:00 p.m. -
Page 371: 23 Warranty
23 Warranty General Information EXFO Inc. (EXFO) warrants this equipment against defects in material and workmanship for a period of XX Number of Years XX from the date of original shipment. EXFO also warrants that this equipment will meet applicable specifications under normal use. -
Page 372: Liability
Liability Liability EXFO shall not be liable for damages resulting from the use of the product, nor shall be responsible for any failure in the performance of other items to which the product is connected or the operation of any system of which the product may be a part. -
Page 373: Exclusions
Warranty Exclusions Exclusions EXFO reserves the right to make changes in the design or construction of any of its products at any time without incurring obligation to make any changes whatsoever on units purchased. Accessories, including but not limited to fuses, pilot lamps, batteries and universal interfaces (EUI) used with EXFO products are not covered by this warranty. -
Page 374: Service And Repairs
5. Return the equipment, prepaid, to the address given to you by support personnel. Be sure to write the RMA number on the shipping slip. EXFO will refuse and return any package that does not bear an RMA number. -
Page 375: Exfo Service Centers Worldwide
Warranty EXFO Service Centers Worldwide EXFO Service Centers Worldwide If your product requires servicing, contact your nearest authorized service center. EXFO Headquarters Service Center 400 Godin Avenue 1 866 683-0155 (USA and Canada) Quebec (Quebec) G1M 2K2 Tel.: 1 418 683-5498... -
Page 377: A Specifications
The information presented in this section is provided as a reference only. To obtain this product’s most recent technical specifications, visit the EXFO Web site at www.exfo.com. Note: The following specifications are for the FTB-860 NetBlazer Series, refer to the Transport Application user guide for specification on the FTB-880 module. - Page 378 Specifications SFP+ ETHERNET OPTICAL INTERFACES (10G) 10G Base-SR/SW 10G Base-LR/LW 10G Base-ER/EW Transceiver type Wavelength (nm) 1310 1550 Model FTB-8690 FTB-8691 FTB-8692 Tx level (dBm) –5 to –1 –8 to 0.5 –4.7 to 4.0 Rx level sensitivity (dBm) –11.1 –12.6 –14.1 Maximum reach 300 m...
- Page 379 Class 1 Class 1 Class 1 Connector SFP FTTA INTERFACES CPRI/OBSAI 2.4576/3.072 Gbit/s Wavelength (nm) 1310 1310 1550 EXFO product number FTB-8590 FTB-8190 FTB-8191 FTB-8192 Tx level (dBm) –9 to –3 –5 to 0 –2 to 3 –2 to 3 Rx level sensitivity (dBm) –18 to 0...
- Page 380 Specifications ELECTRICAL INTERFACES Two ports: 10/100 Base-T half/full duplex, 1000 Base-T full duplex Automatic or manual detection of straight/crossover cable 10 Base-T 100 Base-TX 1000 Base-T Transceiver type Tx bit rate 10 Mbit/s 125 Mbit/s 1 Gbit/s Tx accuracy (uncertainty) (ppm) ±4.6 ±4.6 ±4.6...
- Page 381 Specifications Ethernet Cables Minimum Category 3 cable is required for 10Base-T connection while Category 5 cable is required for 100Base-TX and 1000Base-T connections. Maximum cable length (between two nodes) for 10Base-T, 100Base-TX, or 1000Base-T connection is 328 feet (100 meters). Straight Through Cable (10/100 Mbit/s) ...
- Page 382 Specifications Straight Through Cable (1000 Mbit/s) Crossover Cable (1000 Mbit/s) FTB-860/880...
-
Page 383: B Glossary
Glossary Acronym List Help Alternating Current Address Resolution Protocol Buffer-to-Buffer Bit Error Rate BERT Bit Error Rate Test Bit Per Second Byte Per Second Current European Conformity Committed Information Rate Class of Service CPRI Common Public Radio Interface CRITIC Critical CRITIC/ECP Critical and Emergency Call Processing NetBlazer... - Page 384 Glossary Acronym List Decibel Decibel - milliwatts DHCP Dynamic Host Configuration Protocol Differentiated Services DSCP Differentiated Services Code Point Data Terminal Equipment Dual Test Set Device Under Test Ethernet Equipment Clock Explicit Congestion Notification Emergency Call Processing Excess Information Rate Electromagnetic Compatibility End Of Frame Electrostatic Discharge...
- Page 385 Glossary Acronym List FC-2 Fibre Channel framed layer 2 Federal Communications Commission Frame Check Sequence frame per second F.Loss Frame Loss FLOGI Fabric Login (Fibre Channel) Gbit/s GigaBit Per Second Grand Master Greenwich Mean Time Global IPv6 Address HDTV High Definition Television Hertz ICMP Internet Control Message Protocol...
- Page 386 Glossary Acronym List Internet Protocol IPDV Inter Packet Delay Variation IPTV Internet Protocol Television IPv4 Internet Protocol version 4 IPv6 Internet Protocol version 6 International Organization for Standardization Layer 3 Layer 4 Local Area Network Lucent Connector Light-Emitting Diode Pound Line Feed Loss Of Signal Link Local IPv6 Address...
- Page 387 Glossary Acronym List MDIX Media Dependant Interface Crossover (crossover Ethernet cable) MPLS Multiprotocol Label Switching millisecond MT-RJ Mechanical Transfer Registered Jack MTTR Mean Time to Repair Number Network Element Nanometer OBSAI Open Base Station Architecture Initiative Operating System OOSeq Out of Sequence Organizationally Unique Identifier OUTput Personal Computer...
- Page 388 Glossary Acronym List Primitive Sequence Protocol Precision Time Protocol PVID Port VLAN Identifier Quality Level Quality of Service Q-in-Q Queue in Queue – Stacked VLAN Radio Equipment Radio Equipment Control Request For Comments RJ-45 Registered Jack 45 Return Merchandise Authorization Real Time Transport Protocol Receive second...
- Page 389 Glossary Acronym List Service-Level Agreement SONET Synchronous Optical NETwork Straight Tip Smart User Interface SyncE Synchronous Ethernet Transport Control Protocol Type-Length Variable Type Of Service Time To Live Transmit Unavailable Second User Data Protocol μs microsecond Universal Time Coordinated Unshielded Twisted Pair VLAN Identifier VLAN Virtual Local Area Network...
- Page 390 Glossary Acronym List Wide Area Network WAN Interface Sublayer World Wide Name FTB-860/880...
-
Page 391: Vlan
Glossary VLAN VLAN Special VID values (IEEE Std 802.1Q-1998) Description The null VLAN ID. Indicates that the tag header contains only user priority information; no VLAN identifier is present in the frame. This VID value must not be configured as a PVID, configured in any Filtering Database entry, or used in any Management operation. -
Page 392: 1588 Ptp
Glossary 1588 PTP 1588 PTP The goal of the IEEE 1588 Precision Time Protocol (PTP) is to provide Network Synchronization using a packet based distribution mechanism. Depending on the system application the Network Synchronization may require phase and frequency synchronization. 1588 PTP has the capability to deliver both by allowing a Client clock to track a Master clock in phase (time of day) and in frequency. - Page 393 Glossary 1588 PTP Peer Delay mechanism uses message Pdelay Request, Pdelay Response, and if required Pdelay Response Follow Up. This mechanism is restricted to topologies where each peer-to-peer port communicates PTP messages with, at most, one other such port. Peer Delay is not supported by the Telecom Profile.
- Page 394 Glossary 1588 PTP The 1588 PTP supports the following Master/Client communication; however Unicast is used for the Telocom Profile. Multicast: A Master clock sends its Sync/Follow Up and Delay Response in a multicast mode. A Client can collect information from many Master clocks and select the Master clock that is best suited for its application.
- Page 395 Glossary 1588 PTP If the Master Clock has sufficient capacity to handle the Client Clock request, it responds with a signaling message containing a GRANT UNICAST TRANSMISSION TLV. The REQUEST UNICAST TRANSMISSION TLV contains several parameters: messageType is the type of service being requested: Announce, ...
- Page 396 Glossary 1588 PTP The following diagram shows the sequence of message exchange between a Client Clock and a Master Clock. First, the Client request Unicast Announce message service. When this is granted and the first Announce message is received, the Client can check the QL value conveyed in the clockClass field of the message.
-
Page 397: Synce
Glossary SyncE SyncE Synchronous Ethernet or SyncE enables a traceable network timing reference frequency to be distributed node-by-node across a chain of Ethernet devices (SyncE compliant devices only). The network timing reference is typically hierarchically traceable to a Primary Reference Source/Clock (PRC/PRS) in a unidirectional flow. - Page 398 Glossary SyncE In order for an Ethernet interface to be considered Synchronous Ethernet compliant it needs to be upgraded as shown in the following diagram. In addition to supporting the ESMC channel, this upgrade consists in allowing the recovered clock from the CDR to be propagated to a function called the Ethernet Equipment Clock (EEC).
- Page 399 Index Index Back-to-Back..........84 10G LAN/10G WAN ........17 bit error ............. 238 1588 PTP ........... 184 Block............341 1588 PTP Test Setup and Results ....181 Broadcast Frame Type .......... 345 broadcast ..........70, 145 buffer to buffer flow control ..... 219 Aborted..........
- Page 400 Index connection DUPLEX ............13 1000Base-T ..........13 Duplex ............295 100Base-TX..........13 Duration 10Base-T ..........13 Timer ........... 323 Connector ..........293 duration ............ 236 continuous ........159, 351 conventions, safety ........3 copy ............261 EIR ........... 50, 51, 52 to............
- Page 401 Index fabric status ..........222 Generated QL ........204, 209 Factory Default Global IPv6 Address (GUA) ......311 MAC ............ 299 global test duration estimate ...... 42 Restore Default ........325 GM Info ..........187, 192 FAIL ............. 25 GM IP Address ........... 184 False Carrier..........
- Page 402 Index label, identification ........358 MAC Address..........299 Laser............296 maintenance..........355 laser ........ix, 5, 6, 15, 16, 17 front panel........... 355 Laser OFF at Start-Up ........ 296 general information ......355 Last Change ...... 193, 196, 208, 209 Master ............
- Page 403 Index phone book ..........257 load ............. 260 Negotiation Status ........185 save............259 Netotiation Status ........191 Physical Interface ........296 Network ............ 299 Ping No ............. 160, 352 Attempts..........351 Ping & Trace Route ......352 Data Size..........351 No Reply............
- Page 404 Report Title..........264 service verdict........57, 59 Request Denied ......... 191 SFP .......... 14, 16, 17, 357 Request Granted ........191 shipping to EXFO........362 Restore 1588 PTP Defaults......189 short............178 Restore Default short-between-pairs ........178 Factory Default ........325 Signaling Announce Reg......
- Page 405 Index Start Button ..........245 Throughput Configuration ......81 Start Time.......... 192, 207 time........... 162, 169 Timer ........... 324 time to live ........158, 162 start time ..........273 Timeout StatelessAuto ..........311 Ping ............. 351 static ..........311, 314 Trace Route ..........
- Page 406 Index Type ............301 wire map test result........177 type of service ........... 158 wiring standard ......... 173 world wide name ........218 UDP Checksum .......... 340 UDP/TCP ..........151, 274 Undersize ..........342 Unicast Frame Type .......... 345 unicast ..........70, 145 non..........
- Page 407 CHINESE REGULATION ON RESTRICTION OF HAZARDOUS SUBSTANCES NAMES AND CONTENTS OF THE TOXIC OR HAZARDOUS SUBSTANCES OR ELEMENTS NAMES AND CONTENTS OF THE TOXIC OR HAZARDOUS SUBSTANCES OR ELEMENTS CONTAINED IN THIS EXFO PRODUCT CONTAINED IN THIS EXFO PRODUCT EXFO...
- Page 408 MARKING REQUIREMENTS MARKING REQUIREMENTS Product Environmental protection use period (years) Logo Product Environmental protection use period (years) Logo This Exfo product This Exfo product EXFO EXFO Battery Battery If applicable. If applicable.
- Page 409 Tel.: 1 978 367-5600 · Fax: 1 978 367-5700 EXFO FINLAND Elektroniikkatie 2 FI-90590 Oulu, FINLAND Tel.: +358 (0) 403 010 300 · Fax: +358 (0) 8 564 5203 TOLL-FREE (USA and Canada) 1 800 663-3936 © 2013 EXFO Inc. All rights reserved. Printed in Canada (2013-04) ...
Need help?
Do you have a question about the FTB-860 NetBlazer Series and is the answer not in the manual?
Questions and answers