Table of Contents
Advertisement
Quick Links
I
NSTRUCTION MANUAL
SOMNOwatch™ plus BP
Caution: Federal law restricts this device to sale by or on the order of a physician.
SOMNOmedics GmbH – Am Sonnenstuhl 63 – D-97236 Randersacker
Phone.: (+49) 931 / 35 90 94-0 – Fax: (+49) 931 / 35 90 94-49
E-Mail: info@somnomedics.de – Internet: www.somnomedics.de
Advertisement
Table of Contents

Related Manuals for SOMNOmedics SOMNOwatch plus BP


Summary of Contents for SOMNOmedics SOMNOwatch plus BP
- Page 1 Caution: Federal law restricts this device to sale by or on the order of a physician. SOMNOmedics GmbH – Am Sonnenstuhl 63 – D-97236 Randersacker Phone.: (+49) 931 / 35 90 94-0 – Fax: (+49) 931 / 35 90 94-49...
- Page 2 SOMNOmedics GmbH – Am Sonnenstuhl 63 – D-97236 Randersacker Phone: (+49) 931 / 35 90 94 - 0 – Fax: (+49) 931 / 35 90 94 - 49 E-Mail: info@somnomedics.de - Internet: www.somnomedics.de Rev. 5 29.10.2019 All proper names marked with TM are protected copyright by SOMNOmedics.
-
Page 3: Table Of Contents
Index Introduction ............................ 6 About this instruction manual ..................... 6 Explanation of Symbols used in this Manual ................7 About the SOMNOwatch™ plus ....................7 Model and Device Number ......................7 Elements of keyboard ......................... 8 Configuration ..........................9 Safety instructions ........................10 Installing the DOMINO light Software .................. - Page 4 Menu – Area Definition ....................55 7.3.8 Menu – User Data ......................55 7.3.9 Menu – Report ......................... 56 7.3.10 7.3.10.1 Standard Report ...................... 56 7.3.10.2 User defined Report ....................57 Creating Tables ............................ 61 Editing of Text Fields ........................... 62 Using Items from the Standard Report in the Custom Report ..............
- Page 5 Cleaning and disinfection ......................89 Use and Maintenance of the Rechargeable Battery ..............90 10 Service ............................90 10.1 Technical specification ......................90 10.2 Lifetime ..........................91 10.3 Malfunctions ......................... 91 10.4 Storage ..........................91 10.5 Advice to the electromagnetic compatibility ................. 91 10.6 Warranty ..........................
-
Page 6: Introduction
1 Introduction The SOMNOmedics team would like to thank you for purchasing this product. We are confident that you will enjoy using the SOMNOwatch™ plus for many years. The SOMNOwatch™ plus has been developed by SOMNOmedics to meet the highest quality control standards available. -
Page 7: Explanation Of Symbols Used In This Manual
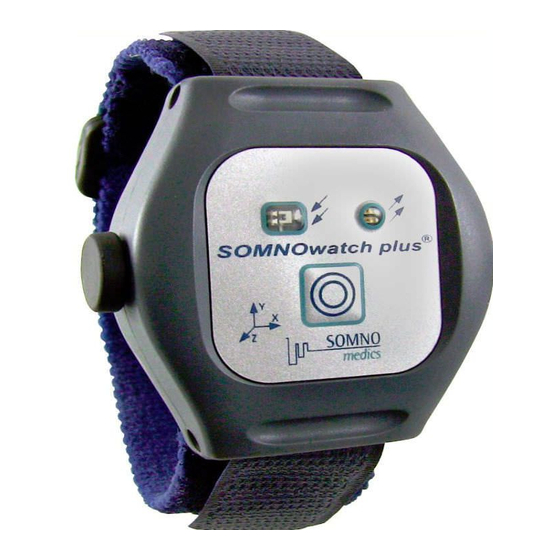
1.2 Explanation of Symbols used in this Manual Indicates a hint or tip. This Symbol provides assistance with possible problems when working with the SOMNOwatch™ plus. This Warning Symbol indicates potential danger to Patients, Property or Data Loss. 2 About the SOMNOwatch™ plus External Signal Light Sensor Status LED’s... -
Page 8: Elements Of Keyboard
IP54 that the SOMNOwatch™ plus is dust and splash proof. 2.2 Elements of keyboard Picture Description Function green LED yellow LED Idle Mode Waiting Mode flashes 1x /3s Recording Mode flashes 16x /s Initialisation / data transfer 2s on Error during initialisation + buzzer Recording with programmed sampling of external signal:... -
Page 9: Configuration
This sensor measuring the Light Sensor intensity of the ambient light. 2.3 Configuration The configuration includes a SOMNOwatch™ plus with BP Module, a belt, an SpO sensor, the Docking Station and Battery Charger, a USB adapter cable, a Carry Bag for housing the SOMNOwatch™... -
Page 10: Safety Instructions
Damaged parts must be replaced immediately. Please contact SOMNOmedics or your SOMNOmedics Distributor. Only sensors designed and supplied by SOMNOmedics may be used with this unit. All sensors are provided unsterile nor are they intended to be sterilized. This device is not to be used on broken skin. If this device comes in contact with broken skin/blood, do not reuse this device and discard. - Page 11 Opening the case, repairing or modifying the SOMNOwatch™ plus in any way will void the guarantee. Only SOMNOmedics and its authorised distributors may repair the unit. Always use the Docking Station (SOW106) to charge the internal battery. The body strap is made of material commonly used in clothing and non-medical watchbands, however if redness or swelling of the skin occurs where the band is in contact, please discontinue use immediately and consult your physician.
-
Page 12: Installing The Domino Light Software
4 Installing the DOMINO light Software Please note the System Requirements for running DOMINO light Software. Please also note that the Software must be activated by entering a Registration Code. You will find the file on the installation CD. Double click on this file to start the installation. Choose your language and click on button Weiter. - Page 13 Choose SomnoWatch Plus at Montage and click on the Next button. Start the installation process by clicking the Next button. The installation progress will be displayed by a running green bar. -13-...
- Page 14 When the installation is complete the software will ask if you want to install the USB driver for the Docking Station. If you choose to Install SOMNOmedics USB Driver now, the manual selection of the driver file location will not be required in Chapter 5.
- Page 15 Updating the Software To update your software version please install the new version in the same directory as the basic version. During the installation you will be asked to choose one of the following installation types. -15-...
- Page 16 After the installation of the update you have to confirm your registration ID in the global preferences. Confirm the Code in the Tab “folder” by clicking on “Save and Exit” -16-...
-
Page 17: Docking Station Driver Installation
5 Docking Station Driver Installation 5.1 WinXP The first time you connect the SOMNOwatch™ plus Docking Station to a USB-port the following window will occur: Click on Continue Anyway to start the installation of the driver. Please choose the option No, not this time and click on the Next button Click on Finish to complete the installation. -
Page 18: Operating Instructions
6 Operating Instructions Note: The SOMNOwatch™ plus automatically switches in idle mode when no measurement is running. The date and time of the PC system clock is transferred to the SOMNOwatch™ plus during initialisation. Therefore it is important to have preset the right date and time. - Page 19 Patient Data Input: ▪ Enter the data into the corresponding fields (see fig. 6-2). Type carefully as this information will be saved for later use. It is important to enter a Patient ID number. This number is used to store the Patient Data in the optional Patient Database.
- Page 20 Now select the blood pressure montage. The channels which will be recorded are defined here. fig. 6-4: Menu - Montage → Used to create a new montage → An existing montage may be saved with a different name after modification. Template: It is possible to change these analysis templates in the Global Settings.
- Page 21 Start options: Manual start (1) → Measurement is started manually by pressing the marker button quickly 6 times consecutively. start immediately (2)→ Type in the recording duration. The measurement will be started immediately after initialisation. Auto Start (3)→ This option is used when the patient uses the SOMNOwatch™...
-
Page 22: Attaching The Sensors
6.2 Attaching the Sensors a) Fit the SOMNOwatch™ plus and the BP Adaptor Unit to the belt. b) Connect the BP Adaptor Unit to the SOMNOwatch™ plus c) Clean and dry all skin areas carefully with Nuprep Paste and place the disposable ECG electrodes on the patient’s thorax -22-... - Page 23 d) Attach the SpO2 sensor to the finger of the right hand and connect the plug to the BP Adaptor Unit. Create a strain relief with adhesive tape for sensor cable. -23-...
-
Page 24: Manual Blood Pressure Measurement
6.3 Manual Blood Pressure Measurement Please note that the accuracy of the blood pressure depends from a valid calibration. Furthermore it is in the responsibility of the physician to assess the absolute blood pressure values. The prior attention of this method is the determination of the relative blood pressure changes caused by other sleep related events. -
Page 25: Data Transfer From Somnowatch™ Plus To Pc
6.4 Data Transfer from SOMNOwatch™ plus to PC Once there are one or more measurements on the SOMNOwatch™ plus, it is possible to transfer these with the DOMINO light software and the Docking Station. Please proceed as follows: Connect the SOMNOwatch™ plus to the Docking Station. Press the Marker Button Start the data transfer by clicking the Transfer icon on the DOMINO light Panel. -
Page 26: Open A Recorded Measurement
6.5 Open a Recorded Measurement To open a recording, click on the Analysis symbol of the DOMINO light panel. The following window will open (fig. 6-6): Click on Name or Start to sort measurements alphabetically or chronologically Processing Status Saved measurements Search Options... - Page 27 If you open a measurement, which has not previously been analysed, the Preferences Window will open. Please choose the blood pressure template at the tab Analysis. The measurement is automatically analysed according to the predefined parameters in the Global Preferences (see Chapter 7.3.3).
-
Page 28: Analysis
6.6 Analysis Blood Pressure Calibration: Right click on the raw data next to the patient marker (set during the manual Blood Pressure Measurement → chapter 6.3) and Select “BP calibration”. Enter the Blood Pressure values, and confirm with . The Systolic and Diastolic Blood Pressure will be calculated and displayed in the Analysis Window. -
Page 29: Open The Report
6.7 Open the Report Open the Report Selection by clicking on “Report...“ in the “Report“ menu. Select the blood pressure template and click on the View Button. Note: Only events during TIB will be evaluated in the report. User Data / Patient Data It is possible to edit this data by clicking on Patient Info in the Report Preview window. - Page 30 Sleep Report Total Sleep Time (TST) Period of time between the Lights off and Lights on markers (in h) excluding all the Wake stages. TotalSleep Time Sleep Efficiency TotalSleep Time Sustained sleep efficiency − (in %) SleepLaten Period of time between the Lights off marker and the beginning of Sleep Latency sleep.
- Page 31 Report Number of Desaturations Number of Desaturations during TST (index: per hour of sleep). Minimal SpO2 (%) Indication of minimum SpO value during TST. Average value of the SpO curve without considering the Baseline SpO2 Saturation events. Average SpO2 Average value of the complete SpO curve.
-
Page 32: Pulse Transit Time
Pulse Transit Time The diagram indicates the sleep fragmentation of a patient’s sleep caused by PTT changes. It shows the patient Disturbed and Undisturbed sleep. Disturbed: Sleep fragmentation mainly in the intervals 0-1 min and 1-5 min Undisturbed: sleep fragmentation mainly in the intervals 10-30 min, >30 min Percentage of Undisturbed Sleep Intervals (PTT) The bars show the percentage of Sleep that was disturbed... - Page 33 Heart Rate Report Number of Increases in the Heart Rate during TST (index: per hour Acc. (Index) of sleep). Number of Decreases in the Heart Rate during TST (index: per h of Dec. (Index) sleep). Arrhythmia (Index) Number of Arrhythmia occurring during TST (index: per h of sleep). Maximum Heart Rate during TST with indication of the moment of Maximum HR (bpm) the event.
- Page 34 Systolic Blood Pressure Number of all Increases of the Systolic Blood Pressure during TST Inc. (Index) (index: per hour of sleep). Maximum Increases of the Systolic Blood Pressure and indication of Maximal Increase (mm Hg) the exact moment. Average Increase (mm Hg) Average value of all Increases of the Systolic Blood Pressure.
- Page 35 Advanced Blood Pressure Report In order to correlate our Blood Pressure Reports to conventional 24-hour Blood Pressure Recording devices, we have included the “Blood Pressure Day/Night (advanced)” report in the PTT report selection item. In this report the percentage of recording time that the Blood Pressure, MAP or Pulse exceeds a defined value is displayed in the column “>...
- Page 36 To edit the limits for the calculation of the Pulse, select “Heart Rate Analysis” or “Heart Rate Analysis AASM” from the “Analysis” tab of the “Global Preferences”. Select the button “Limit Tachycardia” to open the window for editing the Pulse Rate limits. -36-...
- Page 37 To have an overview of the respective limits set by the user, the defined values will be displayed in the footer of the Blood pressure Day/Night (advanced) report. The limits of the blood pressure-report of course also can be defined within the local “Preferences” of the respective measurement.
- Page 38 It is possible to enter this information by clicking on Patient Info button. Choose the tab Diagnose in the Info Data window. Click OK button after you have filled in the information. Graphics Here you can choose if you want to display the complete recording or just the TIB in the graphic.
- Page 39 In the tilting table report a graphic overview of Systolic, Diastolic and Mean Arterial Pressure related to the recording time is displayed. Additionally the values of Blood Pressure, Pulse and SpO2 are indicated in table format for every one minute interval. -39-...
-
Page 40: Domino Light Software
New releases of the DOMINO light Software are issued once or twice a year, as a result of our continued commitment to improving the system. These manuals are available free of charge for SOMNOmedics customers. The DOMINO light Software is intended for use exclusively with the SOMNOwatch™ plus. -
Page 41: Domino Light Panel
Before starting to use the Analysis Section of the software, it is necessary to activate it with a Registration Code. Please contact SOMNOmedics by fax, e-mail or telephone to obtain this. Please refer to fig. 7-2 for instructions on how to obtain and enter the Registration Code. -
Page 42: Global Preferences
Preferences will be saved to a file. Computer-ID – phone SOMNOmedics support. Quote this number and you will be given the Registration Code to enter here. fig. 7-2: Global Preferences – Menu - Folders The default folder can be chosen from the Recordings Directory using the symbol. -
Page 43: Menu - Channels
Menu – Channels 7.3.2 In the Channels Menu the characteristics of the Raw Data Signal can be adjusted. Colour, Signal Scaling, Signal Direction and Channel Order can all be configured. The Channel Order can be changed by using the Drag & Drop function. Auto size of Limit values for Signal signals... -
Page 44: Menu - Analysis
Menu – Analysis 7.3.3 In this menu, all variables of the built-in algorithms can be changed. It is also possible to set the display colour for each analysis trace and set the colour of the classification box for each event. See red box marked on fig. - Page 45 1) Ø Activity Threshold (Units) You can define the limit (threshold) a signal must exceed in relation to the baseline to be detected as activity. If activity above threshold is detected during an epoch, the epoch will be rated as WAKE. fig.
-
Page 46: Activity Analysis
7.3.3.2 Activity Analysis fig. 7-7: Activity Analysis Time-frame [s] Size of the Analysis-Timeframe in detection of Activity. Max. value: Activity is equal to the maximal value within the timeframe. Average value: Activity is equal to the value composed of the average value within the timeframe. -
Page 47: Heart Rate Analysis
7.3.3.3 Heart Rate Analysis fig. 7-8: Heart Rate Analysis 1) " Artefact variation [bpm]" This is the maximum difference of consecutive heart frequencies. If the change of the heart frequency is bigger than the previous value, an artefact is recognized. 2) "... - Page 48 7) " Min. beats count“ For a Tachycardia or Bradycardia to be determined, the event must have at least the entered number of heart beats. According to the following criteria, Tachycardias with wide and narrow QRS complexes are determined: 1) "Tachycardia [bpm] “ If the determined heart frequency is bigger than the registered value, a tachycardia is recognized.
-
Page 49: Position Analysis
7.3.3.4 Position Analysis fig. 7-9: Position Analysis Analysis Window [s] The size of the time window, in which the dominant body position is determined. It is possible to change the classification of body position dependent on the attachment of the SOMNOwatch™... -
Page 50: Pleth Analyis
7-13: Determining PTT SOMNOmedics has developed an algorithm to calculate the blood pressure based on the PTT. Therefore it is necessary to do a one point calibration by taking the patients’ Blood Pressure during the measurement with an external blood pressure meter. Follow the steps in chapter 6.6 to calibrate the blood pressure. - Page 51 fig. 7-14: PTT Analysis 1) Min./Max. PTT [ms] If the PTT curve exceeds the maximum or falls below minimum level, an artefact will be detected. Adjust both values to each individual patient (child, adult) and to the measurement site (finger, toe). max.
- Page 52 fig. 7-16: Blood Pressure Analysis 5) Max. Blood press. [mmHg] Blood Pressure values above this threshold will be detected as artefact. 6) Reference press. [mmHg] This value is used to calculate the nocturnal Blood Pressure lowering in the report. If no value is set, the software will calculate the average Blood Pressure during the first three minutes of Time-In-Bed.
-
Page 53: Menu - Analysis Channels
7.3.4 Menu - Analysis Channels Within the Menu Analysis Channels the presentation of the analysis window can be formatted. The Channel Order can be changed by using the Drag & Drop function. Full Chart: Upon activating this option the respective curve will be displayed in full chart mode. -
Page 54: Menu - Keys
7.3.6 Menu - Keys The Keys menu allows you set the keyboard keys to be used during manual editing. Define and add events: Within the Keys Menu, predefined events can be associated to the programmed keys. These defined keys are available in the Edit mode of the Raw Data display to name of edit, add or delete events. -
Page 55: Menu - Area Definition
Menu – Area Definition 7.3.8 It is possible to define own area definitions in the Analysis window. The detected events within the defined areas will be shown itemised in the report. The default areas shown in fig. 7-21 are predefined at programme installation. Adding areas: Enter the name of the area in the field and click the button “Add Area”. -
Page 56: Menu - Report
7.3.10 Menu – Report 7.3.10.1 Standard Report In the Reports Menu, it is possible to configure Standard Report Templates to your specific needs. You can set the contents, the format and the order of the report items. As many reports as are required can be created by clicking on the symbol A template may be renamed by clicking on the symbol... -
Page 57: User Defined Report
7.3.10.2 User defined Report Click on Symbol (1) to create a User defined Report. Abb. 7-1: Create User Defined Report Type in the name for the report template and click on the symbol (2) on the right side. Now choose if the draft should be displayed in portrait or landscape format. At the top of the draft you will find the following symbols: Abb. - Page 58 Functions in the Label Editor: Here the background-colour of the label can be selected. A certain type and seize of font can be selected. Selection of alignment (left, centred, right). Selection: background transparent. If activated the text will be wrapped automatically at the end of each line. The label can be rotated in pre-defined steps.
- Page 59 Adds an Analysis Channel to the report, displayed over complete night or only during TIB. Abb. 7-5: Analysis Channels selection Additional functions: full → short → Should be Channel Labelling only legend → without → Activates/Deactivates the timeline. The graphic can be rotated in pre-defined steps. Select if the analysis channel(s) are displayed showing the whole night, or only during TIB.
- Page 60 A new page can be added or an existing page can be deleted by right clicking on the Page tab. It is also possible to change the orientation of the page. Abb. 7-6: Tab functions By Right clicking on an object, the following selection menu will appear: Abb.
-
Page 61: Creating Tables
Creating Tables The function “Add table” provides the possibility to display analysis results in a table in the report. Tables can only be generated in the Custom Report. To start the Custom Report Designer, open the “Report” tab in the “Global Preferences” and then click the button “New Custom Template”. After defining a name for the new Custom Template, generate or edit the new custom report using the “Edit”... -
Page 62: Editing Of Text Fields
After confirming with OK, define the position of the table inside the report by clicking on the start position where you want the table to appear. Editing of Text Fields In order to write into text fields, the corresponding text field just must be activated by selecting it with the mouse cursor. - Page 63 Now, select the Preview Button and click on the item “Use as new custom template” (upper right of menu bar) to transfer the selected items to the Custom Template. After transferring the Standard Report items, the generated Custom Template can be modified and edited.
-
Page 64: Analysis
7.4 Analysis 7.4.1 Setting Analysis and Channels The Analysis Channels parameters can be set in the Global Preferences menu (see chapter 7.3.4) or they can be set directly in the current display. Double-click on the corresponding channel name in either the Analysis or Raw Data Window. All settings made in a specific patients recording will only be changed for that recording. -
Page 65: Functions Of The Pop-Up Window
7.4.2 Functions of the Pop-up Window To open pop-up windows use the right mouse button and click on either the Analysis or Raw Data Window. 7.4.2.1 Functions of the Analysis Pop-up Window fig. 7-26: Pop-up Window Analysis (1) Select channel… offers a comfortable method to manually select analysis channels to be displayed. - Page 66 (8) Show in bottom chart will display all correlating Raw Data for the section selected in the bottom chart. (9) Save Sample will save the marked area for addition to the reports. (see chapter 7.4.6) (10) Define area as … offers the possibility to define the marked period e.g. as jogging. The detected events within these defined areas will be shown in the report.
-
Page 67: Function Of The Raw Data Pop-Up Window
7.4.2.2 Function of the Raw Data Pop-up Window fig. 7-28: Pop-up Window Raw Data (1) Select channel… offers a comfortable method to manually select analysis channels to be displayed. Select all channels Delete all channels Invert selection All Raw Data channels will have the same height fig. - Page 68 Marking a section in the Raw Data window opens up the following additional functions: (11) Zoom Selection will display the marked area over the complete Raw Data window. (12) Save Sample will save the marked area for addition to the reports. (see chapter 7.4.6). -68-...
-
Page 69: Layouts For Data Display In Analysis Mode
7.4.3 Layouts for Data Display in Analysis Mode Several different display layouts are selectable for efficient data processing by clicking on tab View: A) The Analysis mode displays the Analysis curves only. B) The Raw Data mode displays the Raw Data curves only. C) The Standard mode splits the screen and displays both the Analysis window on the top and the Raw Data in the bottom window. -
Page 70: Creating And Editing Samples
7.4.6 Creating and Editing Samples It is possible to select and save Interesting Events from both the Raw Data and the Analysis Data. These Samples will be saved and can be added to the Reports. Samples are automatically stored in the Optional Data Base. -
Page 71: The Event List
7.4.7 The Event List You can open an event list by clicking Show analysis events in the Tools menu. fig. 7-33: Event List Choose e.g. the PTT Analysis to get a list with all the systolic blood pressure events. Double-Click on an event to jump directly to the corresponding position in the raw data window. →... -
Page 72: Edit Modes
7.4.8 Edit Modes It is possible to edit Events manually. Attention: The Automatic Analysis does not change any Manually Edited Events. Four techniques are provided for Manually editing Events in the Raw Data: Edit Mode, Quick Edit Mode, Select Edit Mode and the Repeat Mode. Select the required method from the Mode menu. Please note: The Time Base of the Raw Data cannot, as default, be changed while in Editing mode. -
Page 73: Quick Edit Mode
7.4.8.2 Quick Edit Mode The Quick Edit Mode allows an event to be marked without using the keyboard. For example, to mark a Desaturation, define the Event Source in the Keys menu in Global Preferences or, with an open study, in Tools → Preferences. (Set the Desaturation Event Source to the SpO2 Signal for example) and then drag the cursor over the event to be marked. -
Page 74: Reports
Reports There are Two ways to generate a report in the DOMINO light software: 1. Using the DOMINO light Report Generator (Standard or User Defined Report). 2. Exporting the entire result list to MS Excel. 7.5.1 Reports using the DOMINO light Report Generator Click on Report…... -
Page 75: Form Letters
7.6 Form Letters The DOMINO light Software incorporates the facility to generate Form Letters. These Form Letters can be used to send Diagnostic information to Referring Physicians, Healthcare Workers, Insurance Companies and the Patients. 7.6.1 Creating a Form letter To create a new Form Letter, first open the required Patients Study. Select Create New Form Letter from the Report menu. -
Page 76: Opening A Form Letter
7.6.2 Opening a Form Letter To create a new Form Letter, first open the required Patients Study. Now select Open Form Letter from the Reports menu. Double-click on the required Form Letter and it will be opened in MS Word automatically. -
Page 77: Data Exchange
7.7 Data Exchange 7.7.1 Data Export as Picture, in RIFF or ASCII Format Analysis and Raw data can be exported As a Picture (BMP or JPEG format) or As Data (RIFF or ASCII format) via the menu File → Export Analyses Data or Export Raw Data. 7.7.2 EDF+ Export EDF+ Export and EDF Import make it possible to exchange data between different Sleep Labs... - Page 78 = There is no EDF+ name assigned to the channel. = There is an EDF+ name assigned to the channel from the translation Save As Template table. Delete Template = An EDF+ name was manually assigned to the channel. fig. 7-38: EDF Export Channels In the upper section of the window, Patient Name, Date of Birth, Starting Time of Recording as well as the Number of Channels to be exported will be displayed.
- Page 79 A click on the Translate Table button opens the following window: fig. 7-40: EDF+ Translation Table Click on the button Add to add a new channel to the translation table. To enter the EDF+ Label or the Transducer Type it is necessary to double-click in one of the fields next to the Channel name.
-
Page 80: Archiving
7.8 Archiving SOMNOmedics recommends archiving all successfully analysed recordings on a regular basis. We also recommend deleting the records from your hard drive once the data is archived. This process should be done regularly to ensure that there is sufficient storage space on the hard drive and that the data is protected from any damage. -
Page 81: Archiving Database
Archives, Form Letters and SOMNODB (Default Location: C:\SOMNOmedics\Somnowatch). Now select the files and copy them to a local directory (for example, C:\Backup\...). Save this directory to a CD using the CD burning programme that was supplied with your CD drive. -
Page 82: Patient Database (Option)
In order to use the Database, a registration code is required. Please contact SOMNOmedics Support to obtain this code. Please contact SOMNOmedics by fax, e-mail or telephone to obtain this. Please refer to fig. 7-43 for instructions on how to obtain and enter the Registration Code. -
Page 83: Search Function
7.9.2 Search Function This function allows you to search for specific patients or specific recordings. To activate the search function, select Search in the main menu. Possible search criteria are e.g. Last Name, First Name, Sex and Age. It is also possible to sort the information according to the Column Headings. Double click on the Column Heading required to sort in either Ascending or Descending order. - Page 84 Adding trend function Within the History Menu, it is possible to produce a trend display of multiple recordings from one patient. Define a Template which includes all the required measurement results. Use the menu Tools → Result templates. The following window will open: Name of the default Template Create...
- Page 85 Click on Tools→Results to display all results that were selected in the default template. To add results to the list click on Tools→Select Results and use Drag & Drop. The Sleep Stages of the measurements (select Compare Sleep Stages… in the main menu) as well as the Trend of specific values (select Trend→Create Trend Display) can be displayed.
-
Page 86: Menu - Recording
Menu – Recording 7.9.4 Click on this button to display the Report Display of the Patients’ Sleep Profile Display of the Results fig. 7-47: Menu - Recording This menu displays the Sleep Profile for a selected Patient as well as all Analysed Results and all edited entries including Anamnesis, Findings, Diagnosis and Comments. -
Page 87: Menu - Summary Picture
7.9.5 Menu - Summary Picture fig. 7-48: Menu - Summary Picture This Menu shows the Summary Graphics from the Patients’ Analyses Curves. -87-... -
Page 88: Troubleshooting
Possible Reason What to do? Analysis Unable to start Registration code Contact SOMNOmedics Support and request the Analysis. not entered. registration code. Enter the registration code into the Global Preferences in the Folders menu. After entering the code, click on the Save and Exit button. -
Page 89: Maintenance Of Somnowatch™ Plus
9 Maintenance of SOMNOwatch™ plus 9.1 Maintenance rate Return the SOMNOwatch™ plus to SOMNOmedics after 3 years of usage for inspection. The inspection includes Calibration of all the Recording Channels and visual inspection for any external damage. 9.2 Cleaning and disinfection Regularly clean the device to ensure trouble free operation. - Page 90 After cleaning disinfection procedures housing SOMNOwatch™ plus must be checked for outer integrity and clear readability of all indications and displays. Use and Maintenance of the Rechargeable Battery The internal battery is a Lithium-Ion (Li ION) rechargeable battery. The battery offers a long life (approximately 500 charges), is not susceptible to memory effects and is ecologically friendly.
- Page 91 The device is not working correctly (poor measurements) Components are loose or fit poorly Connectors are damaged (crushed or cut cables) Please contact your local distributor for a fast response or contact SOMNOmedics for a fast and efficient response. Please see chapter 10.9. 10.4 Storage Keep the SOMNOwatch™...
- Page 92 +49 (0) 9 31 / 35 90 94 49 We also provide service and support via e-mail on: service@somnomedics.de Unfortunately it is sometimes possible that our hotline may be busy when you call and you will be redirected to our mailbox. When this happens, please leave your name and telephone number so that we can call you back promptly.
- Page 93 10.10 Notes -93-...
Need help?
Do you have a question about the SOMNOwatch plus BP and is the answer not in the manual?
Questions and answers