Table of Contents
Advertisement
Advertisement
Table of Contents

Related Manuals for R&S ZNA Series


Summary of Contents for R&S ZNA Series
- Page 1 ® R&S Vector Network Analyzers Getting Started (;ÜÎÆ2) 1178645602...
- Page 2 ® This manual describes the following R&S ZNA vector network analyzer models: ● ® R&S ZNA26, 10 MHz to 26.5 GHz, 2 test ports, 3.5 mm (m) connectors, order no. 1332.4500.22 ● ® R&S ZNA26, 10 MHz to 26.5 GHz, 4 test ports, 3.5 mm (m) connectors, order no. 1332.4500.24 ●...
-
Page 3: Table Of Contents
® Contents R&S Contents 1 Safety Information..................7 2 Preface....................8 Documentation Overview..................... 8 2.1.1 Getting Started Manual....................8 2.1.2 User Manual and Help....................8 2.1.3 Service Manual....................... 8 2.1.4 Instrument Security Procedures..................9 2.1.5 Basic Safety Instructions....................9 2.1.6 Data Sheets and Brochures.................... 9 2.1.7 Release Notes and Open Source Acknowledgment (OSA).......... - Page 4 ® Contents R&S 3.10 Minimizing the VNA Application................18 4 Instrument Tour..................20 Front Panel........................20 4.1.1 Touchscreen........................21 4.1.2 Standby Key........................23 4.1.3 Front Panel Connectors....................24 Rear Panel........................26 5 Operating the Instrument..............29 Manual Operation .......................29 Control Elements of the Application Window............33 5.2.1 Title Bar.........................
- Page 5 ® Contents R&S 5.7.4 Auto Scale........................52 5.7.5 Circular Diagrams......................53 5.7.6 Set by Marker........................53 5.7.7 Enlarging a Diagram..................... 54 6 Performing Measurements..............56 Transmission S-Parameter Measurement..............56 6.1.1 Connecting the Instrument for Transmission Measurements........56 6.1.2 Selecting the Sweep Range and Other Parameters............. 57 6.1.3 Calibrating the Instrument.....................
- Page 6 ® Contents R&S Getting Started 1178.6456.02 ─ 05...
-
Page 7: Safety Information
® Safety Information R&S 1 Safety Information The product documentation helps you to use the R&S ZNA safely and efficiently. Fol- low the instructions provided here and in the printed "Basic Safety Instructions". Keep the product documentation nearby and offer it to other users. Intended use The R&S ZNA is designated for the development, production and verification of elec- tronic components and devices in industrial, administrative, and laboratory environ-... -
Page 8: Preface
® Preface R&S Documentation Overview 2 Preface This chapter provides safety-related information, an overview of the user documenta- tion and the conventions used in the documentation. 2.1 Documentation Overview This section provides an overview of the R&S ZNA user documentation. Unless speci- fied otherwise, you find the documents on the R&S ZNA product page at: https://www.rohde-schwarz.com/manual/ZNA 2.1.1 Getting Started Manual... -
Page 9: Instrument Security Procedures
® Preface R&S Conventions Used in the Documentation 2.1.4 Instrument Security Procedures Deals with security issues when working with the R&S ZNA in secure areas. It is avail- able for download on the Internet. 2.1.5 Basic Safety Instructions Contains safety instructions, operating conditions and further important information. The printed document is delivered with the instrument. -
Page 10: Conventions For Procedure Descriptions
® Preface R&S Conventions Used in the Documentation Convention Description [Keys] Key and knob names are enclosed by square brackets. This also applies to the virtual keys in the control window of the R&S ZNA. "Graphical user interface ele- All names of graphical user interface elements on the screen, such as ments"... -
Page 11: Putting The Analyzer Into Operation
® Putting the Analyzer into Operation R&S Unpacking and Checking the Instrument 3 Putting the Analyzer into Operation This section describes the basic steps to be taken when setting up the analyzer for the first time. Simple measurement examples are provided in Chapter 6, "Performing Measure- ments", on page 56;... -
Page 12: Positioning The Instrument
® Putting the Analyzer into Operation R&S Bench Top Operation Packing material Retain the original packing material. If the instrument needs to be transported or ship- ped later, you can use the material to protect the control elements and connectors. Risk of injury during transportation The carrying handles at the front and side of the casing are designed to lift or carry the instrument. -
Page 13: Operation In A 19" Rack
® Putting the Analyzer into Operation R&S EMI Suppression Risk of injury if feet are folded out The feet can fold in if they are not folded out completely or if the instrument is shifted. Collapsing feet can cause injury or damage the instrument. ●... -
Page 14: Connecting The Analyzer To The Ac Supply
® Putting the Analyzer into Operation R&S Starting the Analyzer and Shutting Down Table 3-1: Cable Requirements Cable Type (Connector) Requirement RF cables (PORT 1, ..., PORT N) Double shielded BNC cables (various) Double shielded DB-25 (User Port) Double shielded Digital I/Q (External Handler IO, External Data Log- R&S order no. -
Page 15: Standby And Ready State
® Putting the Analyzer into Operation R&S Standby and Ready State 2. If necessary, press the standby toggle key on the front panel to switch the instru- ment to ready state. ® The instrument automatically performs a system check, boots the Windows oper- ating system and then starts the vector network analyzer (VNA) application. -
Page 16: Connecting External Accessories
® Putting the Analyzer into Operation R&S Connecting External Accessories 3.9 Connecting External Accessories The analyzer's standard PC interfaces (Monitor, USB, LAN) can be used to connect various accessories: ● An external monitor displays the Windows ® desktop plus the Vector Network Ana- lyzer (VNA) application windows. -
Page 17: Connecting A Mouse
® Putting the Analyzer into Operation R&S Connecting External Accessories ® To access Windows , use the button in the toolbar of the application window. 3.9.3 Connecting a Mouse A USB mouse can be connected to any of the USB connectors. After being auto-detec- ted by the operating system, it can safely be disconnected and reconnected even dur- ing measurements. -
Page 18: Connecting A Lan Cable
® Putting the Analyzer into Operation R&S Minimizing the VNA Application Printer configuration Use the "Printer Setup" dialog of the firmware (System – [File Print] > "Print" > ® "Print...") or the Windows printer management to configure the printer properties and printing preferences. - Page 19 ® Putting the Analyzer into Operation R&S Minimizing the VNA Application A software update restores the original shortcut properties. Getting Started 1178.6456.02 ─ 05...
-
Page 20: Instrument Tour
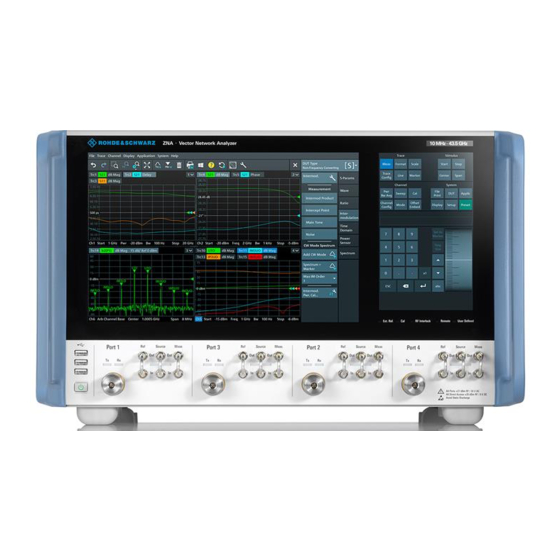
® Instrument Tour R&S Front Panel 4 Instrument Tour This chapter gives an overview of the control elements and connectors of the R&S ZNA and gives all information that is necessary to put the instrument into opera- tion and connect external devices. 4.1 Front Panel The front panel of a R&S ZNA consists of a large-scale capacitive touchscreen and the test port area below it. -
Page 21: Touchscreen
® Instrument Tour R&S Front Panel 4.1.1 Touchscreen The touchscreen is split into two parts: the application window with diagrams and soft- tools on the left, and the control window with its (virtual) function keys and data entry controls on the right. User interaction is touch-only, i.e. all hardkeys commonly used in Rohde &... - Page 22 ® Instrument Tour R&S Front Panel ● Refer to the description of the "Display" softtool (System – [Display]) in the user manual or help system to learn how to customize the screen. 4.1.1.2 Control Window: Function Keys Most of the (virtual) keys in the upper part of the control window call up a related soft- tool of the analyzer GUI.
-
Page 23: Standby Key
® Instrument Tour R&S Front Panel – Choose the measurements to be performed on a selected DUT. The analyzer fimware then helps you to set up the channel(s) accordingly. ● [Applic]: external software tools and optional extensions of the analyzer firmware. ●... -
Page 24: Front Panel Connectors
® Instrument Tour R&S Front Panel The standby toggle switch is located in the bottom left corner of the front panel. The key serves two main purposes: ● Toggle between standby and ready state; see Chapter 3.8, "Standby and Ready State", on page 15. - Page 25 ® Instrument Tour R&S Front Panel Hardware options R&S ZNA<frequency>-B16 "Direct Generator/Receiver Access", provide 3 pairs of SMA connectors for each test port, where <frequency> corresponds to the network analyzer type. For detailed ordering information, refer to the product brochure. These connectors give direct access to the RF input and output signal paths.
-
Page 26: Rear Panel
® Instrument Tour R&S Rear Panel 4.2 Rear Panel This section gives an overview of the rear panel elements of the network analyzer. Table 4-1: Rear panel elements available on all instruments Index Label Description System Drive Removable system drive of the R&S ZNA, containing all software (including the operating system and the VNA application) and data. - Page 27 ® Instrument Tour R&S Rear Panel Index Label Description GPIB IEEE 488 GPIB bus connector according to standard IEEE 488 / IEC 625. External Handler IO Used to connect an external Handler I/O (option R&S ZNBT-Z14), providing a Centronics 36 input/output connector. Not yet supported.
- Page 28 ® Instrument Tour R&S Rear Panel Index Label Description RFFE GPIO Option R&S ZNA-B15 provides 2 independent RF Front-End (RFFE) interfaces and 10 General Purpose Input/Output (GPIO) pins on a single connector (25 pins, female). The RFFE interfaces meet the MIPI® Alliance "System Power Management Interface Specifi- cation".
-
Page 29: Operating The Instrument
® Operating the Instrument R&S Manual Operation 5 Operating the Instrument The following sections describe the basics of manual operation, i.e. how to access instrument functions and settings via the analyzer GUI. Manual operation is particularly useful for getting to know the instrument and for trouble shooting. Manual and remote control of the instrument Manual control of the R&S ZNA is possible either via its touchscreen (without using a mouse and/or keyboard), via locally connected monitor + mouse + keyboard (see... - Page 30 ® Operating the Instrument R&S Manual Operation Customizing the screen The contents of the screen and the size and position of many display and control ele- ments are not fixed. You can display or hide most elements. You can also drag and drop traces and info fields.
- Page 31 ® Operating the Instrument R&S Manual Operation 4. Select a control element, e.g. "a1 Src Port 1". The diagram immediately reflects your selection. The active trace shows the mea- surement results for the selected measured quantity. A control element with three dots (e.g. System – [Setup] > "Setup" > "System Con- fig...") opens a dialog, containing a group of related settings, a wizard or additional information.
- Page 32 ® Operating the Instrument R&S Manual Operation Using the menu bar The menu bar at the bottom of the application screen provides alternative access to all instrument functions. To repeat the measured quantity selection described above, ► Select Trace – [Meas] > "Non-Frequency Converting" > "Wave" > "a1 Src Port 1". The diagram immediately reflects your selection.
-
Page 33: Control Elements Of The Application Window
® Operating the Instrument R&S Control Elements of the Application Window 5.2 Control Elements of the Application Window The application window of the analyzer provides all control elements for the measure- ments and contains the diagrams for the results. There are several alternative ways for accessing an instrument function: ●... -
Page 34: Toolbar
® Operating the Instrument R&S Control Elements of the Application Window 5.2.2 Toolbar The toolbar above the diagram area contains the most frequently used control ele- ments of the user interface. All controls are also accessible via Softtools. The toolbar is divided into six icon groups, separated by vertical lines. These icons represent the Undo and Redo actions that are also available via the menu bar items "System"... -
Page 35: Softtools
® Operating the Instrument R&S Control Elements of the Application Window 5.2.3 Softtools Softtools display groups of related settings as a tabbed panel. They can be opened via function keys, or via menu bar and context menu items. Figure 5-2: Scale softtool A softtool is a tabbed panel with a close icon. -
Page 36: Menu Structure
® Operating the Instrument R&S Control Elements of the Application Window ● The "Trace" menu provides all trace settings, the limit check settings, and the marker functions including marker search. ● The "Channel" menu provides all channel settings and activates, modifies or stores different channels. -
Page 37: Hardkey Panel
® Operating the Instrument R&S Control Elements of the Application Window ● A menu command with no arrow or dots initiates an immediate action. Example: "Max" sets the active marker to the maximum of the active trace. 5.2.6 Hardkey Panel The (virtual) "Hard Key"... -
Page 38: Status Bar
® Operating the Instrument R&S Touchscreen Gestures 5.2.7 Status Bar The status bar shows ● the current channel's sweep averaging counter (e.g. "Ch<i>: Avg 9/10"), or "Ch<i>: Avg None" if averaging is disabled ● the active channel ● the progress of the sweep The progress bar also shows when the R&S ZNA prepares a sweep with new channel settings ●... - Page 39 ® Operating the Instrument R&S Touchscreen Gestures Figure 5-4: Tapping Double-tapping Tap the screen twice, in quick succession. Double-tap a diagram to maximize it or to restore its original size.. Dragging Move your finger from one position to another on the display, keeping your finger on the display the whole time.
- Page 40 ® Operating the Instrument R&S Touchscreen Gestures Figure 5-6: Pinching While "Zoom Select" is active (toolbar icon or softtool button is toggled on), spread- ing and pinching is disabled. You can only select a rectangular area (using one fin- ger) then. ●...
-
Page 41: Working With Dialogs
® Operating the Instrument R&S Working with Dialogs 5.4 Working with Dialogs Dialogs provide groups of related settings and allow to make selections and enter data in an organized way. The settings are visualized, if possible. An example is shown below. -
Page 42: Handling Diagrams, Traces, And Markers
® Operating the Instrument R&S Handling Diagrams, Traces, and Markers 5.5 Handling Diagrams, Traces, and Markers The analyzer displays measurement results as traces in rectangular diagrams. Markers are used to read specific numerical values and to search for points or regions on a trace. - Page 43 ® Operating the Instrument R&S Handling Diagrams, Traces, and Markers 3. In the dialog box that is opened when you release the "New Trace" icon, select the S-parameter to be measured. For a four-port analyzer: The R&S ZNA generates a new trace for the selected S-parameter. Alternative control elements To measure a different quantity, select Trace –...
-
Page 44: Adding New Markers
® Operating the Instrument R&S Handling Diagrams, Traces, and Markers 5.5.2 Adding New Markers A marker is needed, for instance, to read a particular numerical trace value. To add a new marker: ● Drag and drop the "New Marker" icon from the toolbar to the desired position in the target diagram. -
Page 45: Using Drag And Drop
® Operating the Instrument R&S Handling Diagrams, Traces, and Markers To delete a set of markers, drag and drop their marker info field onto the "Delete" icon. Deleting a marker and its info field also disables the associated marker function. ●... -
Page 46: Entering Data
® Operating the Instrument R&S Entering Data Screen element Action Drag and drop... Delete Marker or marker info field --> "Delete" icon; see Chapter 5.5.3, "Deleting Display Elements", on page 44 Marker info field Chapter 5.5.2, "Adding New Markers", on page 44 Move within diagram Marker info field (move to one of several pre-defined positions) Delete... -
Page 47: Using The Numeric Editor
® Operating the Instrument R&S Entering Data 5.6.2 Using the Numeric Editor The "Numeric Editor" is a tool for convenient entry and modification of numeric values. It is available for all numeric input fields in the analyzer GUI. The numeric editor is particularly useful in single-window mode. In dual-window mode, a suitable editor is automatically displayed: whenever an editable value is selected in the main window or a dialog, the data entry part of the control window is adjusted accordingly. -
Page 48: Using The Analyzer's On-Screen Keyboard
® Operating the Instrument R&S Entering Data 5.6.3 Using the Analyzer's On-Screen Keyboard The on-screen "Keyboard" allows you to enter characters, in particular letters, without an external keyboard. It is available for all text input fields in the analyzer GUI. The on-screen keyboard is particularly useful in single-window mode. -
Page 49: Scaling Diagrams
® Operating the Instrument R&S Scaling Diagrams Figure 5-7: Windows 10 on-screen keyboard To call up the on-screen keyboard: 1. Open the System – [Applic] softtool. 2. Select "External Tools" 3. Select "Screen Keyboard". 5.7 Scaling Diagrams The analyzer provides various tools for customizing the diagrams and for setting the sweep range. - Page 50 ® Operating the Instrument R&S Scaling Diagrams ● Select the "Zoom Select" toggle button in the toolbar above the diagram area. The icon changes its background color from black to blue. ● In the active diagram area, select an appropriate rectangular area. The zoomed view shows the selected rectangle, scaled in both horizontal and verti- cal direction.
-
Page 51: Setting The Sweep Range
® Operating the Instrument R&S Scaling Diagrams Alternative settings ● The Trace – [Scale] > "Zoom" softtool tab allows you to define the displayed zoom range numerically. It can also be opened from the menu of the "Zoom Config" toolbar icon. ●... -
Page 52: Reference Value And Position
® Operating the Instrument R&S Scaling Diagrams To change the sweep range of the active channel, use one of the following methods: ● Use the [Start], [Stop], [Center], and [Span] function keys from the Stimulus sec- tion. ● Double-tap (with a mouse: double-click) the "Start" or "Stop" label in the channel list. -
Page 53: Circular Diagrams
® Operating the Instrument R&S Scaling Diagrams ● Select "Auto Scale Trace" or "Auto Scale Diagram" from the "Trace" > "Scale" menu. 5.7.5 Circular Diagrams The radial scale of a circular diagram ("Polar", "Smith" or "Inverted Smith") can be changed with a single linear parameter, the "Ref Value". The reference value defines the radius of the outer circumference. -
Page 54: Enlarging A Diagram
® Operating the Instrument R&S Scaling Diagrams Set "Start" and "Stop" values in the diagram: 1. Create two normal markers, e.g. the markers "Mkr 1" (default label "M1") and "Mkr 2" (default label "M2"). Chapter 5.5.2, "Adding New Markers", on page 44. 2. - Page 55 ® Operating the Instrument R&S Scaling Diagrams ● The System – [Display] > "Config" softtool tab defines optional display elements for the interior of the diagrams. Use the context menu of the diagram, the System – [Display] key or the "Display" menu to access the display settings.
-
Page 56: Performing Measurements
® Performing Measurements R&S Transmission S-Parameter Measurement 6 Performing Measurements This chapter takes you through a sample session with a R&S ZNA network analyzer and describes basic operation tasks. Safety considerations Before starting any measurement on your network analyzer, please note the instruc- tions given in Chapter 3, "Putting the Analyzer into Operation",... -
Page 57: Selecting The Sweep Range And Other Parameters
® Performing Measurements R&S Transmission S-Parameter Measurement 1. Connect the DUT between test ports 1 and 2 of the network analyzer as shown above. 2. Switch on the instrument and start the VNA application. Proceed as described in Chapter 3.7, "Starting the Analyzer and Shutting Down", on page 14. -
Page 58: Calibrating The Instrument
® Performing Measurements R&S Transmission S-Parameter Measurement transmission coefficient of the DUT. It is defined as the ratio of the transmitted wave at the DUT's output port (port no. 2) to the incident wave at the DUT's input port (port no. The R&S ZNA automatically adjusts its internal source and receiver to the selected measured quantities: For an S measurement, a stimulus signal (termed a... - Page 59 ® Performing Measurements R&S Transmission S-Parameter Measurement The following example requires a calibration kit with a male Through standard with known transmission characteristics for the related test port connector type and gender. With a single Through, it is possible to perform a transmission normalization, compen- sating for a frequency-dependent attenuation and phase shift in the signal paths.
- Page 60 ® Performing Measurements R&S Transmission S-Parameter Measurement 6. The "Calibration" dock widget indicates the standard measurements that make up a "Trans Norm" calibration. Select "Through (mm)" to initiate the measurement of the connected Through stan- dard. Measuring the isolation between ports 1 and 2 is optional. Skip it for now. Getting Started 1178.6456.02 ─...
-
Page 61: Evaluating Data
® Performing Measurements R&S Transmission S-Parameter Measurement The analyzer performs a calibration sweep for the measured quantity S . The magnitude and phase of the result is displayed in two diagrams, together with the expected typical result for a Through standard. The similarity of real and expected traces indicates that the Through standard has been properly connected. -
Page 62: Saving And Printing Data
® Performing Measurements R&S Transmission S-Parameter Measurement 3. Select Trace – [Format] and choose the "Delay" of the transmission coefficient as displayed quantity. The group delay represents the propagation time of the wave through the DUT; it is displayed in a Cartesian diagram. The marker info field shows the frequency and group delay at the marker position. -
Page 63: Reflection S-Parameter Measurement
® Performing Measurements R&S Reflection S-Parameter Measurement 4. Activate the "Print" softtool tab (System – [File Print] > "Print") . 5. In the "Print" softtool tab, select "Print" to print the diagram area or "To Clipboard" to copy it to the Windows clipboard. 6. - Page 64 ® Performing Measurements R&S Reflection S-Parameter Measurement You can also use the basic transmission test setup, e.g. if you want to measure reflection and transmission parameters in parallel. ● The analyzer provides special calibration types for reflection measurements. Use the calibration wizard and select an appropriate type. A full n-port calibration (TOSM, UOSM, TNA ...) corrects the system errors for all transmission and reflection S-parameters.
-
Page 65: Administrative Tasks
® Administrative Tasks R&S Windows Operating System 7 Administrative Tasks This chapter describes some topics that are only needed occasionally, or if a special instrument configuration is required. 7.1 Windows Operating System ® The analyzer is equipped with a Windows operating system which has been config- ured according to the instrument's features and needs. -
Page 66: Firmware Update
® Administrative Tasks R&S Remote Operation in a LAN 7.2 Firmware Update Upgrade versions of the analyzer firmware are supplied as single executable setup files (*.exe). Administrator account You need administrator rights to install a new firmware version. See note on "User accounts and password protection"... -
Page 67: Assigning An Ip Address
® Administrative Tasks R&S Remote Operation in a LAN Virus protection An efficient virus protection is a prerequisite for secure operation in the network. Never connect your analyzer to an unprotected network. For useful hints, see the following Rohde & Schwarz application note: ●... - Page 68 ® Administrative Tasks R&S Remote Operation in a LAN 2. Use the Windows icon in the toolbar (or the Windows key on an external keyboard) ® to access Windows 3. Open the "Control Panel" > "Network and Sharing Center" > "Change adapter set- tings"...
-
Page 69: Remote Desktop Connection
® Administrative Tasks R&S Remote Operation in a LAN 7.3.2 Remote Desktop Connection Remote Desktop is a Windows ® application which you can use to access and control the analyzer from a remote computer through a LAN connection. While the measure- ment is running, the analyzer screen contents are displayed on the remote computer, and Remote Desktop provides access to all of the applications, files, and network resources of the analyzer. -
Page 70: Windows ® Firewall Settings
® Administrative Tasks R&S Remote Operation in a LAN 3. In the "Remote Desktop Connection" dialog, enter the VNA's computer name or IP address and select "Connect" ® 7.3.3 Windows Firewall Settings A firewall protects an instrument by preventing unauthorized users from gaining access to it through a network. -
Page 71: Maintenance
® Maintenance R&S Cleaning 8 Maintenance The R&S ZNA vector network analyzer does not require any special maintenance. For our support center address and a list of useful R&S contact addresses, refer to the "Contact" page at the beginning of the Help system. 8.1 Cleaning Risk of electric shock If moisture enters the casing, for example if you clean the instrument using a moist... -
Page 72: Storing And Packing The Instrument
® Maintenance R&S Storing and Packing the Instrument 8.2 Storing and Packing the Instrument The vector network analyzer can be stored at the temperature range quoted in the data sheet. When it is stored for a longer period of time, the unit must be protected against dust. -
Page 73: Obtaining Technical Support
® Obtaining Technical Support R&S 9 Obtaining Technical Support The instrument generates error messages which are usually sufficient for you to detect the cause of an error and find a remedy. Error message types are described in the R&S ZNA User Manual; refer to section "Error Messages and Troubleshooting". In addition, the system "Info"... -
Page 74: Index
® Index R&S Index Function keys ..............22 Channel section ............22 AC Supply ................. 14 Stimulus section ............22 Accessories (connect) ............16 System section ............22 Administrative tasks ............65 Trace section .............. 22 Application cards ..............9 Fuse .................. - Page 75 ® Index R&S Operating system .............. 65 System ................22 Option System Drive ..............26 R&S ZNA-B4 ............... 15 System keys ..............22 R&S ZNA-B7 ............... 26 R&S ZNA-B12 (Device Control) ........27 R&S ZNA-B15 (RFFE/GPIO Interface) ....... 27 Test port ................24 R&S ZNA-B19 .............
Need help?
Do you have a question about the ZNA Series and is the answer not in the manual?
Questions and answers