Table of Contents
Advertisement
Quick Links
Measurement Guide
Land Mobile Radio Analyzer and
Coverage Measurements
for Anritsu RF and Microwave
Handheld Instruments
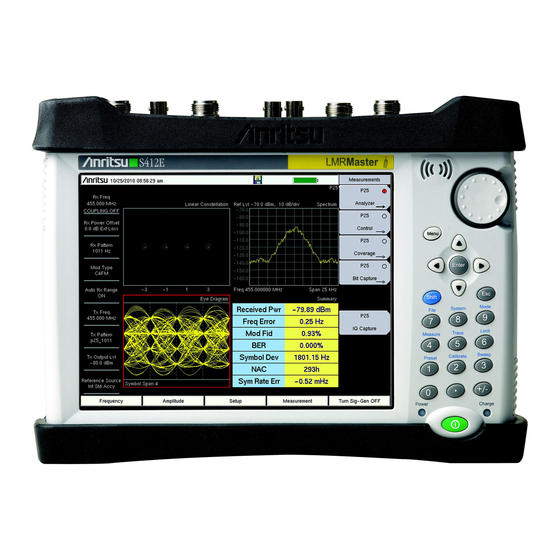
LMR Master™
Narrowband FM
P25/P25p2 Signal Analysis
NXDN Signal Analysis
TETRA Signal Analysis
DMR 2 Signal Analysis
PTC Signal Analysis
Not all instrument models offer every option or every measurement within a given
Note
option. Please refer to the Technical Data Sheet of your instrument for available
options and measurements within the options.
Anritsu Company
490 Jarvis Drive
Morgan Hill, CA 95037-2809
USA
http://www.anritsu.com
Analyzer
Included
Option 521
Option 531
Option 581
Option 591
Option 721
Copyright 2010, 2014 Anritsu Company
Coverage
Included
Option 522
Option 532
Option 582
Option 592
Option 722
Part Number: 10580-00243
Revision: F
Published: February 2014
Advertisement
Table of Contents

Subscribe to Our Youtube Channel
Related Manuals for Anritsu LMR Master


Summary of Contents for Anritsu LMR Master
- Page 1 Measurement Guide Land Mobile Radio Analyzer and Coverage Measurements for Anritsu RF and Microwave Handheld Instruments LMR Master™ Analyzer Coverage Narrowband FM Included Included P25/P25p2 Signal Analysis Option 521 Option 522 NXDN Signal Analysis Option 531 Option 532 TETRA Signal Analysis...
- Page 2 Google Earth is a trademark of Google Inc. NOTICE Anritsu Company has prepared this manual for use by Anritsu Company personnel and customers as a guide for the proper installation, operation and maintenance of Anritsu Company equipment and computer programs. The drawings, specifications, and information contained herein are the property of Anritsu Company, and any unauthorized use or disclosure of these drawings, specifications, and information is prohibited;...
- Page 3 Some or all of the following five symbols may or may not be used on all Anritsu equipment. In addition, there may be other labels attached to products that are not shown in the diagrams in this manual.
- Page 4 For Safety Warning Always refer to the operation manual when working near locations at which the alert mark, shown on the left, is attached. If the operation, etc., is performed without heeding the advice in the operation manual, there is a risk of personal injury. In addition, the equipment performance may be reduced.
-
Page 5: Table Of Contents
Contacting Anritsu ........ - Page 6 Table of Contents (Continued) 2-16 Limit Menu ..........2-27 2-17 Other Menus .
- Page 7 Table of Contents (Continued) Setup Procedure ..........4-1 Direct Connect to the Transmitter .
- Page 8 Table of Contents (Continued) NXDN Analyzer Graphs ........5-4 Constellation and Linear Constellation .
- Page 9 Table of Contents (Continued) Amplitude Menu ..........6-12 Vertical Scale Menu.
- Page 10 Table of Contents (Continued) 7-11 Measurement Menu ......... 7-20 Display Menu .
- Page 11 Anritsu easyMap Tools ........
- Page 12 Contents-8 PN: 10580-00243 Rev. F Land Mobile Radio MG...
-
Page 13: Chapter 1-General Information
From here, you can select the latest sales, select service and support contact information in your country or region, provide online feedback, complete a “Talk to Anritsu” form to have your questions answered, or obtain other services offered by Anritsu. -
Page 14: Selecting A Measurement Mode
1-4 Selecting a Measurement Mode Chapter 1 — General Information Selecting a Measurement Mode Press the Menu button and select the measurement mode by tapping its icon on the touch screen. Figure 1-1. Menu Button Screen Note that the shortcut icons in the menu screen include a button for each application and option installed in the instrument, as shipped from the factory. -
Page 15: Land Mobile Radio Mg Pn: 10580-00243 Rev. F
Chapter 1 — General Information 1-4 Selecting a Measurement Mode You can also press the Shift key then the Mode (9) key, select the measurement from the list using the rotary knob or the Arrow keys, and then press Enter. Figure 1-2. -
Page 16: Multi-Screen View
1-5 Multi-Screen View Chapter 1 — General Information Multi-Screen View The preset view in NBFM Analyzer, P25/P25p2 Analyzer, NXDN Analyzer, DMR 2 Analyzer, PTC Analyzer, and TETRA Analyzer measurements is the 4 measurement view (Figure 1-3). Tap once on an individual graph to make it active (red perimeter line). Figure 1-3. - Page 17 Chapter 1 — General Information 1-5 Multi-Screen View The default view in Coverage Mapping (Chapter 9) is the map view. Figure 1-5. Coverage Mapping The two measurement graph view (Figure 1-6) is also available when mapping. Tap once on a graph to make it the active graph (red perimeter line).
-
Page 18: Coverage Mapping
• For Spectrum Analyzer and AM/FM/PM coverage mapping information, refer to the Spectrum Analyzer Measurement Guide (p/n 10580-00244). The PDF document is available on the documentation disc included with the instrument or from the Anritsu web site: http://www.anritsu.com. -
Page 19: Chapter 2-Nbfm Analyzer
The LMR Master NBFM measurements include the ability to display frequency spectrum, audio spectrum, and the audio waveforms. In addition, a summary graph displays numeric... -
Page 20: Transmitter Analysis Setup
Transmitter Analysis Setup 1. On the LMR Master, press the Menu key then select the NBFM Analyzer icon or press Shift and then the Mode (9) button to open the Mode Selector dialog box. Highlight NBFM Analyzer and press Enter. -
Page 21: Receiver Analysis Setup
Receiver Analysis Setup 1. On the LMR Master, press the Menu key then select the NBFM Signal Analyzer icon or press Shift and then the Mode (9) button to open the Mode Selector dialog box. Highlight NBFM Analyzer and press Enter. -
Page 22: Nbfm Analyzer Graphs
NBFM Analyzer Graphs The following NBFM Analyzer measurements are available on the LMR Master. From the Measurements main menu press NBFM Analyzer twice. Press the Graph Type submenu key to select the measurement type. -
Page 23: Spectrum Graph
Chapter 2 — NBFM Analyzer 2-4 NBFM Analyzer Graphs Spectrum Graph The spectrum view displays signal power (dBm) versus frequency. The frequency span is adjustable under the Frequency menu using the Span submenu. The reference level is adjusted with the Amplitude menu. Refer to “Amplitude Menu”... -
Page 24: Audio Spectrum Graph
2-4 NBFM Analyzer Graphs Chapter 2 — NBFM Analyzer Audio Spectrum Graph The Audio Spectrum graph displays the frequency deviation in the audio. The Audio Spectrum span is adjustable in fixed increments using the Audio Span button (Measurement > NBFM Analyzer). The reference level setting is the product of the intermediate frequency bandwidth and percentage (Setup >... -
Page 25: Audio Waveform Graph
Chapter 2 — NBFM Analyzer 2-4 NBFM Analyzer Graphs Audio Waveform Graph The Audio Waveform graph displays a zero-span view of frequency deviation vs. time. The time span is adjustable from 50 μs to 150 ms using the Audio Sweep Time button (Measurement >... -
Page 26: Summary Graph
2-4 NBFM Analyzer Graphs Chapter 2 — NBFM Analyzer Summary Graph The summary graph provides an overview of an NBFM radio transmitter. The graph displays numeric values of carrier power, carrier frequency, freq error, frequency deviation, modulation rate, Signal to Noise and Distortion ratio (SINAD), Total Harmonic Distortion (THD), occupied bandwidth, and squelch/tone type of the input signal. -
Page 27: Nbfm Coverage
Setup for 20 dB Quieting and 12 dB SINAD 4. Set the LMR Master Tx Output Lvl to the minimum level (which will be –130 dBm + the value entered for Tx Power Offset) and the Tx Pattern to cw. Set the LMR Master Tx Freq to the radio receive frequency. - Page 28 10 % (–20 dB) of the reference audio voltage. 8. Press the Turn Sig-Gen ON main menu key to start the LMR Master transmitter. 9. Increase the LMR Master Tx Output Lvl until the needle on the voltage meter is in the center of the display (Figure 2-8).
- Page 29 Chapter 2 — NBFM Analyzer 2-6 20 dB Quieting Figure 2-8. 20 dB Quieting After Increasing the LMR Master Sig-Gen Tx Output Land Mobile Radio MG PN: 10580-00243 Rev. F 2-11...
-
Page 30: Db Sinad
3. Connect the LMR Master Audio In port to the radio loudspeaker or audio out connector (Figure 2-6). 4. Set the LMR Master Tx Output Lvl to the minimum level (which will be –130 dBm + the value entered for Tx Power Offset) and the Tx Pattern to fm_1khz_audio with a deviation specified by the radio manufacturer. - Page 31 Chapter 2 — NBFM Analyzer 2-7 12 dB SINAD Figure 2-9. 12 dB SINAD with Signal Generator Off Figure 2-10. 12 dB SINAD with Signal Generator On and Meter Showing the SINAD Level Land Mobile Radio MG PN: 10580-00243 Rev. F 2-13...
-
Page 32: Nbfm Analyzer Menus
2-8 NBFM Analyzer Menus Chapter 2 — NBFM Analyzer NBFM Analyzer Menus Menu maps typically display all possible submenu keys, although some keys are displayed on the instruments only under special circumstances (refer to menu descriptions on the following pages). Frequency Amplitude Setup (1/2) - Page 33 Chapter 2 — NBFM Analyzer 2-8 NBFM Analyzer Menus Units Filter Display Rx Units High Pass Filter Active Graph Watts None Tx Units Low Pass Filter Maximize Active Volts 3 kHz Graph De-emphasis Filter Graph Type Spectrum Occ BW IFBW Audio Span Occ BW Method Back...
-
Page 34: Frequency Menu
2-9 Frequency Menu Chapter 2 — NBFM Analyzer Frequency Menu Key Sequence: Frequency Rx Freq: Sets the receiver frequency. Press the Rx Freq key (or the menu Frequency shortcut on the left side of the screen) and enter the desired frequency using the keypad, the arrow keys, or the rotary knob. -
Page 35: Amplitude Menu
Chapter 2 — NBFM Analyzer 2-10 Amplitude Menu 2-10 Amplitude Menu Key Sequence: Amplitude Ref Level: Sets the reference power level at the top of the display when Amplitude Auto Range in Off. Ref Level Scale: Scale sets the number of dB per division in the y-axis power scale of the Spectrum Graph. -
Page 36: Vertical Scale Menu
2-10 Amplitude Menu Chapter 2 — NBFM Analyzer Vertical Scale Menu Key Sequence: Amplitude > Vertical Scale Vertical Scale RSSI Scale: Sets the number of dB per division in the y-axis power scale of the RSSI vs. Time graph in Coverage measurement. Enter a value RSSI Scale from 1 dB per division to 15 dB per division using the keypad, the arrow 10 dB/div... -
Page 37: Setup (1/2) Menu
Filters Note: The frequency range for all 3 tone types is below the minimum spectrum display of the LMR Master in NBFM mode and also has no effect Auto Scan on the Tx Pattern selection. -
Page 38: Setup (1/2) Menu (Continued)
When DTMF is selected at the Tx pattern, press the DTMF Tone submenu to FM Deviation set the DTMF character to transmit. Note: The Tone Type submenu (top of Setup 1/2) is for the LMR Master 2.400 kHz receiver and has no effect on the Tx patterns. -
Page 39: Filters Menu
Chapter 2 — NBFM Analyzer 2-11 Setup (1/2) Menu Filters Menu Key Sequence: Setup > Filters High Pass Filter: Displays a dialog box to select the cutoff frequency for the Filter high pass filter (attenuates frequencies below the cutoff setting). Cutoff frequency options are: None (default), 300 Hz, or 3 kHz. -
Page 40: Setup (2/2) Menu
2-11 Setup (1/2) Menu Chapter 2 — NBFM Analyzer Setup (2/2) Menu Key Sequence: Setup > More Deviation: Sets the deviation mode displayed in the NBFM Analyzer Setup (2/2) measurement Summary table (third row down). Rotates between Peak Deviation, RMS deviation, and Average deviation. Deviation Mode Averaging: Sets the refresh rate of the numerical values in the Peak... -
Page 41: Measurement Menu
Chapter 2 — NBFM Analyzer 2-12 Measurement Menu 2-12 Measurement Menu Key Sequence: Measurement NBFM Analyzer: Opens the “Display Menu” on page 2-24. Measurements NBFM Coverage (Option 722 required): Opens the NBFM Coverage NBFM menu. Refer to Chapter 9, “Coverage Mapping”. -
Page 42: Display Menu
2-12 Measurement Menu Chapter 2 — NBFM Analyzer Display Menu Key Sequence: Measurement > NBFM Analyzer Active Graph 1 2 3 4: In Four Screen view use this menu to select which of Display the four graphs is active. The current active graph is underlined (1 2 3 4) and has a red perimeter line. -
Page 43: Occ Bw Method Menu
Chapter 2 — NBFM Analyzer 2-12 Measurement Menu Occ BW Method Menu Key Sequence: Measurement > NBFM Analyzer > Occ BW Setup Occ BW Method: Toggle between % Int Pwr or > dBc. Occ BW When using % integrated power method the occupied frequency bandwidth Occ BW Method is calculated as the bandwidth containing the specified percentage of the transmitted power. -
Page 44: Sinad Menu
2-12 Measurement Menu Chapter 2 — NBFM Analyzer SINAD Menu Key Sequence: Measurement > NBFM SINAD FM Deviation: Set the cycle count of the frequency deviation. The range is SINAD 0 Hz to 100 kHz. FM Deviation Tx Output Lvl: Sets the output power of the Signal Generator (0 dB or 1 mW or 223 mV max). -
Page 45: Sweep Menu
Chapter 2 — NBFM Analyzer 2-13 Sweep Menu 2-13 Sweep Menu Key Sequence: Shift > Sweep (3) key Sweep Run/Hold: This submenu key toggles between continuous (run) Sweep sweep and hold sweep. In Run sweep mode, sweeps are continuous and one starts immediately after the previous sweep is completed. - Page 46 2-17 Other Menus Chapter 2 — NBFM Analyzer 2-28 PN: 10580-00243 Rev. F Land Mobile Radio MG...
-
Page 47: Chapter 3-P25 Analyzer (Option 521)
50 Ohm connector. To prevent damage, use a coupler or attenuator to reduce the input power to below this level when measuring high output power devices. 2. Connect the transmitter to the RF In 50 Ohm connector on the LMR Master using a coupler or attenuator. -
Page 48: Over The Air (Ota) Analysis Setup
2. Connect an antenna with the appropriate frequency range to the RF In 50 Ohm connector on the LMR Master. 3. Press the Frequency main menu key to set the center frequency of the measurement using the Rx Freq key. -
Page 49: Using The Signal Generator For Receiver Or Ota Analysis
Caution (0 dBm) and the frequency range is 500 kHz to 1.6 GHz. 2. Direct connect the LMR Master Signal Generator Out 50 Ohm connector to the repeater/receiver or connect an antenna with the appropriate frequency range to the connector. -
Page 50: P25 Analyzer Graphs
Chapter 3 — P25 Analyzer (Option 521) P25 Analyzer Graphs The following P25 Analyzer measurements are available on the LMR Master. From the Measurements main menu press P25 Analyzer twice. Press the Graph Type submenu key to select the measurement type. - Page 51 Figure 3-2. Linear Constellation Diagram For input signals that are not P25 encoded, the LMR Master will still try to decode it and fit it to a symbol. This may cause some measurement results that are unexpected. Land Mobile Radio MG...
-
Page 52: Histogram Graph
3-3 P25 Analyzer Graphs Chapter 3 — P25 Analyzer (Option 521) Histogram Graph The Histogram graph displays a graphical representation of the symbols that are being received. The graph for each symbol represents the relative percentage that symbol was identified out of all the received symbols. Each update of the screen is a separate representation of the latest data, rather than a cumulative total. -
Page 53: Spectrum Graph
Chapter 3 — P25 Analyzer (Option 521) 3-3 P25 Analyzer Graphs Spectrum Graph The spectrum view displays a graphical representation of power (dBm) versus frequency. The spectrum display gives an indication if there are interferers present that may degrade the bit error rate of the P25 signal. -
Page 54: Eye Diagram
3-3 P25 Analyzer Graphs Chapter 3 — P25 Analyzer (Option 521) Eye Diagram The eye diagram is an oscilloscope view of the P25 signal displaying the voltage of the signal vs. time. The diagram provides an indication of baseband fidelity of a P25 transmitter. With Over-the-air measurements the Eye Diagram can indicate phase distortion from multipath. -
Page 55: Summary Graph
Chapter 3 — P25 Analyzer (Option 521) 3-3 P25 Analyzer Graphs Summary Graph The summary graph provides an overview of a P25 transmitter. The graph displays numeric values of received power, frequency error, modulation fidelity (Mod Fid), bit error rate (BER), symbol deviation, Network Access Code (NAC), and symbol rate error of the input signal. -
Page 56: P25 Control Measurement
3. From the Measurement main menu press the P25 Control submenu key twice. 4. To log data, insert a formatted flash drive in the LMR Master and set Log Data to On. 5. The Hex Trigger menu and Hex Trigger Value menu are used to find a specific opcode in the Control Channel data. -
Page 57: Decoding Control Channel Measurements
Open the Anritsu home page (http://www.anritsu.com) with a web browser. b. Type S412E in the search box to find the LMR Master S412E product page on the Anritsu web site. Click the product page link to display the LMR Master product page. - Page 58 3-4 P25 Control Measurement Chapter 3 — P25 Analyzer (Option 521) Figure 3-7. P25 Control Channel (Voice) Figure 3-8. P25 Control Channel (Control) 3-12 PN: 10580-00243 Rev. F Land Mobile Radio MG...
-
Page 59: P25 Coverage
3. From the Measurement main menu press the P25 Bit Capture submenu key twice. 4. To log data, insert a formatted USB flash drive in the LMR Master and set Log Data to On. The bit capture information will be written to a data stamped folder inside the /usr folder on the root level of the USB flash drive. -
Page 60: P25 Iq Data
Note file can not be recalled and displayed on the instrument screen. The LMR Master can capture and log P25 IQ data to a USB flash drive. 1. From the Frequency main menu, set the receiver frequency (Rx Freq). 2. From the Setup main menu, choose a Mod Type. -
Page 61: P25 Analyzer Menus
Chapter 3 — P25 Analyzer (Option 521) 3-8 P25 Analyzer Menus P25 Analyzer Menus Menu maps typically display all possible submenu keys, although some keys are displayed on the instruments only under special circumstances (refer to menu descriptions on the following pages). -
Page 62: Frequency Menu
3-9 Frequency Menu Chapter 3 — P25 Analyzer (Option 521) Frequency Menu Key Sequence: Frequency Rx Freq: Sets the receiver frequency. Press the Rx Freq key and enter the Frequency desired frequency using the keypad, the arrow keys, or the rotary knob. If entering a frequency using the keypad, the submenu key labels change Rx Freq to GHz, MHz, kHz, and Hz. -
Page 63: Amplitude Menu
Chapter 3 — P25 Analyzer (Option 521) 3-10 Amplitude Menu 3-10 Amplitude Menu Key Sequence: Amplitude Ref Level: Sets the reference power level at the top of the display when Amplitude Auto Range in Off. Ref Level Scale: Scale sets the number of dB per division in the y-axis of the graticule. -
Page 64: Vertical Scale Menu
3-10 Amplitude Menu Chapter 3 — P25 Analyzer (Option 521) Vertical Scale Menu Key Sequence: Amplitude > Vertical Scale Vertical Scale RSSI Scale: Sets the number of dB per division in the y-axis power scale of the RSSI vs. Time graph in Coverage measurement. Enter a value RSSI Scale from 1 dB per division to 15 dB per division using the keypad, the arrow 10 dB/div... -
Page 65: Setup Menu
Chapter 3 — P25 Analyzer (Option 521) 3-11 Setup Menu 3-11 Setup Menu Key Sequence: Setup Mod Type: Sets the type of modulation. The options are C4FM (Phase I, Setup 12.5 kHz BW) or CQPSK (Phase I or Phase II, 6.25 kHz equivalent BW). Mod Type Rx Pattern: Selects the receiver Bit Error Rate pattern. -
Page 66: Measurement Menu
3-12 Measurement Menu Chapter 3 — P25 Analyzer (Option 521) 3-12 Measurement Menu Key Sequence: Measurement P25 Analyzer: Opens the “Display Menu” on page 3-21. Measurements P25 Control: Opens the “Control Channel Menu” on page 3-22. P25 Coverage (Option 522 required): Opens the P25 Coverage menu. Analyzer Refer to Chapter 9, “Coverage... -
Page 67: Display Menu
Chapter 3 — P25 Analyzer (Option 521) 3-12 Measurement Menu Display Menu Key Sequence: Measurement > P25 Analyzer Active Graph 1 2 3 4: In Four Screen view use this menu to select which of Display the four graphs is active. The current active graph is underlined (1 2 3 4) and has a red perimeter line. -
Page 68: Control Channel Menu
Sweep will change from Run to Hold. Set Trigger Value: Opens a touchscreen hexadecimal keyboard for setting the Trigger value. Sweep Sweep: Toggles the frequency sweep of the LMR Master between Run and Hold Hold. Save function as Shift + Sweep (3). Back: Returns to the “Measurement Menu”... -
Page 69: Sweep Menu
Chapter 3 — P25 Analyzer (Option 521) 3-13 Sweep Menu 3-13 Sweep Menu Key Sequence: Shift > Sweep (3) key Sweep Run/Hold: This submenu key toggles between continuous (run) Sweep sweep and hold sweep. In Run sweep mode, sweeps are continuous and one starts immediately after the previous sweep is completed. - Page 70 3-17 Other Menus Chapter 3 — P25 Analyzer (Option 521) 3-24 PN: 10580-00243 Rev. F Land Mobile Radio MG...
-
Page 71: Chapter 4-P25 Phase 2 Analyzer (Option 521)
50 Ohm connector. To prevent damage, use a coupler or attenuator to reduce the input power to below this level when measuring high output power devices. 2. Connect the transmitter to the RF In 50 Ohm connector on the LMR Master using a coupler or attenuator. -
Page 72: Over The Air (Ota) Analysis Setup
2. Connect an antenna with the appropriate frequency range to the RF In 50 Ohm connector on the LMR Master. 3. Press the Frequency main menu key to set the center frequency of the measurement using the Rx Freq key. -
Page 73: Using The Signal Generator For Receiver Or Ota Analysis
Caution (0 dBm) and the frequency range is 500 kHz to 1.6 GHz. 2. Direct connect the LMR Master Signal Generator Out 50 Ohm connector to the repeater/receiver or connect an antenna with the appropriate frequency range to the connector. -
Page 74: P25P2 Analyzer Graphs
Chapter 4 — P25 Phase 2 Analyzer (Option 521) P25p2 Analyzer Graphs The following P25p2 Analyzer measurements are available on the LMR Master. From the Measurements main menu press P25p2 Analyzer twice. Press the Graph Type submenu key to select the measurement type. - Page 75 Figure 4-2. Linear Constellation Diagram (Mobile Station) For input signals that are not P25p2 encoded, the LMR Master will still try to decode it and fit it to a symbol. This may cause some measurement results that are unexpected. Land Mobile Radio MG...
-
Page 76: Histogram Graph
4-3 P25p2 Analyzer Graphs Chapter 4 — P25 Phase 2 Analyzer (Option 521) Histogram Graph The Histogram graph displays a graphical representation of the symbols that are being received. The graph for each symbol represents the relative percentage that symbol was identified out of all the received symbols. -
Page 77: Spectrum Graph
Chapter 4 — P25 Phase 2 Analyzer (Option 521) 4-3 P25p2 Analyzer Graphs Spectrum Graph The spectrum view displays a graphical representation of power (dBm) vs. frequency. The spectrum display gives an indication if there are interferers present that may degrade the bit error rate of the P25p2 signal. -
Page 78: Eye Diagram
4-3 P25p2 Analyzer Graphs Chapter 4 — P25 Phase 2 Analyzer (Option 521) Eye Diagram The eye diagram is an oscilloscope view of the P25p2 signal displaying the voltage of the signal vs. time. The diagram provides an indication of baseband fidelity of a P25p2 transmitter. -
Page 79: Summary Graph
Chapter 4 — P25 Phase 2 Analyzer (Option 521) 4-3 P25p2 Analyzer Graphs Summary Graph The summary graph provides an overview of a P25p2 transmitter. The graph displays numeric values of received power, frequency error, modulation fidelity (Mod Fid), bit error rate (BER), symbol deviation, expected Color Code (CC), and symbol rate error of the input signal. -
Page 80: Power Profile
4-3 P25p2 Analyzer Graphs Chapter 4 — P25 Phase 2 Analyzer (Option 521) Power Profile The power profile graph is used with Mobile Station Mod Type to display a zero-span view of power vs. time of the selected Rx Slot. Figure 4-7. -
Page 81: P25P2 Control Measurement
3. From the Measurement main menu press the P25p2 Control submenu key twice. 4. To log data, insert a formatted flash drive in the LMR Master and set Log Data to On. 5. The Hex Trigger menu and Hex Trigger Value menu are used to find a specific opcode in the Control Channel data. - Page 82 4-4 P25p2 Control Measurement Chapter 4 — P25 Phase 2 Analyzer (Option 521) Figure 4-8. P25p2 Control Channel (Voice) Figure 4-9. P25p2 Control Channel (Control) 4-12 PN: 10580-00243 Rev. F Land Mobile Radio MG...
-
Page 83: P25P2 Coverage
3. From the Measurement main menu press the P25p2 Bit Capture submenu key twice. 4. To log data, insert a formatted USB flash drive in the LMR Master and set Log Data to On. The bit capture information will be written to a data stamped folder inside the /usr folder on the root level of the USB flash drive. -
Page 84: P25P2 Iq Data
Note file can not be recalled and displayed on the instrument screen. The LMR Master can capture and log P25p2 IQ data to a USB flash drive. 1. From the Frequency main menu, set the receiver frequency (Rx Freq). 2. Insert a formatted USB flash drive into the LMR Master and from the Measurement main menu, press the P25p2 IQ Capture submenu key. -
Page 85: P25P2 Analyzer Menus
Chapter 4 — P25 Phase 2 Analyzer (Option 521) 4-8 P25p2 Analyzer Menus P25p2 Analyzer Menus Menu maps typically display all possible submenu keys, although some keys are displayed on the instruments only under special circumstances (refer to menu descriptions on the following pages). -
Page 86: Frequency Menu
4-9 Frequency Menu Chapter 4 — P25 Phase 2 Analyzer (Option 521) Frequency Menu Key Sequence: Frequency Rx Freq: Sets the receiver frequency. Press the Rx Freq key and enter the Frequency desired frequency using the keypad, the arrow keys, or the rotary knob. If entering a frequency using the keypad, then the submenu key labels change Rx Freq to GHz, MHz, kHz, and Hz. -
Page 87: Amplitude Menu
Chapter 4 — P25 Phase 2 Analyzer (Option 521) 4-10 Amplitude Menu 4-10 Amplitude Menu Key Sequence: Amplitude Ref Level: Sets the reference power level at the top of the display when Amplitude Auto Range in Off. Ref Level Scale: Scale sets the number of dB per division in the y-axis of the graticule. -
Page 88: Vertical Scale Menu
4-10 Amplitude Menu Chapter 4 — P25 Phase 2 Analyzer (Option 521) Vertical Scale Menu Key Sequence: Amplitude > Vertical Scale Vertical Scale RSSI Scale: Sets the number of dB per division in the y-axis power scale of the RSSI vs. Time graph in Coverage measurement. Enter a value RSSI Scale from 1 dB per division to 15 dB per division using the keypad, the arrow 10 dB/div... -
Page 89: Setup Menu
Rx Slot Ctrl (Control) Channel Rx Slot: Selects the receiver time slot, 1 or 2. Tx Slot: Selects the LMR Master signal generator time slot, None, 1 or 2. Tx Slot Tx Pattern: Selects the transmitter pattern to send when the None Turn Sig-Gen ON main menu key is selected. -
Page 90: Setup (2/2) Menu
Averaging WACN ID: Sets the Wide Area Communication Network Identifier (WACN) value the LMR Master receiver looks for in the received P25 Phase 2 WACN ID transmission. System ID: Sets the System Identifier value the LMR Master receiver looks for in the received P25 Phase 2 transmission. -
Page 91: Measurement Menu
Chapter 4 — P25 Phase 2 Analyzer (Option 521) 4-12 Measurement Menu 4-12 Measurement Menu Key Sequence: Measurement P25p2 Analyzer: Opens the “Display Menu” on page 4-22. Measurements P25p2 Control: Opens the “Control Channel Menu” on page 4-23. P25p2 P25p2 Coverage (Option 522 required): Opens the P25p2 Coverage Analyzer menu. -
Page 92: Display Menu
4-12 Measurement Menu Chapter 4 — P25 Phase 2 Analyzer (Option 521) Display Menu Key Sequence: Measurement > P25p2 Analyzer Active Graph 1 2 3 4: In Four Screen view use this menu to select which of Display the four graphs is active. The current active graph is underlined (1 2 3 4) and has a red perimeter line. -
Page 93: Control Channel Menu
Sweep will change from Run to Hold. Set Trigger Value: Opens a touchscreen hexadecimal keyboard for setting the Trigger value. Sweep Sweep: Toggles the frequency sweep of the LMR Master between Run and Hold Hold. Save function as Shift + Sweep (3). Back: Returns to the “Measurement Menu”... -
Page 94: Sweep Menu
4-13 Sweep Menu Chapter 4 — P25 Phase 2 Analyzer (Option 521) 4-13 Sweep Menu Key Sequence: Shift > Sweep (3) key Sweep Run/Hold: This submenu key toggles between continuous (run) Sweep sweep and hold sweep. In Run sweep mode, sweeps are continuous and one starts immediately after the previous sweep is completed. -
Page 95: Chapter 5-Nxdn Analyzer (Option 531)
50 Ohm connector. To prevent damage, use a coupler or attenuator to reduce the input power to below this level when measuring high output power devices. 2. Connect the transmitter to the RF In 50 Ohm connector on the LMR Master using a coupler or attenuator. -
Page 96: Over The Air (Ota) Analysis Setup
2. Connect an antenna with the appropriate frequency range to the RF In 50 Ohm connector on the LMR Master. 3. Press the Frequency main menu key to set the center frequency of the measurement. -
Page 97: Using The Signal Generator For Receiver Or Ota Analysis
Caution (0 dBm) and the frequency range is 500 kHz to 1.6 GHz. 2. Direct connect the LMR Master Signal Generator Out 50 Ohm connector to the repeater/receiver or connect an antenna with the appropriate frequency range to the connector. -
Page 98: Nxdn Analyzer Graphs
Chapter 5 — NXDN Analyzer (Option 531) NXDN Analyzer Graphs The following NXDN Analyzer measurements are available on the LMR Master. From the Measurements main menu press NXDN Analyzer twice. Press the Graph Type submenu key to select the measurement type. - Page 99 Figure 5-2. Linear Constellation Diagram For input signals that are not NXDN encoded, the LMR Master will still try to decode it and fit it to a symbol. This may cause some measurement results that are unexpected. Land Mobile Radio MG...
-
Page 100: Histogram Graph
5-3 NXDN Analyzer Graphs Chapter 5 — NXDN Analyzer (Option 531) Histogram Graph The Histogram graph displays a graphical representation of the symbols that are being received. The graph for each symbol represents the relative percentage that symbol was identified out of all the received symbols. Each update of the screen is a separate representation of the latest data, rather than a cumulative total. -
Page 101: Spectrum Graph
Chapter 5 — NXDN Analyzer (Option 531) 5-3 NXDN Analyzer Graphs Spectrum Graph The spectrum view displays a graphical representation of power (dBm) vs. frequency. The spectrum display gives an indication if there are interferers present that may degrade the bit error rate of the NXDN signal. -
Page 102: Eye Diagram
5-3 NXDN Analyzer Graphs Chapter 5 — NXDN Analyzer (Option 531) Eye Diagram The eye diagram is an oscilloscope view of the NXDN signal displaying the voltage of the signal vs. time. The diagram provides an indication of baseband fidelity of an NXDN transmitter. -
Page 103: Summary Graph
Chapter 5 — NXDN Analyzer (Option 531) 5-3 NXDN Analyzer Graphs Summary Graph The summary graph provides an overview of an NXDN transmitter. The graph displays numeric values of received power, frequency error, modulation fidelity (Mod Fid), bit error rate (BER), symbol deviation, Radio Access Number (RAN), and symbol rate error of the input signal. -
Page 104: Nxdn Control Measurement
3. From the Measurement main menu press the NXDN Control submenu key twice. 4. To log data, insert a formatted USB flash drive in the LMR Master and set Log Data to 5. The Hex Trigger menu and Hex Trigger Value menu are used to find a specific opcode in the Control Channel data. -
Page 105: Decoding Control Channel Measurements
Open the Anritsu home page (http://www.anritsu.com) with a web browser. b. Type S412E in the search box to find the LMR Master S412E product page on the Anritsu web site. Click the product page link to display the LMR Master product page. - Page 106 5-4 NXDN Control Measurement Chapter 5 — NXDN Analyzer (Option 531) Figure 5-7. NXDN Control Channel (Voice) Figure 5-8. NXDN Control Channel (Control) 5-12 PN: 10580-00243 Rev. F Land Mobile Radio MG...
-
Page 107: Nxdn Bit Capture
3. From the Measurement main menu press the NXDN Bit Capture submenu key twice. 4. To log data, insert a formatted USB flash drive in the LMR Master and set Log Data to On. The bit capture information will be written to a data stamped folder inside the /usr folder on the root level of the USB flash drive. -
Page 108: Nxdn Iq Data
Note file can not be recalled and displayed on the instrument screen. The LMR Master can capture and log NXDN IQ data to a USB flash drive. 1. From the Frequency main menu, set the receiver frequency (Rx Freq). 2. From the Setup main menu, choose a Mod Bandwidth. -
Page 109: Nxdn Analyzer Menus
Chapter 5 — NXDN Analyzer (Option 531) 5-7 NXDN Analyzer Menus NXDN Analyzer Menus Menu maps typically display all possible submenu keys, although some keys are displayed on the instruments only under special circumstances (refer to menu descriptions on the following pages). -
Page 110: Frequency Menu
5-8 Frequency Menu Chapter 5 — NXDN Analyzer (Option 531) Frequency Menu Key Sequence: Frequency Rx Freq: Sets the receiver frequency. Press the Rx Freq key and enter the Frequency desired frequency using the keypad, the arrow keys, or the rotary knob. If entering a frequency using the keypad, the submenu key labels change to Rx Freq GHz, MHz, kHz, and Hz. -
Page 111: Amplitude Menu
Chapter 5 — NXDN Analyzer (Option 531) 5-9 Amplitude Menu Amplitude Menu Key Sequence: Amplitude Ref Level: Sets the reference power level at the top of the display when Amplitude Auto Range in Off. Ref Level Scale: Scale sets the number of dB per division in the y-axis of the graticule. -
Page 112: Vertical Scale Menu
5-9 Amplitude Menu Chapter 5 — NXDN Analyzer (Option 531) Vertical Scale Menu Key Sequence: Amplitude > Vertical Scale Vertical Scale RSSI Scale: Sets the number of dB per division in the y-axis power scale of the RSSI vs. Time graph in Coverage measurement. Enter a value RSSI Scale from 1 dB per division to 15 dB per division using the keypad, the arrow 10 dB/div... -
Page 113: Setup Menu
Chapter 5 — NXDN Analyzer (Option 531) 5-10 Setup Menu 5-10 Setup Menu Key Sequence: Setup Mod Bandwidth: Sets the type of modulation bandwidth. This key toggles Setup between 12.5 kHz and 6.25 kHz. Mod Bandwidth Rx Pattern: Selects the receiver Bit Error Rate pattern. Select a pattern from the list box with the arrow keys or rotary knob and press Enter. -
Page 114: Measurement Menu
5-11 Measurement Menu Chapter 5 — NXDN Analyzer (Option 531) 5-11 Measurement Menu Key Sequence: Measurement NXDN Analyzer: Opens the “Display Menu” on page 5-21. Measurements NXDN Control: Opens the “Control Channel Menu” on page 5-22. NXDN NXDN Coverage (Option 532 required): Opens the NXDN Coverage menu. -
Page 115: Display Menu
Chapter 5 — NXDN Analyzer (Option 531) 5-11 Measurement Menu Display Menu Key Sequence: Measurement > NXDN Analyzer Active Graph 1 2 3 4: In Four Screen view use this menu to select which of Display the four graphs is active. The current active graph is underlined (1 2 3 4) and has a red perimeter line. -
Page 116: Control Channel Menu
Sweep will change from Run to Hold. Set Trigger Value: Opens a touchscreen hexadecimal keyboard for setting the Trigger value. Sweep Sweep: Toggles the frequency sweep of the LMR Master between Run and Hold Hold. Save function as Shift + Sweep (3). Back: Returns to the “Measurement Menu”... -
Page 117: Sweep Menu
Chapter 5 — NXDN Analyzer (Option 531) 5-12 Sweep Menu 5-12 Sweep Menu Key Sequence: Shift > Sweep (3) key Sweep Run/Hold: This submenu key toggles between continuous (run) sweep and hold sweep. In Run sweep mode, sweeps are continuous and one Sweep starts immediately after the previous sweep is completed. - Page 118 5-16 Other Menus Chapter 5 — NXDN Analyzer (Option 531) 5-24 PN: 10580-00243 Rev. F Land Mobile Radio MG...
-
Page 119: Chapter 6-Tetra Analyzer (Option 581)
(OTA) signals. The LMR Master signal generator does not function in the TETRA Analyzer. The LMR Master will analyze input signal strengths from +33 dBm (2.0 watts) down to levels approaching the sensitivity of TETRA radios, automatically adjusting the input sensitivity based on input levels. -
Page 120: Tetra Analyzer Graphs
This section briefly describes TETRA Analyzer measurements that are available on the LMR Master. From the Measurements main menu press the TETRA Analyzer submenu key. If necessary, press the key a second time to show the Display menu. Press the Graph Type submenu key to select the graph type. - Page 121 6-3 TETRA Analyzer Graphs Figure 6-2. Linear Constellation Diagram Note that for input signals that are not TETRA encoded, the LMR Master will still try to decode them and fit them to a symbol. This may result in measurement values that are unexpected.
-
Page 122: Histogram Graph
6-3 TETRA Analyzer Graphs Chapter 6 — TETRA Analyzer (Option 581) Histogram Graph The Histogram graph displays a graphical representation of the symbols that are being received. The graph for each symbol represents the relative percentage that symbol was identified out of all the received symbols. Each update of the screen is a separate representation of the latest data, rather than a cumulative total. -
Page 123: Spectrum Graph
Chapter 6 — TETRA Analyzer (Option 581) 6-3 TETRA Analyzer Graphs Spectrum Graph The spectrum view displays a graphical representation of power (dBm) vs. frequency. The spectrum display gives an indication if there are interferers present that may degrade the bit error rate of the TETRA signal. -
Page 124: Eye Diagram
6-3 TETRA Analyzer Graphs Chapter 6 — TETRA Analyzer (Option 581) Eye Diagram The eye diagram is an oscilloscope view of the TETRA signal displaying the voltage of the signal vs. time. The diagram provides an indication of baseband fidelity of a TETRA transmitter. -
Page 125: Summary And Tetra Summary Graphs
Chapter 6 — TETRA Analyzer (Option 581) 6-3 TETRA Analyzer Graphs Summary and TETRA Summary Graphs These two summary displays provide measured and decoded values in a table format. Summary Graph The Summary graph provides an overview of the measurements made on the signal received from a downlink TETRA transmitter. - Page 126 6-3 TETRA Analyzer Graphs Chapter 6 — TETRA Analyzer (Option 581) Received Pwr in the Summary table is the integrated power of all the energy in the receiver bandwidth. Any peak amplitude reduction seen in the Spectrum display when compared to Received Pwr is a function of the instrument RBW setting.
-
Page 127: Tetra Iq Data
Note file cannot be recalled and displayed on the instrument screen. The LMR Master can capture and log TETRA IQ data to a USB flash drive. 1. From the Frequency main menu, set the receiver frequency (Rx Freq). 2. Insert a formatted USB flash drive into the LMR Master, and from the Measurement main menu, press the TETRA IQ Capture submenu key. -
Page 128: Tetra Analyzer Menus
6-5 TETRA Analyzer Menus Chapter 6 — TETRA Analyzer (Option 581) TETRA Analyzer Menus Menu maps typically display all possible submenu keys, although some keys are displayed on the instruments only under special circumstances (refer to menu descriptions on the following pages). -
Page 129: Frequency Menu
Chapter 6 — TETRA Analyzer (Option 581) 6-6 Frequency Menu Frequency Menu Key Sequence: Frequency Frequency Rx Freq: Sets the receiver frequency. Press the Rx Freq key and enter the Rx Freq desired frequency using the keypad, the arrow keys, or the rotary knob. If entering a frequency using the keypad, the submenu key labels change to 3000 GHz GHz, MHz, kHz, and Hz. -
Page 130: Amplitude Menu
6-7 Amplitude Menu Chapter 6 — TETRA Analyzer (Option 581) Amplitude Menu Key Sequence: Amplitude Ref Level: Sets the reference power level at the top of the display Amplitude when Auto Range in Off. Ref Level Scale: Scale sets the number of dB per division in the y-axis of the graticule. -
Page 131: Vertical Scale Menu
Chapter 6 — TETRA Analyzer (Option 581) 6-7 Amplitude Menu Vertical Scale Menu Key Sequence: Amplitude > Vertical Scale Vertical Scale RSSI Scale: Sets the number of dB per division in the y-axis power scale RSSI Scale of the RSSI vs. Time graph in Coverage measurement. Enter a value from 1 dB per division to 15 dB per division by using the keypad, the Arrow 10 dB/div keys, or the rotary knob. -
Page 132: Setup Menu
6-8 Setup Menu Chapter 6 — TETRA Analyzer (Option 581) Setup Menu Key Sequence: Setup Setup Mod Type Mod Type: The setting of this key is locked to “Base Station”. Base Station Rx Pattern Rx Pattern TETRA OTA The setting of this key is locked to “TETRA OTA”. Squelch Lvl Squelch Lvl: Sets the squelch power level. -
Page 133: Setup (2/2) Menu
Chapter 6 — TETRA Analyzer (Option 581) 6-9 Setup (2/2) Menu Setup (2/2) Menu Key Sequence: Setup > More Setup (2/2) Averaging Averaging: Sets the refresh rate of the numerical values in the TETRA Summary window. Setting a higher number (25 maximum) reduces measurement jitter. -
Page 134: Measurement Menu
6-10 Measurement Menu Chapter 6 — TETRA Analyzer (Option 581) 6-10 Measurement Menu Key Sequence: Measurement Measurements TETRA TETRA Analyzer: Opens the “Display Menu” on page 6-17. Analyzer TETRA TETRA Coverage (Option 582 required): Opens the TETRA Coverage Coverage menu. Refer to Chapter 9, “Coverage Mapping”. -
Page 135: Display Menu
Chapter 6 — TETRA Analyzer (Option 581) 6-10 Measurement Menu Display Menu Key Sequence: Measurement > TETRA Analyzer Active Graph 1 2 3 4: In Four Screen view use this menu to select which of Display the four graphs is active. The current active graph is underlined (1 2 3 4) and has a red perimeter line. -
Page 136: Sweep Menu
6-11 Sweep Menu Chapter 6 — TETRA Analyzer (Option 581) 6-11 Sweep Menu Key Sequence: Shift > Sweep (3) key Sweep Run/Hold: This submenu key toggles between continuous (run) sweep and hold sweep. In Run sweep mode, sweeps are continuous and one Sweep starts immediately after the previous sweep is completed. -
Page 137: Chapter 7-Dmr 2 Analyzer (Option 591)
50 Ohm connector. To prevent damage, use a coupler or attenuator to reduce the input power to below this level when measuring high output power devices. 2. Connect the transmitter to the RF In 50 Ohm connector on the LMR Master using a coupler or attenuator. -
Page 138: Over The Air (Ota) Analysis Setup
2. Connect an antenna with the appropriate frequency range to the RF In 50 Ohm connector on the LMR Master. 3. Press the Frequency main menu key to set the center frequency of the measurement using the Rx Freq key. -
Page 139: Using The Signal Generator For Receiver Or Ota Analysis
Caution (0 dBm) and the frequency range is 500 kHz to 1.6 GHz. 2. Direct connect the LMR Master Signal Generator Out 50 Ohm connector to the repeater/receiver or connect an antenna with the appropriate frequency range to the connector. -
Page 140: Dmr 2 Analyzer Graphs
Chapter 7 — DMR 2 Analyzer (Option 591) DMR 2 Analyzer Graphs The following DMR 2 Analyzer measurements are available on the LMR Master. From the Measurements main menu press DMR 2 Analyzer twice. Press the Graph Type submenu key to select the measurement type. - Page 141 Figure 7-2. Linear Constellation Diagram For input signals that are not DMR 2 encoded, the LMR Master will still try to decode it and fit it to a symbol. This may cause some measurement results that are unexpected. Land Mobile Radio MG...
-
Page 142: Histogram Graph
7-3 DMR 2 Analyzer Graphs Chapter 7 — DMR 2 Analyzer (Option 591) Histogram Graph The Histogram graph displays a graphical representation of the symbols that are being received. The graph for each symbol represents the relative percentage that symbol was identified out of all the received symbols. -
Page 143: Spectrum Graph
Chapter 7 — DMR 2 Analyzer (Option 591) 7-3 DMR 2 Analyzer Graphs Spectrum Graph The spectrum view displays a graphical representation of power (dBm) vs. frequency. The spectrum display gives an indication if there are interferers present that may degrade the bit error rate of the DMR 2 signal. -
Page 144: Eye Diagram
7-3 DMR 2 Analyzer Graphs Chapter 7 — DMR 2 Analyzer (Option 591) Eye Diagram The eye diagram is an oscilloscope view of the DMR 2 signal displaying the voltage of the signal vs. time. The diagram provides an indication of baseband fidelity of a DMR 2 transmitter. -
Page 145: Summary Graph
Chapter 7 — DMR 2 Analyzer (Option 591) 7-3 DMR 2 Analyzer Graphs Summary Graph The summary graph provides an overview of a DMR 2 transmitter. The graph displays numeric values of received power, frequency error, modulation fidelity (Mod Fid), bit error rate (BER), symbol deviation, Color Code (CC), and symbol rate error of the input signal. -
Page 146: Dmr 2 Control Measurement
3. From the Measurement main menu press the DMR 2 Control submenu key twice. 4. To log data, insert a formatted USB flash drive in the LMR Master and set Log Data to 5. The Hex Trigger menu and Hex Trigger Value menu are used to find a specific opcode in the Control Channel data. -
Page 147: Decoding Control Channel Measurements
Open the Anritsu home page (http://www.anritsu.com) with a web browser. b. Type S412E in the search box to find the LMR Master S412E product page on the Anritsu web site. Click the product page link to display the LMR Master product page. - Page 148 7-4 DMR 2 Control Measurement Chapter 7 — DMR 2 Analyzer (Option 591) Figure 7-7. DMR 2 Control Channel (Voice) Figure 7-8. DMR 2 Control Channel (Control) 7-12 PN: 10580-00243 Rev. F Land Mobile Radio MG...
-
Page 149: Dmr 2 Bit Capture
3. From the Measurement main menu press the DMR 2 Bit Capture submenu key twice. 4. To log data, insert a formatted USB flash drive in the LMR Master and set Log Data to On. The bit capture information will be written to a data stamped folder inside the /usr folder on the root level of the USB flash drive. -
Page 150: Dmr 2 Iq Data
Note file can not be recalled and displayed on the instrument screen. The LMR Master can capture and log DMR 2 IQ data to a USB flash drive. 1. From the Frequency main menu, set the receiver frequency (Rx Freq). -
Page 151: Dmr 2 Analyzer Menus
Chapter 7 — DMR 2 Analyzer (Option 591) 7-7 DMR 2 Analyzer Menus DMR 2 Analyzer Menus Menu maps typically display all possible submenu keys, although some keys are displayed on the instruments only under special circumstances (refer to menu descriptions on the following pages). -
Page 152: Frequency Menu
7-8 Frequency Menu Chapter 7 — DMR 2 Analyzer (Option 591) Frequency Menu Key Sequence: Frequency Rx Freq: Sets the receiver frequency. Press the Rx Freq key and enter the Frequency desired frequency using the keypad, the arrow keys, or the rotary knob. If entering a frequency using the keypad, the submenu key labels change to Rx Freq GHz, MHz, kHz, and Hz. -
Page 153: Amplitude Menu
Chapter 7 — DMR 2 Analyzer (Option 591) 7-9 Amplitude Menu Amplitude Menu Key Sequence: Amplitude Ref Level: Sets the reference power level at the top of the display when Amplitude Auto Range in Off. Ref Level Scale: Scale sets the number of dB per division in the y-axis of the graticule. -
Page 154: Vertical Scale Menu
7-9 Amplitude Menu Chapter 7 — DMR 2 Analyzer (Option 591) Vertical Scale Menu Key Sequence: Amplitude > Vertical Scale Vertical Scale RSSI Scale: Sets the number of dB per division in the y-axis power scale of the RSSI vs. Time graph in Coverage measurement. Enter a value RSSI Scale from 1 dB per division to 15 dB per division using the keypad, the arrow 10 dB/div... -
Page 155: Setup Menu
Idle Tx Slot Rx Slot: Selects the receiver time slot, 1 or 2. Tx Slot: Selects the LMR Master signal generator time slot, 1 or 2. Tx Pattern: Selects the transmitter pattern to send when the Tx Pattern Turn Sig-Gen ON main menu key is selected. Select a pattern from the dmr2_ms_1031 Hz list box with the arrow keys or rotary knob and press Enter. -
Page 156: Measurement Menu
7-11 Measurement Menu Chapter 7 — DMR 2 Analyzer (Option 591) 7-11 Measurement Menu Key Sequence: Measurement DMR 2 Analyzer: Opens the “Display Menu” on page 7-21. Measurements DMR 2 Control: Opens the “Control Channel Menu” on page 7-22. DMR 2 DMR 2 Coverage (Option 592 required): Opens the DMR 2 Coverage Analyzer menu. -
Page 157: Display Menu
Chapter 7 — DMR 2 Analyzer (Option 591) 7-11 Measurement Menu Display Menu Key Sequence: Measurement > DMR 2 Analyzer Active Graph Display 1 2 3 4: In Four Screen view, use this menu to select which of the four graphs is active. -
Page 158: Control Channel Menu
Sweep will change from Run to Hold. Set Trigger Value: Opens a touchscreen hexadecimal keyboard for setting the Trigger value. Sweep Sweep: Toggles the frequency sweep of the LMR Master between Run and Hold Hold. Save function as Shift + Sweep (3). Back: Returns to the “Measurement Menu”... -
Page 159: Sweep Menu
Chapter 7 — DMR 2 Analyzer (Option 591) 7-12 Sweep Menu 7-12 Sweep Menu Key Sequence: Shift > Sweep (3) key Sweep Run/Hold: This submenu key toggles between continuous (run) sweep and hold sweep. In Run sweep mode, sweeps are continuous and one Sweep starts immediately after the previous sweep is completed. - Page 160 7-16 Other Menus Chapter 7 — DMR 2 Analyzer (Option 591) 7-24 PN: 10580-00243 Rev. F Land Mobile Radio MG...
-
Page 161: Chapter 8-Ptc Analyzer (Option 721)
50 Ohm connector. To prevent damage, use a coupler or attenuator to reduce the input power to below this level when measuring high output power devices. 2. Connect the transmitter to the RF In 50 Ohm connector on the LMR Master using a coupler or attenuator. -
Page 162: Over The Air (Ota) Analysis Setup
2. Connect an antenna with the appropriate frequency range to the RF In 50 Ohm connector on the LMR Master. 3. Press the Frequency main menu key to set the center frequency of the measurement using the Rx Freq key. -
Page 163: Using The Signal Generator For Receiver Or Ota Analysis
Caution (0 dBm) and the frequency range is 500 kHz to 1.6 GHz. 2. Direct connect the LMR Master Signal Generator Out 50 Ohm connector to the repeater/receiver or connect an antenna with the appropriate frequency range to the connector. -
Page 164: Ptc Analyzer Graphs
Chapter 8 — PTC Analyzer (Option 721) PTC Analyzer Graphs The following PTC Analyzer measurements are available on the LMR Master. From the Measurements main menu press PTC Analyzer twice. Press the Graph Type submenu key to select the measurement type. - Page 165 Figure 8-2. Linear Constellation Diagram For input signals that are not PTC encoded, the LMR Master will still try to decode it and fit it to a symbol. This may cause some measurement results that are unexpected. Land Mobile Radio MG...
-
Page 166: Histogram Graph
8-3 PTC Analyzer Graphs Chapter 8 — PTC Analyzer (Option 721) Histogram Graph The Histogram graph displays a graphical representation of the symbols that are being received. The graph for each symbol represents the relative percentage that symbol was identified out of all the received symbols. Each update of the screen is a separate representation of the latest data, rather than a cumulative total. -
Page 167: Spectrum Graph
Chapter 8 — PTC Analyzer (Option 721) 8-3 PTC Analyzer Graphs Spectrum Graph The spectrum view displays a graphical representation of power (dBm) vs. frequency. The spectrum display gives an indication if there are interferers present that may degrade the bit error rate of the PTC signal. -
Page 168: Eye Diagram
8-3 PTC Analyzer Graphs Chapter 8 — PTC Analyzer (Option 721) Eye Diagram The eye diagram is an oscilloscope view of the PTC signal displaying the voltage of the signal vs. time. The diagram provides an indication of baseband fidelity of a PTC transmitter. With Over-the-air measurements the Eye Diagram can indicate phase distortion from multipath. - Page 169 Chapter 8 — PTC Analyzer (Option 721) 8-3 PTC Analyzer Graphs Figure 8-6. PTC Summary Graph Received Pwr in the Summary table is the integrated power of all the energy in the receiver bandwidth. Any peak amplitude reduction seen in the Spectrum display when compared to Received Pwr is a function of the RBW setting of the instrument.
-
Page 170: Ptc Iq Data
Note file can not be recalled and displayed on the instrument screen. The LMR Master can capture and log DMR 2 IQ data to a USB flash drive. 1. From the Frequency main menu, set the receiver frequency (Rx Freq). -
Page 171: Ptc Analyzer Menus
Chapter 8 — PTC Analyzer (Option 721) 8-5 PTC Analyzer Menus PTC Analyzer Menus Menu maps typically display all possible submenu keys, although some keys are displayed on the instruments only under special circumstances (refer to menu descriptions on the following pages). -
Page 172: Frequency Menu
8-6 Frequency Menu Chapter 8 — PTC Analyzer (Option 721) Frequency Menu Key Sequence: Frequency Rx Freq: Sets the receiver frequency. Press the Rx Freq key and enter the Frequency desired frequency using the keypad, the arrow keys, or the rotary knob. If entering a frequency using the keypad, the submenu key labels change Rx Freq to GHz, MHz, kHz, and Hz. -
Page 173: Amplitude Menu
Chapter 8 — PTC Analyzer (Option 721) 8-7 Amplitude Menu Amplitude Menu Key Sequence: Amplitude Ref Level: Sets the reference power level at the top of the display when Amplitude Auto Range in Off. Ref Level Scale: Scale sets the number of dB per division in the y-axis of the graticule. -
Page 174: Vertical Scale Menu
8-7 Amplitude Menu Chapter 8 — PTC Analyzer (Option 721) Vertical Scale Menu Key Sequence: Amplitude > Vertical Scale Vertical Scale RSSI Scale: Sets the number of dB per division in the y-axis power scale of the RSSI vs. Time graph in Coverage measurement. Enter a value RSSI Scale from 1 dB per division to 15 dB per division using the keypad, the arrow 10 dB/div... -
Page 175: Setup Menu
Chapter 8 — PTC Analyzer (Option 721) 8-8 Setup Menu Setup Menu Key Sequence: Setup Rx Pattern: Selects the receiver Bit Error Rate pattern. Select a pattern from the list box with the arrow keys or rotary knob and press Enter. There are two Setup available patterns: O.153 (V.52) -
Page 176: Measurement Menu
8-9 Measurement Menu Chapter 8 — PTC Analyzer (Option 721) Measurement Menu Key Sequence: Measurement PTC Analyzer: Opens the “Display Menu (1 of 2)” on page 8-17. Measurements PTC Coverage (Option 722 required): Opens the PTC Coverage menu. Refer to Chapter 9, “Coverage Mapping”. -
Page 177: Display Menu (1 Of 2)
Chapter 8 — PTC Analyzer (Option 721) 8-9 Measurement Menu Display Menu (1 of 2) Key Sequence: Measurement > PTC Analyzer Active Graph 1 2 3 4: In Four-Screen view (maximized), use this submenu key to Display select which of the four graphs is active. The current active graph is Active Graph underlined (1 2 3 4), and the graph has a red perimeter line in the sweep window. -
Page 178: Display Menu (2 Of 2)
8-9 Measurement Menu Chapter 8 — PTC Analyzer (Option 721) Display Menu (2 of 2) Key Sequence: Measurement > PTC Analyzer Display Active Graph Maximize Active Graph Power Display Graph Type Continuous Burst: Depending on their configuration, ITC-R PTC radios emit signals as either a continuous data stream or a burst/packet stream. -
Page 179: Sweep Menu
Chapter 8 — PTC Analyzer (Option 721) 8-10 Sweep Menu 8-10 Sweep Menu Key Sequence: Shift > Sweep (3) key Sweep Run/Hold: This submenu key toggles between continuous (run) sweep and hold sweep. In Run sweep mode, sweeps are continuous and one Sweep starts immediately after the previous sweep is completed. - Page 180 8-14 Other Menus Chapter 8 — PTC Analyzer (Option 721) 8-20 PN: 10580-00243 Rev. F Land Mobile Radio MG...
-
Page 181: Chapter 9- Coverage Mapping
The easyMap Tools™ program creates single panel maps (.map) that are compatible with Anritsu handheld instruments. The software also creates pan and zoom maps (.azm) that are compatible with supported Anritsu instruments. The software imports maps from OpenStreetMap and Google Maps and creates files with or without GPS information. -
Page 182: General Measurement Setups
9-2 General Measurement Setups Chapter 9 — Coverage Mapping General Measurement Setups Refer to the setup procedures in this Measurement Guide for the specific measurement mode used in Coverage Mapping: • NBFM, “Transmitter Analysis Setup” on page 2-2 • P25, “Over the Air (OTA) Analysis Setup”... - Page 183 Chapter 9 — Coverage Mapping 9-3 Coverage Mapping Introduction • Graph Display Type: Displays line graphs for 2 of the 3 measurement values for the selected frequency over time. Change the displayed graph type by using the Mapping Type button. Graph points are displayed in yellow when GPS is On and in red when GPS is Off.
-
Page 184: Outdoor Coverage
9-3 Coverage Mapping Introduction Chapter 9 — Coverage Mapping Outdoor Coverage With a valid GPS signal, the instrument identifies the current location on the displayed GeoEmbedded map with a cross. Previously saved locations are displayed as squares. Current Location Start Data Collection Stop Data Collection Current Location... -
Page 185: Indoor Coverage
Measurement Setup Threshold Settings Figure 9-4. Indoor Coverage Mapping (GPS Off) Coverage Mapping is a four-step process (refer to Section “Anritsu easyMap Tools” on page 9-6): • Create an indoor map or an outdoor map by using “Anritsu easyMap Tools”. -
Page 186: Anritsu Easymap Tools
Anritsu easyMap Tools from the Anritsu web site (www.anritsu.com). Terminology: AZM – Anritsu Zoomable Map, the format of a map file with pan and zoom capabilities for on-instrument maps. Coverage Map – This defines the bounds of the AZM file. Everything contained within this map shows up in the AZM file. -
Page 187: Creating An Outdoor Map File With Easymap Tools
The image size should be close to 640 pixels by 420 pixels (approximately a 1.6:1 ratio). 2. Launch the Anritsu easyMap Tools application. 3. In the File pull-down menu, select Open Image File... and choose the image file to be converted to a map. - Page 188 9-4 Anritsu easyMap Tools Chapter 9 — Coverage Mapping Figure 9-5 is an example of two overlapping maps from a mapping service with GPS data for the border of each map. 2 Captured Maps with GPS Data. 37.15616 -121.66114 -121.63788 Map A 37.14624...
- Page 189 Table 9-1 lists the map area at several zoom levels. Notice from the examples that zooming in a level with Anritsu easyMap Tools reduces the map dimensions by half, and zooming out a level doubles the map dimensions. Table 9-1.
-
Page 190: Creating An Indoor Map File With Easymap Tools
640 pixels x 420 pixels (approximately a 1.6:1 ratio) in order to display well on your handheld instrument. 2. Launch the Anritsu easyMap Tools application. 3. In the File pull-down menu, select Open Image File... and then select your indoor mapping image file. -
Page 191: Instrument Settings
GPS. Recall a Map (Indoor or Outdoor Coverage) The instrument allows you to recall a .map file (created with Anritsu easyMap Tools). With a valid GPS signal, the current location is displayed on an outdoor map, or an arrow shows the direction of the current location if it is outside the map coverage area. -
Page 192: Recall The Default Grid
Reformat the USB flash drive, and copy the map files to the reformatted drive. Recall the Default Grid The instrument is able to make coverage mapping measurements even when an Anritsu easyMap Tools file of the current indoor or outdoor location is not available. In such cases, use the default grid map, save the KML points, and recall them at a later time with a map. -
Page 193: Measurement Setup For Map Display Type
Chapter 9 — Coverage Mapping 9-6 Measurement Setup for Map Display Type Measurement Setup for Map Display Type 1. Refer to the appropriate chapter for frequency, amplitude, and setup parameters. • NBFM, “Transmitter Analysis Setup” on page 2-2 • P25, “Over the Air (OTA) Analysis Setup”... -
Page 194: Measurement Mapping
9-7 Measurement Mapping Chapter 9 — Coverage Mapping 5. Press the Legend Setup submenu key to set the threshold values for the selected measurement. Set the threshold levels for Excellent, Very Good, Good, Fair, or Poor. Then press the Back button. 6. -
Page 195: Save The Coverage Mapping Information
Chapter 9 — Coverage Mapping 9-7 Measurement Mapping Save the Coverage Mapping Information Coverage Mapping has three save options: “Save KML Points”, “Save Tab Delimited Points” on page 9-16, or “Save JPG” on page 9-17. Save KML Points Press Save/Recall Points/Map then Save KML Points. At the Save menu, press Enter. The following information is saved for the points that are currently displayed on the screen: •... - Page 196 9-7 Measurement Mapping Chapter 9 — Coverage Mapping Figure 9-7. Coverage Mapping KML File in Google Earth Save Tab Delimited Points Press Save/Recall Points/Map then Save Tab Delimited Points. At the Save menu, press Enter. A tab delimited text file (.mtd) is saved in the default save location for the coverage mapping data that are currently displayed on the screen.
- Page 197 Chapter 9 — Coverage Mapping 9-7 Measurement Mapping Save JPG Press Save/Recall Points/Map then Save JPG. At the Save menu, press Enter. A .jpg file of the current screen is saved. Figure 9-8. Time Interval Coverage Mapping Saved as a .jpg File Land Mobile Radio MG PN: 10580-00243 Rev.
-
Page 198: Measurements With Graph Display Type
9-8 Measurements with Graph Display Type Chapter 9 — Coverage Mapping Measurements with Graph Display Type In the Coverage Mapping menu, set the Display Type to Graph. Two graphs are displayed. Tap a graph to make it active (surrounded by a red bounding line). Procedure to Monitor Base Station Synchronous Channel Decoding 1. - Page 199 In the Point Distance/Time menu, press the Repeat Time submenu key, and then enter a value by using the numeric keypad. A Time menu provides submenu keys for the units, from hour to µs. Anritsu recommends that this value be set to equal or exceed 3 seconds.
-
Page 200: Explanation Of Graph
9-8 Measurements with Graph Display Type Chapter 9 — Coverage Mapping Explanation of Graph The graphs shown in Figure 9-9 on page 9-18 display BER versus Time and EVM versus Time for a weak signal from a TETRA base station. With this weak signal, the EVM is quite high, approximately 50 %. -
Page 201: Coverage Mapping Menus
9-9 Coverage Mapping Menus Coverage Mapping Menus Refer to the appropriate LMR Master Analyzer chapters for the other menus, including Frequency, Amplitude, and Setup. Menu maps typically display all possible submenu keys, although some keys are displayed on the instruments only under special circumstances (refer to menu descriptions on the following pages). -
Page 202: Coverage Mapping Menu
9-10 Coverage Mapping Menu Chapter 9 — Coverage Mapping 9-10 Coverage Mapping Menu Key Sequence: Measurement > ... Coverage Coverage Mapping Save/Recall Save/Recall Map Points: Opens the “Mapping Save/Recall Menu” on page 9-24. Points/Map Mapping Type: Select the measurement parameter to be mapped and Mapping Type displayed in the bar graph. -
Page 203: Legend Setup Menus
Chapter 9 — Coverage Mapping 9-11 Legend Setup Menus 9-11 Legend Setup Menus Key Sequence: Measurement > ... Coverage > Legend Setup RSSI Mod Fod SINAD Excellent >= Excellent <= Excellent <= Excellent <= Excellent >= Excellent <= -70.0 dBm 1.00 % 15.50 % 1.00 %... -
Page 204: Mapping Save/Recall Menu
Save Recall a Map: Opens the Recall menu for selecting a map created with the Anritsu easyMap Tools program to display on the screen. Recall KML Point: Opens the Recall menu for selecting a .kml file. Displays the saved locations overlaid on the default grid. -
Page 205: Point Distance/Time Setup Menu
Chapter 9 — Coverage Mapping 9-11 Legend Setup Menus Point Distance/Time Setup Menu Key Sequence: Measurement > ..Coverage > Point Distance/Time Setup Repeat Type: Toggles between using a Time or Distance interval for capturing data. Points Distance/Time Repeat Time: Sets the time interval when the Time is selected in the Repeat Repeat Type Type button. -
Page 206: Sweep Menu
9-12 Sweep Menu Chapter 9 — Coverage Mapping 9-12 Sweep Menu Key Sequence: Shift > Sweep (3) key Sweep Run/Hold: This submenu key toggles between continuous (run) sweep and hold sweep. In Run sweep mode, sweeps are continuous, and a Sweep sweep starts immediately after the previous sweep is completed. -
Page 207: Appendix A-Error Messages
Appendix A — Error Messages P25/P25p2, NXDN, TETRA, DMR 2 and PTC Messages This Appendix provides a list of P25, NXDN, TETRA, DMR 2, and PTC error messages. Self Test and General Operation error messages are in the User Guide. Notifications 1. -
Page 208: Data Logging Errors
A-1 P25/P25p2, NXDN, TETRA, DMR 2 and PTC Messages Appendix A — Error Messages Data Logging Errors 1. Error Making Directory On USB, Verify Media is Installed. A USB flash drive is not connected to the USB port or the device is not recognized. Try to connect again, use a different USB flash drive, or reformat the USB flash drive on a Warning All data on a USB flash drive will be erased if it is reformatted. -
Page 209: Index
NBFM ..... . 2-14 Anritsu, contact ....1-1 NXDN . - Page 210 R to W symbol deviation ..3-9, 4-9, 5-9, 7-9 graphs ..... . . 8-4 symbol rate error .
- Page 212 Anritsu Company 490 Jarvis Drive Anritsu prints on recycled paper with vegetable soybean oil ink. Morgan Hill, CA 95037-2809 http://www.anritsu.com...
Need help?
Do you have a question about the LMR Master and is the answer not in the manual?
Questions and answers