
Subscribe to Our Youtube Channel
Related Manuals for Newport 1919-R


Summary of Contents for Newport 1919-R
- Page 1 1919-R 1919-R Laser Power/Energy Meter User Manual Newport Corporation www.newport.com...
-
Page 2: Table Of Contents
Using 1919-R with Thermopile Type Sensors ............ 8 2.2.2 Using 1919-R to Measure Laser Power.............. 8 2.2.3 Using 1919-R to Measure Single Shot Energy ........... 8 Photodiode Sensors ....................... 8 2.3.1 Using 1919-R with Photodiode Type Sensors ............ 8 2.3.2 Setting the Measurement Parameters .............. - Page 3 Pyroelectric Sensors – Method of Operation .............. 42 Photodiode Energy Sensors – Method of Operation ..........42 Measuring Pulses of High Energy Density ..............43 Operation of 1919-R with Pyroelectric and Photodiode Energy Sensors....43 7.4.1 Zeroing the Energy Sensor Against the 1919-R Meter ........44 7.4.2...
- Page 4 12.1 Updating Sensor Calibration Factors ................91 12.2 Calibration of Thermopile Sensors ................91 12.2.1 Surface Absorbers .................... 91 12.2.2 Volume Absorbers ................... 92 12.2.3 Linearity and Accuracy of Newport Thermopile Sensors ........ 92 12.2.4 Updating Thermopile Sensor Calibration Factors ..........93 1919-R User Manual...
- Page 5 12.3.2 Accuracy of Calibration ..................98 12.3.3 Updating Photodiode Sensor Calibration Factors ........... 99 12.4 Calibration of Pyroelectric Sensors................100 12.4.1 Absorber Types Used in Newport Pyroelectric Measuring Sensors ....100 12.4.2 Calibration ..................... 101 12.4.3 Accuracy of Calibration .................. 101 12.4.4 Updating Pyroelectric Sensor Calibration Factors .........
-
Page 6: Introduction
You can also zero the 1919-R at the touch of a button. 1919-R is capable of logging data onto a USB Flash Drive (Disk On Key), as well as real-time reporting of data via USB to Newport’s PMManager application to display and process the... -
Page 7: Support
Introduction Support If you have a question or require further assistance, contact Newport customer support: North America Europe Asia Newport Corporation Service Newport/MICRO-CONTROLE S.A. Newport Opto-Electronics Dept. Technologies (Wuxi) Co., Ltd Zone Industrielle 1791 Deere Ave. Irvine, CA 92606 理波光电科技(无锡)有限公司... -
Page 8: Quick Reference
This toggling will be performed by briefly pressing the On/Off switch after the 1919-R has been switched on. 3. To switch the 1919-R off, press the On/Off switch and hold it for ~ 2 seconds until the display blanks. -
Page 9: Thermopile Sensors
Thermopile Sensors 2.2.1 Using 1919-R with Thermopile Type Sensors 1. Plug in the Thermopile sensor. 1919-R will reconfigure itself to work with the attached sensor. 2. All of the sensor’s measurement parameters are shown on the main screen. Use the Navigation keys to select and change the parameters. -
Page 10: Setting The Measurement Parameters
Pyroelectric or Photodiode Energy Sensors 2.4.1 Using 1919-R with Energy Sensors 1. Plug in the Pyroelectric/Photodiode energy sensor. 1919-R will reconfigure itself to work with the attached sensor. 2. All of the sensor’s measurement parameters are shown on the main screen. Use the Navigation keys to select and change the parameters. -
Page 11: Zeroing Instrument Against Sensor
Quick Reference 2.4.2 Zeroing Instrument against Sensor For most accurate calibration, you should zero the energy sensor against the 1919-R it is being used with: 1. Make sure the sensor is in a quiet environment and not subject to pulsed radiation. -
Page 12: Measuring Energy, Average Power, Or Exposure
2. Go to Graph Type and select Needle. Return to the main display screen. 3. To expand the needle graph ±5x of the present reading, press Zoom. Press Zoom again to return the needle range to full scale. 1919-R User Manual... - Page 13 3. Set the percentage range of the scale to be displayed to the desired setting. 4. Set the number of readings to display as necessary. 5. Press Reset to clear the Min/Max tracking and to restart the graph. 6. This is especially useful when measuring pulses of low frequency lasers. 1919-R User Manual...
-
Page 14: Math Functions
Logging Data to a File for Upload to PC You can log your measurement data to a file for upload to PC by connecting an external storage device to the USB port of the 1919-R meter. For details, see Logging Data to a File for Upload to... -
Page 15: Using The 1919-R Display Unit
You can also zero the 1919-R at the touch of a button. 1919-R is capable of logging data onto a USB Flash Drive (Disk On Key), as well as real-time reporting of data via USB to Newport’s PMManager application to display and process the... -
Page 16: 1919-R Display Unit Components
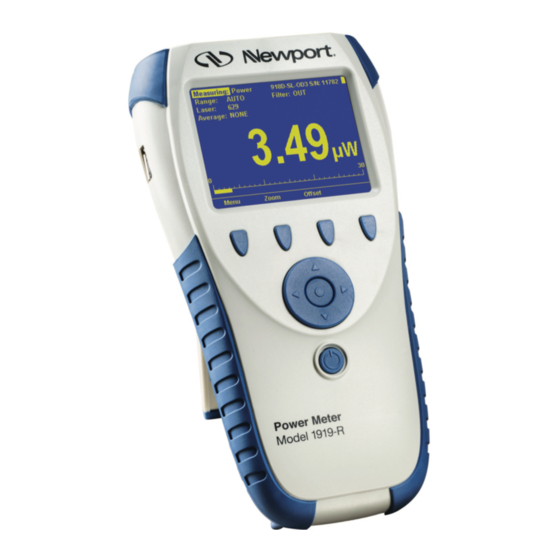
Using the 1919-R Display Unit 1919-R Display Unit Components Figure 3 -1 below displays the 1919-R display unit, displaying the main screen with some sample measurements. Figure 3 -1 1919-R Meter/Display Unit – Front View The 1919-R is equipped with: ... -
Page 17: 1919-R Hardware Components/Interfaces
3.3.1 Sensor Input The Sensor Input, located in the center of the 1919-R real panel, is the socket where you insert the 15 pin D type connector of the measuring sensor cable in order to connect the sensor to the ... -
Page 18: Lcd Display And Backlight
Using the 1919-R Display Unit 3.3.2 LCD Display and Backlight The 1919-R screen is a QVGA 320x240 pixel color TFT LCD. It can be driven in one of two full color modes or in one. The LCD backlight is actually a set of LEDs that illuminate the display from behind. Because the 1919-R uses a TFT color display, the backlight must be constantly on. -
Page 19: Charger Input
3.3.6 Charger Input The 1919-R can be operated either by the internal battery or from an AC source with the charger plugged in all the time. Plug the charger into the jack labeled "12VDC" on the rear panel (see ... -
Page 20: Analog Output
Figure 3 -7 1919-R Rear Panel View Note: The charger circuit of the 1919-R is designed to allow the charger to be plugged in for an extended period without causing damage to the battery. The approximate time between charges is given in... -
Page 21: Rs232 And Usb Outputs
10 times per second with the latest pulse energy. 3.3.8 RS232 and USB Outputs The 1919-R is equipped for either RS232 or USB communications with PC. The Unit is supplied with ... - Page 22 Menu button and select Instrument.) 3. Change the setting with the up (↑) /down (↓) Navigation keys and press the Enter key to save. The 1919-R automatically saves the current settings for the next power up. 1919-R User Manual...
- Page 23 Using the 1919-R Display Unit Table 3 -2 1919-R Instrument Settings Parameter Description RS232 Baud Set the baud rate for RS232 PC communication. Options include: 115200 57600 38400 19200 Max An. Output Select the voltage of analog output for full scale measurement.
-
Page 24: Field Upgrade - Updating The 1919-R Firmware
3 -9 1919-R Field Upgrade Wizard 3.4.3 Clock Settings The 1919-R is equipped with a real time clock which shows the date and time. This clock also allows the 1919-R to query the sensor attached and notify you if the sensor is due for calibration. -
Page 25: Zero Adjustments
To zero the instrument: 1. Disconnect the sensor, turn the instrument off and then back on again, so the 1919-R can identify that no sensor is connected. An "Initializing" message will be displayed. 2. Let the 1919-R run for at least 30 seconds before performing zero adjustment. Make sure the sensor is in a quiet environment (without electrical noise) and not subject to pulsed radiation. -
Page 26: Line Frequency
2. Set to 50Hz or 60Hz, depending on the electrical power grid of the area that you are in. 3. Press the Enter key to save the new setting. 3.4.6 Language The 1919-R display can be configured to one of several languages (English, Japanese, Russian, or Chinese). To set the user interface language for the instrument: 1. -
Page 27: Measurement Screens (Graph Types)
Using the 1919-R Display Unit 3.4.7 Measurement Screens (Graph Types) The 1919-R measurement screens are available in a variety of graphical displays, as described in Table 3 -3 below (click the links to view more details): Table 3 -3 1919-R Measurement Screens (Graph Types) -
Page 28: Color Scheme
Choose one of the monochrome schemes for use with protective goggles that filter out visible wavelengths. Screen captures of the 1919-R in this manual are shown in the various color schemes. For example, the following sensor displays: ... - Page 29 Monochrome schemes are for use with lasers that demand protective glasses that filter out colors in the visible part of the wavelength spectrum. These color schemes apply to all of the screens. All color-enhanced features of the 1919-R will not be functional in any of the monochrome screens. Follow the...
-
Page 30: 1919-R Screen Layout
1919-R Screen Layout The 1919-R screen display is carefully designed to provide easy reading of the laser measurement, quick access to configuration parameters, as well as the ability to set up for more advanced work. ... -
Page 31: Points To Consider
1919-R will help you implement the answers to these questions. The following chapters describe the measurement functionality of the various sensor types, the graphical displays of the 1919-R meter, as well as the data logging and math processing capabilities that make the 1919-R meter the complete answer to your measurement needs. -
Page 32: Thermopile Sensors
On power up, the 1919-R meter checks its own memory as well as the sensor’s to decide on the measurement configuration. For example, if in the last session, the sensor was used to measure power in the Bargraph screen in autoranging with a YAG laser and averaging for 10 seconds, this will be the setup used the next time the system is powered up. -
Page 33: Operation Of 1919-R With Thermopile Absorber Sensors
To use 1919-R with Thermopile sensors: 1. Connect the Thermopile sensor to the 1919-R meter: Insert the 15 pin D type connector of the measuring sensor cable into the socket marked Sensor Input on the rear panel of the 1919-R meter. -
Page 34: Measuring Laser Energy With Thermopile Sensors
Low. If the 1919-R is used in a noisy environment or where there is a high level of background thermal radiation, the instrument may trigger spuriously on the noise or background radiation. -
Page 35: Measuring Pulses Of Very Low Energy
4 times the threshold level. 5. When the 1919-R screen flashes READY on and off, fire the laser. The display will go blank while the energy is being integrated. After about 2-4 seconds (depending on the sensor), the correct energy will be displayed. -
Page 36: Measuring Energy Of Rapidly Repeating Pulses
Low. If the 1919-R is used in a noisy environment or where there is a high level of background thermal radiation, the instrument may trigger spuriously on the noise or background radiation. -
Page 37: Pulsed Power Limitations
Thermopile Sensors 6. When the 1919-R screen flashes READY on and off, fire the laser. The display will go blank while the energy is being integrated. After about 2-4 seconds (depending on the sensor), the correct energy will be displayed. -
Page 38: Photodiode Sensors
The 1919-R display unit amplifies this signal and indicates the power level received by the sensor. Due to the superior circuitry of the 1919-R, the noise level is very low. As such, Newport sensors with the 1919-R display have a large dynamic range from nanowatts to hundreds of milliwatts. -
Page 39: Operation Of 1919-R With Photodiode Sensors
To use 1919-R with Photodiode sensors: 1. Connect the Photodiode sensor to the 1919-R meter: Insert the 15 pin D type connector of the measuring sensor cable into the socket marked Sensor Input on the rear panel of the 1919-R meter. - Page 40 (The reading is displayed in watts.) This change only occurs after a few seconds delay. This provides overlap (hysteresis) to keep the 1919-R from flipping back and forth when reading close to the end of the scale.
-
Page 41: Averaging And Measuring Very Low Power Measurements
6 -2 Photodiode Bargraph Averaging and Measuring Very Low Power Measurements If the laser power is fluctuating, the 1919-R can display the average power readings with averaging periods varying from 1s to 1 hour. When measuring very low powers, such as picowatt measurements, there will be a rather large zero offset coming from the detector as well as a considerable noise fluctuation. -
Page 42: Exposure Limitations
When measuring exposure, the following functions are enabled/disabled: Average, Offset, Reference, and Density are grayed out (disabled). Scale Factor is accessible (enabled). It is also not be possible to record log files of Exposure measurements. 1919-R User Manual... -
Page 43: Pyroelectric And Photodiode Energy Sensors
They can measure low energies as well as high. They can also measure at higher repetition rates than was possible before. The 1919-R meter amplifies this signal and indicates the energy received by the sensor as well as the frequency at which the laser is pulsing. Using the energy and frequency information, 1919-R is also able to display average power. -
Page 44: Measuring Pulses Of High Energy Density
Operation of 1919-R with Pyroelectric and Photodiode Energy Sensors On power up, the 1919-R meter checks its own memory as well as the sensor’s to decide on the measurement configuration. For example, if in the last session, the sensor was used to measure energy in the Bargraph screen in the 200uJ range with a 1064 laser with no averaging, this will be the setup used the next time the system is powered up. -
Page 45: Zeroing The Energy Sensor Against The 1919-R Meter
After this is done, the sensor is “conditioned” to work with the particular 1919-R the zeroing was done against. It is not necessary to do this procedure again unless the 1919-R is used with a different sensor. If the procedure is not done, errors of 2% or so can occur. - Page 46 If the sensor does not read the pulses at all on the lowest range, try to lower the threshold to minimum. 6. Set Average to the period you wish to average power over, or set to NONE to disable. Figure 7 -3 Pyroelectric Energy Needle with Average Selection Open 1919-R User Manual...
-
Page 47: Energy, Average Power, Or Exposure Measurement
The Pyroelectric sensor is capable of measuring pulses up to very high repetition rates on the order of kilohertz or higher. The 1919-R meter will sample pulses at up to 25,000 pulses depending on the sensor. However, the display can only display at rates up to 10Hz. -
Page 48: Measuring Average Power
Average Power = Average Energy X Frequency where the energy and frequency of the pulses have been measured by 1919-R. Note: 1919-R use when measuring power is the same as when measuring energy and has been described in full in section Operation of 1919-R with Pyroelectric and Photodiode Energy Sensors. - Page 49 4. To stop exposure measurement before the chosen period, press Stop. 5. To reset the reading to zero before another reading, press Reset. 6. To return to the main energy measurement screen, set Mode to Energy. Figure 7 -6 Pyroelectric Exposure Measurement 1919-R User Manual...
-
Page 50: Graphical Displays
Graphical Displays The 1919-R has a robust variety of customizable graphical displays for measuring, presenting, and reading data. The 1919-R can operate in the standard power/energy measurement screen or needle type display or can display the information in specialized forms: an attenuation screen, a tune/exposure screen, a power/energy density screen, a screen normalized to some value or a screen with limits. -
Page 51: Display Settings
Display settings screen, where you can set the display of the main 1919-R measurement screen to present the data in a variety of graphical formats when connected to a particular sensor. You can access this screen by pressing Menu > Display. -
Page 52: Bargraph
Offset again to cancel. For more details, see Offset. See also Measuring Loss Using the dB Offset Function. 8.2.1 Modes The Modes that a Bargraph can be used with include: Power Energy Pulsed Power 1919-R User Manual... -
Page 53: Zoom
In this case, the true power is 20.5 - 0.1 = 20.4 mW. To subtract the background, press Offset while the laser is blocked. The 1919-R will now read zero (0.0), and the 0.1 mW background will be subtracted from all subsequent readings. The laser power reading will thus be 20.4 mW. -
Page 54: Measuring Loss Using The Db Offset Function
Offset twice. The first press will cancel the old value, and the second will activate a new value. If you suspect that 1919-R has a permanent zero offset, the instrument’s internal zero should be reset. See Zero Adjustments. -
Page 55: Bargraph Style
8.2.5 Bargraph Style In addition to the large digital readout, on the main power screen of the 1919-R there is a bargraph that graphically displays what percentage the present reading is of full scale. This bargraph can be given enhanced functionality when in full color mode (for example, when the Color Scheme is set to Color 1 or Color 2). - Page 56 You can set the Bargraph Style to Standard for a simple bargraph in full scale, using the procedure above. Select Standard instead of Changing. (The Levels options are disabled.) Figure 8 -13 Bargraph Style Set to Standard 1919-R User Manual...
-
Page 57: Analog Needle
Parameter settings, the sensor’s name and serial number, and battery status indicator at the top of the screen. Needle graph displayed prominently in the middle of the screen. Large numeric display. Soft key legends at the bottom of the screen (for example, Menu, Zoom, Offset, Persist). 1919-R User Manual... -
Page 58: Modes
Press the Persist key to continue to display previous readings as well as to show the minimum and maximum measurements. Figure 8 -16 Pyroelectric Energy Needle with Persistence 1919-R User Manual... -
Page 59: Line Graph
4. Set the horizontal sweep (X-Axis) time as necessary. 5. Press Reset to clear the Min/Max tracking and to restart the graph. 8.4.1 Modes The Modes that Line graphs can be used with include: Power Energy Pulsed Power 1919-R User Manual... -
Page 60: Percentage Range (Y-Axis Scale)
Adjusting the X-axis (horizontal sweep time) allows you to select how much data is displayed on the screen before it wraps around to the beginning. Press the time key to set the Y-Axis Scale to the desired setting. Figure 8 -19 Time Settings on Line Graph 1919-R User Manual... -
Page 61: Reset
Max, Min, Average, Standard Deviation, and Over values on upper left and right above graph. Large numeric display. Soft key legends at the bottom of the screen (for example, Menu, Offset, Reset). 1919-R User Manual... -
Page 62: Modes
Upper limit, Lower Limit on upper left above the graph. Out-of-range warning (OVER/UNDER) on upper right above the graph. Large numeric display. Soft key legends at the bottom of the screen (for example, Menu, Upper, Lower). 1919-R User Manual... -
Page 63: Modes
Color Scheme has been set to one of the full color options, then this will be displayed in RED, along with the reading itself (as shown in Figure 8 -25 below). Figure 8 -25 Photodiode Pass/Fail - Modify Upper Limit 1919-R User Manual... -
Page 64: Exposure (For Pyroelectric Sensors)
4. Press Manual (the rightmost soft key) and use the Navigation keys to select the options to end the exposure measurement (see Manual, Timeout, Pulses). 5. Press Reset to stop the exposure measurement and reset the total, pulse counter, and elapsed time to 0. 1919-R User Manual... -
Page 65: Modes
Exposure can be measured with Photodiode sensors as well. The following are the differences between measuring Exposure with Pyroelectric Energy Sensors and Photodiode Sensors: Photodiode sensors actually measure power and sum the results into energy. There is no After Pulses option with Photodiode Sensors. 1919-R User Manual... -
Page 66: Pulse Chart
The readings are shown as bars with lengths proportional to the measurement. Soft key legends at the bottom of the screen (for example, Menu, Percentage Range (Y-Axis), Number of Pulses, Reset). 1919-R User Manual... -
Page 67: Modes
5. Press Reset to clear the Min/Max tracking and to restart the graph. (For more details, see Reset). 8.8.1 Modes The Modes that Pulse Charts can be used with include: Power Energy Pulsed Power Other Display Settings Additional display settings include: Show/Hide Settings Color Scheme 1919-R User Manual... -
Page 68: Show/Hide Settings
5. Press the Enter key to save the settings. 8.9.2 Color Scheme You can select the color scheme of the 1919-R display. This is especially useful for operation when wearing protective goggles that filter out visible wavelengths. You can configure the 1919-R for full color or monochrome functionality. Choose full color to make use of special color enhancements. - Page 69 Graphical Displays Screen captures of the 1919-R in this manual are shown in the various color schemes. For example, the following sensor displays: Figure 8 -34 Thermopile Sensor Figure 8 -35 Photodiode Sensor Figure 8 -36 Pyroelectric Sensor...
- Page 70 Monochrome schemes are for use with lasers that demand protective glasses that filter out colors in the visible part of the wavelength spectrum. These color schemes apply to all of the screens. All color-enhanced features of the 1919-R will not be functional in any of the monochrome screens. Follow the...
-
Page 71: Math Functions
Figure 9 -2 on the right shows the Function and Pass/Fail settings (displayed after the Right Arrow has been pressed). Figure 9 -2 Function Settings Figure 9 -1 Main Measurement Screen Functions 1919-R User Manual... -
Page 72: Functions Screen
Also, many of them can be combined. For example, to see the power density of a laser beam after it has gone through a beam splitter. (In 1919-R, these factors can be kept and applied in the graphical displays as well.) ... -
Page 73: Fixed Offset
9 -5 Modifying Fixed Offset Scale Factor You can set the factor by which to multiply further measurements. Use this to factor up the value that the sensor has measured. This is very useful when working with beam splitters with sensitive 1919-R User Manual... - Page 74 3. Set to value by which to multiply all subsequent measurements. Press the Enter key. The Scale Factor can be between 0.00001 and 9999 only positive. (Click Clear to zero the value.) Figure 9 -6 Modifying Scale Factor 1919-R User Manual...
-
Page 75: Normalize
When Normalize is applied, measurements are displayed dimensionless; that is to say, without the W or J symbols. They are shown as the result of the present reading/reference value. Figure 9 -7 Modifying Reference 1919-R User Manual... -
Page 76: Density
4. After the shape (Rectangle or Circle), select the size (Height and Width, or Diameter). Size parameters can range from 0.1mm to 100.0mm. The measurements will be shown as cm² on the graphical display on the main measurement screen. Figure 9 -9 Measurement of Power Density in nW/cm 1919-R User Manual... -
Page 77: Function Limitations
For sensors in Exposure mode, Average, Normalize, and Density are disabled. If Normalize is active, then Density is disabled. If Density is active, then Normalize is disabled. If the present Power Range is dBm, then Normalize is disabled. 1919-R User Manual... -
Page 78: Logging Data To A File For Upload To Pc
“External storage device not available.” If a Disk on Key is found, 1919-R will look for a directory called “Log Files” in the root directory of the Disk on Key, and if not found, 1919-R will create it. 1919-R will then set “Log Files” as the active directory. -
Page 79: Setting Logging Parameters For The Various Stop Modes
1. In the Log Setup screen, go to Stop Mode and select an option (click the links for more details): Manual: to manually stop logging. After Timeout: to stop logging after a predetermined period of time. After Measurements: to stop logging after a specified number of measurements. 1919-R User Manual... -
Page 80: Manual Mode
Sample Rate: Enables you to control the number of readings that will be added to the log. Options include: Every Reading 1 of 3 Readings 1 of 10 Readings 1 of 30 Readings 1 of 100 Readings 1 of 300 Readings 1 of 1000 Readings 1919-R User Manual... -
Page 81: After Timeout
To set the Stop Mode to After Timeout: 1. In the Log Setup screen, set the Stop Mode to After Timeout. The Log Setup screen displays the following parameters: Figure 1 0-6 After Timeout - Stop Mode 1919-R User Manual... - Page 82 Options include: Sample: Logs only the last reading that was measured. Average: Stores the average of all of readings that have been measured since the previous data has been added to the log. 1919-R User Manual...
-
Page 83: After Measurements
Sample Rate. Enables you to control the number of readings that will be added to the log. Options include: Every Reading 1 of 3 Readings 1 of 10 Readings 1 of 30 Readings 1 of 100 Readings 1 of 300 Readings 1 of 1000 Readings 1919-R User Manual... -
Page 84: Start Logging
3. When the log is completed, the display will stop updating and a Log Summary appears. The following will be displayed in a message box in the display area: Log file name Total readings Number of overrange Maximum Minimum Average 1919-R User Manual... -
Page 85: Displaying Logged Data
Log Setup screen and selecting the relevant file. Pressing the Files key in the Log Setup screen will open the Log File Selection screen. 1919-R will open the “Log Files” directory on the Disk On Key and list all files of the format serial_number_xx.txt. - Page 86 2. Use the right and left arrows to scroll through the columns of file names. Use the up and down arrows to scroll through the files of the present column. When reaching the bottom of the column, scrolling down will return to the top of the column. 1919-R User Manual...
- Page 87 This means that the average in the statistics in the log file may be three averages calculated on top of each other, moving average then periodic average then full average. Make sure that what you configure is sensible. 1919-R User Manual...
-
Page 88: Viewing The Log File On Your Computer
Logging Data to a File for Upload to PC 10.5 Viewing the Log File on Your Computer In addition to reviewing the logged data on 1919-R, you can also upload the data for review at your workstation. To view the log file on your computer: 1. -
Page 89: Circuit Description
11.1.2 Fast Analog Input In addition to the above basic analog circuit, the 1919-R contains a second fast analog input. This supports certain Newport sensors that read energy pulses at higher rates than can be supported by the basic analog circuit, but provides less overall accuracy than the above circuit. The fast analog input consists of an EMI filtered voltage input that is passed to a first stage of mild voltage attenuation. -
Page 90: Emi Protection
Circuit Description 11.2.2 EMI Protection The digital processor circuit and the whole 1919-R instrument are protected by EMI protection component on all signals that pass in and out of the box. In addition, EMI protection is added internally to prevent disturbances to the normal functioning of the instrument. The instrument meets the requirements of the European Community with respect to electromagnetic compatibility and has the “CE”... -
Page 91: Calibration, Maintenance, And Troubleshooting
Note: All calibration factors are dependent on the currently active set of configuration parameters. In addition to NIST traceable factory calibration, Newport sensors can be field calibrated by the user. Note: Modifying calibration factors will affect the sensor’s performance and should be performed by qualified personnel only. -
Page 92: Updating Sensor Calibration Factors
12.2.1 Surface Absorbers BB (Broadband) Absorber On standard, high power density, broadband Newport power monitor sensors, a special refractory coating is used to provide high absorptivity from the UV through the IR. This coating can withstand very high power densities, up to 28 kW/cm², without changing calibration. The absorption of this ... -
Page 93: Volume Absorbers
The linearity of most Newport Thermopile detectors is specified to be 1% over the specified power range of each particular instrument and is tested by Newport from time to time. The linearity is generally tested against another sensor that has been NIST tested for linearity. For those models for which the linearity is not tested over their entire range, randomly chosen sample models are tested periodically over their entire range. -
Page 94: Updating Thermopile Sensor Calibration Factors
6. Press Save to save the settings and return to the main Measurement screen, which now displays the updated calibration factor values. 7. Press Exit to return to the Menu screen. 1919-R User Manual... - Page 95 (erroneous power readings above 100% full scale). Affects power and energy readings. Thermopile sensors are slow in their response to a laser hitting them. 1919-R contains software that algorithmically “speeds up” the response. Response tweaking is a feature that Newport provides for users to tailor this to their application.
- Page 96 Response tweaking works by the user seeing how long it takes to rise from 0 to the expected power and if there is overshoot or undershoot. The screen displays Scaling in progress. Figure 1 2-11 Scaling Begins 1919-R User Manual...
- Page 97 After the scaling is completed, the screen displays “Block laser until power is close to 0”. Figure 1 2-12 Scaling Completed 3. Press Next. Figure 1 2-13 Response Calibration Factor 4. Adjust the Response Factor and press Next. Figure 1 2-14 Modifying the Response Calibration Factor 1919-R User Manual...
- Page 98 90%. 100% is drawn at about 75% of the full height of the graph to allow the user to see the overshoot, if there is any. 7. Press Finish to save the Response factor. 8. Press Back to change and test again. (Repeat steps 5-7 above.) 1919-R User Manual...
-
Page 99: Calibration Of Photodiode Sensors
12.3 Calibration of Photodiode Sensors 12.3.1 Method of Factory Calibration The sensitivity of various Newport Photodiode sensors can vary from one to another as well as with wavelengths. Therefore, Newport Photodiode detectors are individually calibrated against NIST traceable standards over the entire operating range of wavelengths for both filter out and filter in. -
Page 100: Updating Photodiode Sensor Calibration Factors
Figure 1 2-19 Information Screen for Photodiode Sensors 3. Press Continue to activate calibration. The main Measurement screen appears, displaying the Calibration Factor value (on the left). Figure 1 2-20 Calibration Activated on Main Measurement Screen 1919-R User Manual... -
Page 101: Calibration Of Pyroelectric Sensors
12.4 Calibration of Pyroelectric Sensors 12.4.1 Absorber Types Used in Newport Pyroelectric Measuring Sensors The main absorber surface types used in Newport Pyroelectric measuring sensors include: Metallic Type: The type with no suffix in the name have a partially reflective multilayer metallic coating which absorbs approximately 50% and whose absorption graph is shown in ... -
Page 102: Calibration
1 2-23 Absorption of Newport Pyroelectric Absorbers 12.4.2 Calibration The sensitivity of the various Newport Pyroelectric sensors can vary from one to another as well as with wavelengths. Therefore, Newport Pyroelectric detectors are individually calibrated against NIST traceable standards. In addition, there is a wavelength sensitivity correction curve in the meter. -
Page 103: Updating Pyroelectric Sensor Calibration Factors
3. Press Continue to activate calibration. The main Measurement screen appears, displaying the relevant Overall Factor value (on the left). Overall Factor: Available for all Pyroelectric sensors. Changes the overall calibration factor of the sensor. This will affect readings for all laser settings. There is an overall calibration 1919-R User Manual... - Page 104 6. Press Save to save the settings and return to the main Measurement screen, which now displays the updated Overall Factor. Figure 1 2-28 Updated Overall Factor for Pyroelectric Sensors 7. Press Exit to return to the Menu screen. 1919-R User Manual...
-
Page 105: Error Messages
Low Battery: When the battery is almost discharged, the Battery icon will have only 1 segment left. This means the battery is ¾ empty. At this stage, the 1919-R should be connected to the charger. It will operate normally and charge while connected to the charger. -
Page 106: Thermopile Sensors, Power
Sensor is mounted to stand using insulated plastic rod provided with instrument, and not metal rod. Instrument shows frequency which is 1. Try keeping the cable away from the bench. too high 2. Move the sensor/display further away from EMI. 1919-R User Manual... -
Page 107: Maintenance
Sensor Specifications. 3. Using a multimeter set to current, unplug the sensor from the 1919-R and check that this current appears between pin 1 and 9 of the D type plug. 12.7.2 Battery Replacement If the 1919-R battery is defective and does not hold a charge, contact your Newport representative. -
Page 108: 1919-R Specifications
114W x 41D x 212H Mass 470g Display 320x240 pixel TFT LCD; Active area 70x52mm approx. Display digit height 15mm LCD lighting LED’s. Operates from charger or battery. Lighting level can be adjusted between 3 levels using on/off button. 1919-R User Manual... - Page 109 Thermopile/Photodiode 17, Pyroelectric 15 With high backlight: Thermopile/Photodiode 15, Pyroelectric 13 Note: Battery charge will be depleted faster if a USB Flash Drive is left plugged in the 1919-R meter Data Logging Log period 1 sec to 1000 hours Max points stored onboard...
-
Page 110: Sensor Specifications
Int Sph PD 919P-003-10 1000W/cm² 919P-010-16 28KW/cm² 919P-020-12 4(20)W 23KW/cm² 919P-030-18 20KW/cm² 919P-050-18HP 0.5KW/cm² PF-DIF 919P-050-26 50(150)W 12KW/cm² 919P-040-50 35(150)W 12KW/cm² 919P-150-26 150W 12KW/cm² 919P-250-35 250W 10KW/cm² 919P-500-65 500W 7KW/cm² 919P-5KW-50 5000W 2KW/cm² 919E-20U-10-20K 50mW 50W/cm² 919E-200U-8-25K 30W/cm² PE-ES 1919-R User Manual... - Page 111 BF – Very high damage threshold, long pulses ES – Extra Slim Table 1 3-3 Maximum Energy Densities for Various Absorbers (Single Pulse) Absorber Max Energy Density J/cm² Type Pulse Length 10ns 1µs 300µs PE Metallic PE-DIF 1919-R User Manual...
- Page 112 Figure 1 3-1 Pulsed Laser Damage Threshold for Thermopile Sensors Figure 1 3-2 Pulsed Laser Damage Threshold for Pyroelectric Sensors 1919-R User Manual 14 February 2019 Rev 1.28-2 For the latest version, please visit our website: www.newport.com 1919-R User Manual...
Need help?
Do you have a question about the 1919-R and is the answer not in the manual?
Questions and answers