
Related Manuals for NARDA SRM-3000


Summary of Contents for NARDA SRM-3000
- Page 1 ® Advanced Test Equipment Rentals www.atecorp.com 800-404-ATEC (2832) SRM-3000 Selective Radiation Meter Operating Manual...
- Page 3 SRM-3000 Selective Radiation Meter 300X/XX, Series C ... Operating Manual...
- Page 4 Please direct all enquiries to your local sales company. Narda Safety Test Solutions GmbH Sandwiesenstr. 7 72793 Pfullingen, Germany © 2007 Order no.: 3001/98.21 Edition : 11/07.06, C ... Previous edition: 10/06.11, C ... Subject to change without notice. Our normal guarantee and delivery...
-
Page 5: Table Of Contents
Contents Introduction ........1-1 Application......1-1 About this instrument. - Page 6 Registering a non-Narda antenna ... 5-14 Registering a non-Narda cable....5-15 User interface ........6-1 Control elements .
- Page 7 “Safety Evaluation” mode ......7-1 “Safety Evaluation” mode functions... 7-1 Selecting the operating mode .
- Page 8 Setting the measurement range ....8-9 8.5.1 Setting the measurement range manually ..8-9 8.5.2 Search for the best measurement range ..8-10 Selecting the result type .
- Page 9 9.5.3 Using noise suppression (Noise Threshold) . . . 9-25 Selecting the result type ....9-27 Selecting the averaging parameters ..9-28 Selecting the UMTS demodulation algorithm (FAST/SENSITIVE) .
- Page 10 Isotropic measurements ......11-1 11.1 Measurements with a three axis antenna..11-2 11.1.1 Isotropic measurement with a three axis antenna .
- Page 11 Task of the “SRM-Tools” software ... 16-1 16.2 Connecting a PC to the SRM-3000 ..16-3 16.2.1 Serial interface connection ....16-4...
- Page 12 16.2.2 USB interface connection ....16-4 16.3 SRM configuration ..... . 16-10 16.4 Reading out the stored results from a SRM .
- Page 13 18.3.3 General specifications ....18-14 18.4 Single axis E-field antenna specifications (3531/01) ......18-16 18.4.1 Characteristics.
-
Page 15: Introduction
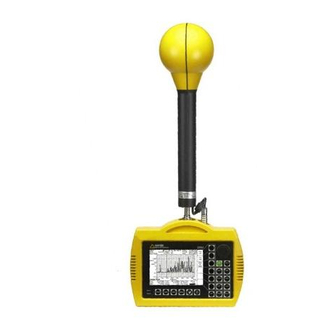
Various authorities have long defined limit values to protect users from excessive exposure to emissions. The SRM-3000 provides practically everyone who is concerned with this problem with a measuring instrument which, with the minimum of fuss, is capable not only of showing whether limit values are being adhered to or not, but also of allowing further analysis of the field components in relation to the overall exposure. - Page 16 1 Introduction SRM-3000 Fig. 1-1 The SRM-3000 in use...
-
Page 17: About This Instrument
SRM, Narda Safety Test Solutions GmbH also supplies various antennas as solutions to different applications and frequency ranges. These antennas have either three axes or a single axis. All Narda antennas can be mounted directly on the basic instrument or connected to it using a special RF cable. -
Page 18: About This Manual
SRM-3000 About this Manual The following is a standard text which explains the typographic conventions used in Narda documentation. Typographic conventions Some of the paragraphs in this Manual are marked with various symbols or headings to make it easier to read and understand. -
Page 19: Safety Instructions
⇒ Always carefully observe the measured value display when approaching unknown fields. ⇒ If you are in any doubt, use a warning device such as “RadMan” or “Nardalert” from Narda Safety Test Solutions to give warning of potentially hazardous field strengths. Unsuitable frequency range Dangerous fields can be overlooked if an unsuitable frequency range is selected. - Page 20 2 Safety instructions SRM-3000 Misinterpretation of results obtained with single axis antennas Only the field components which are parallel to the antenna axis will be detected by a single-axis antenna. Even if the field is strong, there is a danger that only a weak field or no field Danger at all will be measured if the antenna is not correctly positioned in the field.
-
Page 21: Ac Adapter / Charger
SRM-3000 2 Safety instructions Malfunction Metallic stickers placed on the (yellow) sensor area of the antenna can lead to measurement errors, particularly to an underestimation of the electromagnetic field strength. Caution ⇒ Stickers or labels of any type should only be affixed to the (black) antenna shaft. -
Page 22: Faults And Excessive Stresses
In such cases, contact the service center for your area. Disposal in accordance with local regulations The SRM-3000 is a high-quality instrument that will give you many years of reliable service. Nevertheless, even this product will eventually become obsolete. When that time comes, please remember that electronic equipment must be disposed of in accordance with local regulations. -
Page 23: Preparation For Use
Preparation for use Unpacking 3.1.1 Packaging The packaging is designed to be reused as long as it has not been damaged during previous use. Keep the original packaging and use it for all future transport of the instrument. 3.1.2 Checking the instrument for transport damage After unpacking, check the instrument and all accessories for any damage that might have occurred during transport. -
Page 24: Power Supply
AC Adapter / Charger as an alternative power supply. 3.2.1 Battery pack operation The SRM-3000 is operated from the battery pack supplied with the instrument. A fully charged battery pack is sufficient for about 4 hours operation. As supplied, the battery pack is only pre-charged and needs to be fully charged before it is used for the first time. -
Page 25: Handling The Battery Pack
3.2.3 Operation from AC Adapter / Charger The SRM-3000 can always be powered and operated from an AC Adapter / Charger connected to it. This is not recommended in practice, however, because the measurement characteristics can be affected considerably by the presence of the power supply cable in the field when the SRM-3000 is operated with the AC Adapter / Charger connected to it. -
Page 26: Switching The Instrument On And Off
✓ You have made sure that the battery pack is sufficiently charged for the planned measurement task. ⇒ Press the ON/OFF button for about 1 second. The SRM-3000 switches on. A green LED next to the “Status” label switches on. The function test runs. -
Page 27: Switching Off
SRM-3000 3 Preparation for use Fig. 3-2 Display after completion of function test (example) Note: The instrument reverts automatically to the default setting if you change the antenna: – Maximum input attenuation, i.e. least sensitive measurement range – Maximum frequency range Possible faults If a fault occurs during the function test, the message “Error detected during... - Page 28 3 Preparation for use SRM-3000 Notes:...
-
Page 29: Instrument Concept
Instrument concept SRM as a field strength meter The SRM is an instrument designed to measure electromagnetic fields in the frequency range from 100 kHz to 3 GHz. The main measurement task is the determination of field strength. Users can select from several operating modes, all of which are designed to give immediate, informative on-site results that require no further processing or evaluation. -
Page 30: Overall Concept
Cables can be used to connect the antenna to the basic instrument. The field strength measuring systems supplied by Narda Safety Test Solutions include a 1.5 m long cable. A 5 m long cable is available for special applications. -
Page 31: Antennas
Every Narda antenna is equipped with a control cable as well as the RF connection. The control cable is connected to the basic instrument by a... -
Page 32: Cable
SRM-3000 4.1.4 Cable Narda Safety Test Solutions offers two cables that can be used for the connection between the antenna and the basic instrument, covering the frequency range between 100 kHz and 3 GHz. These cables are 1.5 m and 5 m long and contain ferrite to reduce the effects of the external field on the measurement results. -
Page 33: Measurement Setup Variants
Measurement setup variants Variant overview The measurement setups for using a three axis and a single axis antenna are shown on the following pages. Measurement setup with three axis antenna: sec. 5.1.1, page 5-2 Measurement setup with single axis antenna: sec. 5.1.2, page 5-3 Both variants are considered with regard to their suitability for mobile applications (pendulum or sweep method) or for use in a precision measurement (matrix method). -
Page 34: Measurement Setup With A Three Axis Antenna
5 Measurement setup variants SRM-3000 5.1.1 Measurement setup with a three axis antenna Mobile measurement Precision measurement • Manual movement of • Measurement at various Measurement method antenna within the field points within the space • Sequential positioning of antenna at various... -
Page 35: Measurement Setup With A Single Axis Antenna
SRM-3000 5 Measurement setup variants 5.1.2 Measurement setup with a single axis antenna Note: The table below refers to customary antenna types. Two main types are considered: - broadband dipoles - loop antennas Mobile measurement Precision measurement (pendulum or sweep method) (matrix method) •... - Page 36 5 Measurement setup variants SRM-3000 Mobile measurement Precision measurement (pendulum or sweep method) (matrix method) • Spatial averaging of • Rapid determination of Usage limitations immissions not possible maximum values not • Underestimates strongly possible as a large elliptically polarized...
-
Page 37: Assembling The Measurement Setup
Fig. 5-1 N type connector RF input socket, 50 Ω (1) and multi pin type cable connector (2) Note: The multi pin connector is only used with Narda antennas and cables. It has two functions: • Automatic detection of the connected antenna and / or cable... -
Page 38: Fitting The Antenna Directly On The Basic Instrument
5 Measurement setup variants SRM-3000 Fitting the antenna directly on the basic instrument Connecting a Narda antenna ✓ The SRM is switched off. 1. Stand the basic instrument up vertically. 2. Place the N connector of the antenna over the N connector of the basic instrument. - Page 39 Fig. 5-3 Connecting the multi pin connectors The Narda antenna is now connected. The instrument will automatically detect the type of antenna that is connected. This information will be shown in the general instrument configuration section of the LCD panel when the instrument is switched on.
-
Page 40: Using A Cable To Connect The Antenna To The Basic Instrument
Connecting a Narda cable A Narda cable is connected in two stages: • Connect the Narda cable to the SRM • Connect the Narda cable to the Narda antenna Fig. 5-4 Connecting the SRM-3000 and antenna with a cable Connecting the Narda cable to the SRM ✓... - Page 41 This information will be shown in the general instrument configuration section of the LCD panel when the instrument is switched on. Connecting the Narda cable to the Narda antenna ✓ The SRM is switched off. 1. Place the N connector at the end of the cable over the N connector of the antenna.
- Page 42 5 Measurement setup variants SRM-3000 Connecting customary antenna types using a cable ✓ The SRM is switched off. 1. Stand the basic instrument up vertically. 2. Place the N connector of the cable over the N connector of the basic instrument.
-
Page 43: Fitting The Narda Antenna To A Tripod
SRM-3000 5 Measurement setup variants Fitting the Narda antenna to a tripod Special fittings are needed to attach Narda antennas to a tripod. Narda provides two different types of antenna holder. 5.5.1 Antenna holder for three axis antennas This antenna holder can be used to attach the antenna vertically or horizontally to the tripod. -
Page 44: Antenna Holder For Single Axis And Three Axis Antennas
5 Measurement setup variants SRM-3000 5.5.2 Antenna holder for single axis and three axis antennas This holder is used to precisely align the antenna in defined positions. This serves a dual purpose: • Single axis antennas can be aligned in three mutually perpendicular (orthogonal) directions one after the other by simple rotation, allowing you to make isotropic measurements easily (see sec. - Page 45 SRM-3000 5 Measurement setup variants 1. Screw the antenna holder plate on to the tripod. 2. Screw the antenna holder on to the antenna holder plate. 3. Open the Velcro strips and place the antenna in the holder so that the N connector and the control cable lie in the groove provided (see fig.
-
Page 46: Registering A Non-Narda Antenna
Registering a non-Narda antenna Note: Automatic detection of the connected antenna type is not possible if a customary antenna is used instead of a Narda antenna. You will need to manually register / select the connected antenna on the basic instrument in order to display the results in units of field strength or as a percentage of a selected safety standard. -
Page 47: Registering A Non-Narda Cable
Registering a non-Narda cable Note: Automatic detection of the connected cable type is not possible if a customary cable is used instead of a Narda cable. You will need to manually register / select the connected cable on the basic instrument in order to take the cable losses into account in the results. - Page 48 5 Measurement setup variants SRM-3000 Notes: 5-16...
-
Page 49: User Interface
User interface Fig. 6-1 Display and control elements Element Rotary control Softkeys Function keys Menu selection keys On / Off switch Status LED / Charge LED LCD panel Table 6-1 Display and control elements... -
Page 50: Control Elements
6 User interface SRM-3000 Control elements 6.1.1 On / Off switch Function ON/OFF On / Off switch. • Starts the instrument with the same settings as were active when it was last switched off. • Switches the instrument off (press key for longer time). -
Page 51: Softkeys
SRM-3000 6 User interface 6.1.3 Softkeys The softkey functions vary according to the menu that is displayed. The softkeys are operated using the row of keys on the right next to the display. 6.1.4 Function keys Note: Numerical entries can be made using either the function keys or the rotary control. - Page 52 6 User interface SRM-3000 Function SAVE / 3 Saves data sets. (abc) • Saves: – individual sets of data (spectra, tables) Key for entering the number 3 when editing a parameter. Key for entering the characters ABC. DISPL / 4 Activates the DISPLAY menu.
- Page 53 AXIS / 8 Activates the MEASUREMENT MODE menu. (pqrs) • If a three axis Narda antenna is used, enables: – selection of an isotropic measurement mode – selection of a measurement axis (X, Y or Z axis) • If a single axis antenna is used, enables: –...
- Page 54 6 User interface SRM-3000 Editing parameters Opening the numerical value entry box ⇒ Press the softkey that enables editing of a parameter (e.g. Fmin). The box for entering the numerical value to be changed opens. Entering the numerical value and units For entry using the rotary control, see sec.
-
Page 55: Rotary Control
SRM-3000 6 User interface 6.1.5 Rotary control Note: Numerical entries can be made using either the function keys or the rotary control. The two functions are mutually exclusive; if you use the rotary control, the function keys are disabled, and vice versa. -
Page 56: Keys For Optimizing The Display
6 User interface SRM-3000 Completing an entry ⇒ Press the ENT key. The entry box closes. The values defined are displayed in the “Instrument configuration” section. The function keys are enabled. The softkey functions change. Note: The rotary control can only change the value of parameters within the pre-set range limits. -
Page 57: Operating Status Display
SRM-3000 6 User interface Operating status display Element State Function Status LED Green Indicates readiness for use Instrument is being initialized Error detected Charge LED Battery is being charged Green Charging cycle has ended AC Adapter / Charger is still connected to the... -
Page 58: Lcd Panel Elements
6 User interface SRM-3000 LCD panel elements Fig. 6-2 LCD panel in “Spectrum Analysis” mode (example) 6-10... - Page 59 SRM-3000 6 User interface No. Description General information The “General information” section gives information about the current instrument status. The following data are displayed here: • type of antenna connected • type of cable connected • selected operating mode • active standard (if a standard has been activated as reference) •...
-
Page 60: External Connectors
6 User interface SRM-3000 External connectors There are two sockets on the top side of the SRM-3000. These are for connecting the antenna and the control cable. Fig. 6-3 Antenna and control cable connector sockets Function Antenna connector socket • N connector 12 pole socket (multi pin connector) for connecting the control cable •... - Page 61 SRM-3000 6 User interface Function Battery holder USB interface for connecting to a computer (PC) Serial data interface (RS 232) for connecting to a computer (PC): • 115 000 Baud • 8 data bits • 1 stop bit • No parity •...
- Page 62 6 User interface SRM-3000 Notes: 6-14...
-
Page 63: "Safety Evaluation" Mode
“Safety Evaluation” mode “Safety Evaluation” mode functions “Safety Evaluation” mode was specially developed for evaluating field strength exposure in a multi frequency environment. It provides an overview of exposure values in units of field strength or as a percentage of a selected safety standard for certain frequency bands or “services”. - Page 64 7 “Safety Evaluation” mode SRM-3000 3. Press the ENT button. The measurement menu for “Safety Evaluation” mode opens. The softkey functions change. Fig. 7-2 Measurement menu for “Safety Evaluation” mode Description Explanation Operational status: Battery Battery charge state Mode Operating mode Meas.
- Page 65 SRM-3000 7 “Safety Evaluation” mode Description Explanation Table of results (individual results) Total Total result Progress display (rotating bar) Measurement parameters display Processing Time Time to perform the measurement No. of Runs Number of times measurement performed Number of averages.
-
Page 66: Selecting The Service To Be Measured
7 “Safety Evaluation” mode SRM-3000 Selecting the service to be measured All the frequency bands (or services) that are of interest when assessing field strength exposure are usually collected together into a so-called service table. “Safety Evaluation” mode is based on the selection and activation of such a table. -
Page 67: Restricting The List Of Services To Be Measured Using The Last Service
SRM-3000 7 “Safety Evaluation” mode 7.3.2 Restricting the list of services to be measured using the last service ✓ The “Safety Evaluation” mode measurement menu is displayed. 1. Press the Sel. last service softkey. The “Select Last Service” selection box opens showing the list of last services to be measured. -
Page 68: Setting The Measurement Range
7 “Safety Evaluation” mode SRM-3000 Setting the measurement range The system sensitivity depends on the input attenuator setting, which is determined by the “Measurement Range” parameter. A high measurement sensitivity avoids any falsification of the results that might occur due to the intrinsic noise of the device. -
Page 69: Search For The Best Measurement Range
SRM-3000 7 “Safety Evaluation” mode Fig. 7-3 “Set Measurement Range (MR)” selection box 7.4.2 Search for the best measurement range This method is best if you do not know the field situation. 1. Press the Meas Range softkey. The “Set Measurement Range (MR)” selection box opens;... -
Page 70: Using Noise Suppression (Noise Threshold)
7 “Safety Evaluation” mode SRM-3000 7.4.3 Using noise suppression (Noise Threshold) The intrinsic noise of the device is present in all frequency ranges, including those that are not occupied with payload signals. When you perform a spectrum analysis and display the results graphically, it is easy to see when a spectral line disappears into the noise floor. - Page 71 SRM-3000 7 “Safety Evaluation” mode 7. Press the ENT key. The threshold value is set. 8. Press the ESC key twice to return to the measurement menu. Activating and deactivating noise suppression 1. Press the CONF key. The CONFIGURATION menu opens.
-
Page 72: Selecting The Result Type
7 “Safety Evaluation” mode SRM-3000 Selecting the result type The result type determines how the values recorded are evaluated and displayed. One value is displayed for each service. The actual (latest) measured value is displayed. The maximum measured value is displayed. -
Page 73: Selecting The Averaging Parameters
SRM-3000 7 “Safety Evaluation” mode Selecting the averaging parameters The SRM provides two ways of averaging the results: • Averaging over a specified number of individual results (Number of Averages) • Averaging over a specified time (Average Time) You can set both parameters in the CONFIGURATION menu. - Page 74 7 “Safety Evaluation” mode SRM-3000 10.Use the rotary control to set the number of averages (between 4 and 64). 11. Press the ENT key. 12.Press the ESC key twice to return to the measurement menu. The selected averaging parameter is shown in the “Measurement parameter”...
-
Page 75: Selecting The Resolution Bandwidth (Rbw)
SRM-3000 7 “Safety Evaluation” mode Selecting the resolution bandwidth (RBW) You will not normally need to enter the resolution bandwidth (RBW) manually in “Safety Evaluation” mode. In the default setting of the SRM (“RBW Automatic”), the device selects the resolution bandwidth so that the narrowest band service being measured is resolved finely enough for an accurate measurement. - Page 76 7 “Safety Evaluation” mode SRM-3000 4. To change the setting, use the rotary control to highlight “RBW Automatic”. 5. Press the ENT key. 6. Use the rotary control to set the command to “OFF”. 7. Press the ENT key. 8. Press the ESC key twice to return to the measurement menu.
-
Page 77: Selecting Display Options
SRM-3000 7 “Safety Evaluation” mode Selecting display options The following display options can be selected: • Units for the results • Full screen display of the service table • Display of results as a detailed table or a condensed table 7.8.1... -
Page 78: Selecting Display Options
7 “Safety Evaluation” mode SRM-3000 7.8.2 Selecting display options ✓ “Safety Evaluation” mode is set. ⇒ Press the DISPL button. The softkey functions change. Fig. 7-8 Softkeys for selecting the display type Selecting “Full Screen” display ⇒ Press the Full Screen softkey. - Page 79 SRM-3000 7 “Safety Evaluation” mode Displaying the normal size service table (Detailed Table) ⇒ Press any button. The service table will be displayed normal size again. Displaying the condensed service table (Condensed Table) ⇒ Press the Cond. Table softkey. The display switches to the condensed table display.
- Page 80 7 “Safety Evaluation” mode SRM-3000 Notes: 7-18...
-
Page 81: "Spectrum Analysis" Mode
“Spectrum Analysis” mode Operating mode functions In “Spectrum Analysis” mode, you can display all the field components in the selected environment for an overview of the detected spectrum or to determine maximum values. Complete evaluation of the results can be performed directly at the measurement site. - Page 82 8 “Spectrum Analysis” mode SRM-3000 Fig. 8-2 Measurement menu for “Spectrum Analysis” mode Name Description Operating states Battery Battery charge state Mode Operating mode Meas. Range Input attenuator setting (input sensitivity) Antenna parameters Type Selected / connected antenna Selected / connected measurement cable Digital result display Fr (Pk ...)
- Page 83 SRM-3000 8 “Spectrum Analysis” mode Name Description Softkey functions Marker Graphic result display (spectrum) Frequency spectrum (graphic) Measurement parameters display Sweep Time Sweep time (the total time of the complete process to determine the isotropic result is shown here for three axis antennas) No.
-
Page 84: Selecting The Frequency Range
8 “Spectrum Analysis” mode SRM-3000 Selecting the frequency range There are two ways to set the frequency range in “Spectrum Analysis” mode: • By entering the upper and lower frequencies • By entering the center frequency and frequency span 8.3.1 Selecting the frequency range entry method The lowermost softkey in the “Spectrum Analysis”... - Page 85 SRM-3000 8 “Spectrum Analysis” mode Fig. 8-3 “Set Fmin” entry box 3. Use the appropriate softkey to enter the units. 4. Press the ENT button. The lower frequency limit you defined will be displayed in the “Measurement parameters” pane of the measurement menu.
-
Page 86: Defining The Frequency Range By Center Frequency And Frequency Span
8 “Spectrum Analysis” mode SRM-3000 8.3.3 Defining the frequency range by center frequency and frequency span ✓ The toggle key function is “Fmin/Fmax”. 1. Press the Fcent softkey. An entry box opens where you can enter the value of the frequency that is to be at the center of the desired frequency sweep range. -
Page 87: Setting The Resolution Bandwidth (Rbw)
A larger resolution bandwidth can be selected for broadband signals. Setting methods The SRM-3000 can automatically define a suitable resolution bandwidth dependent on the selected frequency span. Two options for this are provided in the CONFIGURATION menu:... - Page 88 8 “Spectrum Analysis” mode SRM-3000 6. Use the rotary control to highlight “FAST SWEEP” or “HIGH RESOLUTION”. Fig. 8-5 CONFIGURATION SPECTRUM ANALYSIS (RBW Automatic) menu 7. Press the ENT button. 8. Return to the measurement menu of “Spectrum Analysis” mode by pressing the MODE button and selecting “Spectrum Analysis”.
- Page 89 SRM-3000 8 “Spectrum Analysis” mode Setting the measurement range The system sensitivity depends on the input attenuator setting, which is determined by the “Measurement Range” parameter. A high measurement sensitivity avoids any falsification of the results that might occur due to the intrinsic noise of the device.
-
Page 90: Search For The Best Measurement Range
8 “Spectrum Analysis” mode SRM-3000 Fig. 8-6 “Set Measurement Range (MR)” selection box 8.5.2 Search for the best measurement range This method is best if you do not know the field situation. 1. Press the Meas Range softkey. The “Set Measurement Range (MR)” selection box opens;... -
Page 91: Selecting The Result Type
SRM-3000 8 “Spectrum Analysis” mode Selecting the result type The result type defines how the values recorded are displayed. The rms value of the current (actual) spectral line is displayed. The maximum value occurring for all spectral lines since activation of MAX trace type is displayed. -
Page 92: Selecting The Averaging Parameters
8 “Spectrum Analysis” mode SRM-3000 Selecting the averaging parameters The SRM provides two ways of averaging the results: • Averaging over a specified number of individual results (Number of Averages) • Averaging over a specified time (Average Time) You can set both parameters in the CONFIGURATION menu. - Page 93 SRM-3000 8 “Spectrum Analysis” mode Fig. 8-7 CONFIGURATION SPECTRUM ANALYSIS menu 7. Press the ENT key. 8. Use the rotary control to highlight “Average Time”. 9. Press the ENT key. 10.Use the rotary control to set the averaging time (between 1 and 30 min).
-
Page 94: Selecting The Display
8 “Spectrum Analysis” mode SRM-3000 Selecting the display This section describes how to optimize the display of measurement results in “Spectrum Analysis” mode. 8.8.1 Selecting the units The Y axis units are selected using the UNIT button. The following power and voltage units are available if an antenna is not... - Page 95 SRM-3000 8 “Spectrum Analysis” mode ✓ “Spectrum Analysis” mode is set. 1. Press the UNIT button. The “Select Display Unit” selection box opens showing a list of available units. Fig. 8-8 “Select Display Unit” selection box 2. Use the rotary control to highlight the desired units.
-
Page 96: Selecting The Display Mode And Scaling
8 “Spectrum Analysis” mode SRM-3000 8.8.2 Selecting the display mode and scaling The display mode (full screen), scaling and the Y axis reference value are set using the DISPL button. ✓ “Spectrum Analysis” mode is set. ⇒ Press the DISPL button. - Page 97 SRM-3000 8 “Spectrum Analysis” mode Selecting the display mode ⇒ Press the Full Screen softkey. The entire display area is used to display the spectrum. Fig. 8-10 “Full Screen” display mode Displaying the spectrum in normal size ⇒ Press any button.
- Page 98 8 “Spectrum Analysis” mode SRM-3000 Selecting the Y axis scaling ✓ The DISPL button has been pressed. ✓ The corresponding softkeys are displayed. 1. Press the Y-Scale Range softkey. The “Select Y-Scale Range” selection box opens. Fig. 8-11 “Select Y-Scale Range” selection box 2.
- Page 99 SRM-3000 8 “Spectrum Analysis” mode Fig. 8-12 “Select Y-Scale Reference” selection box 2. Use the rotary control to highlight the desired value. 3. Press the ENT button. The Y axis reference point is set to the selected value in the “Spectrum Analysis”...
-
Page 100: Rapidly Changing The Frequency Span (Zoom Function)
8 “Spectrum Analysis” mode SRM-3000 8.8.3 Rapidly changing the frequency span (Zoom function) Zoom functions are provided to allow rapid alteration in the frequency span. An area of interest within the selected frequency span is marked and the upper and lower frequency limits of the marked frequency range are then set as the limits of the new frequency span. - Page 101 SRM-3000 8 “Spectrum Analysis” mode The softkey functions are as follows: Zoom min Sets the lower limit of the zoom area. Zoom max Sets the upper limit of the zoom. Move Zoom Area Moves the zoom area over the spectrum.
- Page 102 8 “Spectrum Analysis” mode SRM-3000 Setting the lower limit of the zoom area The lower limit of the zoom area can be set individually. ✓ The ZOOM button has been pressed. ✓ The softkeys for selecting the zoom settings are displayed (see fig.
- Page 103 SRM-3000 8 “Spectrum Analysis” mode Setting the upper limit of the zoom area The upper limit of the zoom area can be set individually. ✓ The ZOOM button has been pressed. ✓ The softkeys for selecting the zoom settings are displayed (see fig.
- Page 104 8 “Spectrum Analysis” mode SRM-3000 Moving the zoom area The upper and lower limits of the zoom area can be moved simultaneously. ✓ The ZOOM button has been pressed. ✓ The softkeys for selecting the zoom settings are displayed (see fig. 8-13).
- Page 105 SRM-3000 8 “Spectrum Analysis” mode Reducing / enlarging the zoom area ✓ The ZOOM button has been pressed. ✓ The softkeys for selecting the zoom settings are displayed (see fig. 8-13). 1. Press the Reduce Enlarge Area softkey. The lines demarcating the zoom area are marked with diamonds.
- Page 106 8 “Spectrum Analysis” mode SRM-3000 Positioning the zoom area symmetrically about the marker ✓ The marker is set to the desired position. Marker functions: see page 8-28 ✓ The ZOOM button has been pressed. ✓ The softkeys for selecting the zoom settings are displayed (see fig.
- Page 107 SRM-3000 8 “Spectrum Analysis” mode Activating the zoom settings ✓ The ZOOM button has been pressed. ✓ The softkeys for selecting the zoom settings are displayed (see fig. 8-13). ✓ The zoom area has been defined. ⇒ Press the Exec Zoom softkey.
-
Page 108: Evaluating Results
8 “Spectrum Analysis” mode SRM-3000 Evaluating results Marker functions and a peak value table are provided for rapid evaluation of the spectrum analysis results. You can also display the integrated level of a freely definable frequency band. 8.9.1 Marker functions... - Page 109 SRM-3000 8 “Spectrum Analysis” mode Fig. 8-20 Peak marker in the measurement menu The softkey functions are as follows: Highest Peak Moves the marker to the highest peak Next Peak right Moves the marker to the next peak to the right of...
- Page 110 8 “Spectrum Analysis” mode SRM-3000 Moving the peak marker to the highest peak ✓ The MARK button has been pressed. ✓ The softkeys for selecting the marker functions are displayed (see fig. 8-20). ⇒ Press the Highest Peak softkey. The marker is set to the peak with the highest level value.
- Page 111 SRM-3000 8 “Spectrum Analysis” mode Moving the peak marker to the next higher or next lower peak ✓ The MARK button has been pressed. ✓ The softkeys for selecting the marker functions are displayed (see fig. 8-20). ⇒ Press the Next higher Peak softkey.
-
Page 112: Peak Table
8 “Spectrum Analysis” mode SRM-3000 8.9.2 Peak table The display can be switched to show a peak table for better result evaluation. The peak table lists the highest peaks (maximum of 20) occurring in the frequency spectrum being considered. Note: The same algorithm is used for the peak table as is used to determine local maxima using the peak marker (see sec. - Page 113 SRM-3000 8 “Spectrum Analysis” mode Fig. 8-23 Peak table Note: Press the ESC button to display the frequency spectrum again. 8-33...
- Page 114 8 “Spectrum Analysis” mode SRM-3000 The table below explains the column headers used in the peak table: Column header Explanation Index Peak sequence number (maximum 50). Frequency Peak frequency value. Level Peak level value. Service Service to which the peak (frequency value) belongs, e.g.
- Page 115 SRM-3000 8 “Spectrum Analysis” mode Displaying only those peaks which exceed a selected threshold ✓ The peak table is displayed. 1. Press the Set Thresh softkey. The “Set Threshold” selection box opens. Fig. 8-24 “Select Threshold” selection box 2. Use the rotary control to highlight the desired threshold value.
- Page 116 8 “Spectrum Analysis” mode SRM-3000 Limiting the number of peaks displayed ✓ The peak table is displayed. 1. Press the Set No. of Peaks softkey. The “Select max. number of peaks in peak table” selection box opens. Fig. 8-25 “Select max. number of peaks in peak table” selection box 2.
-
Page 117: Integration Over A Defined Frequency Band
SRM-3000 8 “Spectrum Analysis” mode 8.9.3 Integration over a defined frequency band The results in a defined frequency band within the currently selected frequency range can be integrated using this function. This evaluation function thus provides an indication of the broadband value within the frequency range being considered. - Page 118 8 “Spectrum Analysis” mode SRM-3000 3. Press the ENT button. Two lines (band limits) are displayed in the frequency spectrum. The band limit frequencies (FIntmin and FIntmax) and the integrated level value (Value) are displayed in the measurement menu. Fig. 8-27...
- Page 119 SRM-3000 8 “Spectrum Analysis” mode Setting the lower limit of the frequency band The lower limit of the frequency band can be set individually. ✓ “Integration over a frequency band” display mode is activated. 1. Press the FInt min softkey.
- Page 120 8 “Spectrum Analysis” mode SRM-3000 Setting the upper limit of the frequency band The upper limit of the frequency band can be set individually. ✓ “Integration over a frequency band” display mode is activated. 1. Press the FInt max softkey.
- Page 121 SRM-3000 8 “Spectrum Analysis” mode Moving the frequency band ✓ “Integration over a frequency band” display mode is activated. 1. Press the Move Int. Band softkey. The demarcation lines for the frequency band are indicated by diamonds. Fig. 8-30 Moving the frequency band 2.
- Page 122 8 “Spectrum Analysis” mode SRM-3000 Notes: 8-42...
-
Page 123: "Umts P-Cpich Demodulation" Mode (Option)
“UMTS P-CPICH Demodulation” mode (option) Operating mode functions Unlike GSM, you cannot simply use a frequency selective measurement with UMTS to detect individual channels and assign them to a radio cell. This is because the information in individual channels is “spread” over an entire frequency channel of 5 MHz and is also scrambled. -
Page 124: Selecting The Operating Mode
9 “UMTS P-CPICH Demodulation” mode (option) SRM-3000 Selecting the operating mode ✓ The Option has been enabled (sec. 16.6, page 16-16). 1. Press the MODE button. The OPERATING MODES menu opens. Fig. 9-1 OPERATING MODES menu 2. Use the rotary control to highlight “UMTS P-CPICH Demodulation”. - Page 125 SRM-3000 9 “UMTS P-CPICH Demodulation” mode (option) Name Description Operating states Battery Battery charge state. Mode Operating mode. Meas. Range Input attenuator setting (input sensitivity). Antenna parameters Type Selected / connected antenna. Selected / connected measurement cable. Evaluation Standard or regulation selected if result display is set to a percentage of a limit value.
- Page 126 9 “UMTS P-CPICH Demodulation” mode (option) SRM-3000 Name Description Measurement parameter display (continued). No. of Runs Number of measurement runs. Result Evaluation type: Current (actual) value (ACT) or average of several results (AVERAGE). Number of averages. Only displayed for “Result Type” = “AVERAGE”.
-
Page 127: Selecting The Display
SRM-3000 9 “UMTS P-CPICH Demodulation” mode (option) Selecting the display ⇒ Press the DISPL key. The second to last softkey provides the following options: Table Ratio Switches to table display mode. The last column shows the ratios of the individual... -
Page 128: Table Normal Display Mode
9 “UMTS P-CPICH Demodulation” mode (option) SRM-3000 9.3.1 Table Normal display mode This is the default display setting for “UMTS P-CPICH Demodulation” mode (fig. 9-2, page 9-2). ✓ You have pressed the DISPL key. ✓ The corresponding softkeys are displayed. - Page 129 SRM-3000 9 “UMTS P-CPICH Demodulation” mode (option) For a detailed description of the units that you can select, see sec. 8.8.1, page 8-14. Setting the extrapolation factor (Extr. Fact.): see page 9-31 Selecting “Full Screen” display mode ⇒ Press the DISPL key.
- Page 130 9 “UMTS P-CPICH Demodulation” mode (option) SRM-3000 Selecting table entries 1. Press the More softkey if necessary. The softkey labels change. 2. Press the Select Menu softkey. The SELECT menu opens. You can now choose from the following options using the softkeys:...
-
Page 131: Table Ratio Display Mode
SRM-3000 9 “UMTS P-CPICH Demodulation” mode (option) 9.3.2 Table Ratio display mode This display mode directly shows how much each UMTS radio cell contributes to the overall field strength of an UMTS frequency channel. The ratios are expressed in dB. -
Page 132: Bar Graph Display Mode
9 “UMTS P-CPICH Demodulation” mode (option) SRM-3000 9.3.3 Bar Graph display mode This display mode shows the individual results, the overall result (Total) and the result of the analog field strength measurement (Analog) as a bar graph. ✓ “UMTS P-CPICH Demodulation” mode is set. - Page 133 SRM-3000 9 “UMTS P-CPICH Demodulation” mode (option) 3. Press the ESC key to return to the measurement menu. Selecting the result units: see page 9-6 Setting the extrapolation factor (Extr. Fact.): see page 9-31 Selecting the Y-axis scale range ✓ You have pressed the DISPL key.
- Page 134 9 “UMTS P-CPICH Demodulation” mode (option) SRM-3000 Sorting the display of individual results The individual results (Scrambling Codes) are shown in the same order as their index numbers in table display mode, so you can use the Sort Table softkey function to change the sort order.
-
Page 135: Mixed Display Mode (Numerical Display With Graphical Display Versus Time)
SRM-3000 9 “UMTS P-CPICH Demodulation” mode (option) 9.3.4 Mixed display mode (numerical display with graphical display versus time) The following are displayed in this mode for a selected individual result or for the overall result: • The instantaneous (Value) and maximum (Max Value) field strength results as numerical values •... - Page 136 9 “UMTS P-CPICH Demodulation” mode (option) SRM-3000 Selecting the X-axis scale (Observation Length) ✓ You have pressed the DISPL key. ✓ The corresponding softkeys are displayed. 1. Press the Observ Length softkey. The “Select Observation Length” selection box containing a range of available values opens.
- Page 137 SRM-3000 9 “UMTS P-CPICH Demodulation” mode (option) Selecting the Y-axis reference point ✓ You have pressed the DISPL key. ✓ The corresponding softkeys are displayed. 1. Press the Y-Scale Ref softkey. The “Select Y-Scale Reference” selection box opens. 2. Use the rotary control to highlight the desired value.
- Page 138 9 “UMTS P-CPICH Demodulation” mode (option) SRM-3000 Resetting maximum values ⇒ Press the Max Reset softkey. The stored maximum values are deleted. The measurement results themselves are retained. The measurement continues. Resetting the entire graph ⇒ Press the Table Reset softkey.
-
Page 139: Value Display Mode (Numerical)
SRM-3000 9 “UMTS P-CPICH Demodulation” mode (option) 9.3.5 Value display mode (numerical) The instantaneous (Value) and maximum (Max Value) field strength values of selected individual results are displayed numerically in this display mode. ✓ “UMTS P-CPICH Demodulation” mode is set. -
Page 140: Graph (Versus Time) Display Mode
9 “UMTS P-CPICH Demodulation” mode (option) SRM-3000 9.3.6 Graph (versus time) display mode The variation of field strength versus time is displayed graphically for selected individual results or for the overall result in this display mode. ✓ “UMTS P-CPICH Demodulation” mode is set. - Page 141 SRM-3000 9 “UMTS P-CPICH Demodulation” mode (option) Selecting “Full Screen” display mode: see page 9-7 Using the marker to read out numerical results: see page 9-15 Selecting table entries: see page 9-8 Note: The numerical result is made up from the contributions of the selected table entries only (Scrambling Codes).
-
Page 142: Selecting An Umts Frequency Or Channel
9 “UMTS P-CPICH Demodulation” mode (option) SRM-3000 Selecting an UMTS frequency or channel There are two ways to set the measurement frequency to an UMTS frequency channel in “UMTS P-CPICH Demodulation” mode: • By entering the center frequency (Fcent) • By entering the channel number (Channel) Choosing between “Fcent”... -
Page 143: Selecting The Center Frequency
SRM-3000 9 “UMTS P-CPICH Demodulation” mode (option) 9.4.1 Selecting the center frequency ✓ The topmost softkey is labeled “Fcent”. 1. Press the Fcent softkey. The entry box for the center frequency opens. 2. Enter a value using the rotary control or the function keys. -
Page 144: Selecting The Channel Number
9 “UMTS P-CPICH Demodulation” mode (option) SRM-3000 9.4.2 Selecting the channel number ✓ The topmost softkey is labeled “Chann”. 1. Press the Chann softkey. The entry box for the channel number. 2. Enter a value using the rotary control or the function keys. -
Page 145: Selecting The Measurement Range
SRM-3000 9 “UMTS P-CPICH Demodulation” mode (option) Selecting the measurement range The system sensitivity depends on the input attenuator setting, which is determined by the “Measurement Range” parameter. A high measurement sensitivity avoids any falsification of the results that might occur due to the intrinsic noise of the device. -
Page 146: Search For The Best Measurement Range
9 “UMTS P-CPICH Demodulation” mode (option) SRM-3000 Fig. 9-13 “Set Measurement Range (MR)” selection box 9.5.2 Search for the best measurement range This method is best if you do not know the field situation. 1. Press the Meas Range softkey. -
Page 147: Using Noise Suppression (Noise Threshold)
SRM-3000 9 “UMTS P-CPICH Demodulation” mode (option) 9.5.3 Using noise suppression (Noise Threshold) The intrinsic noise of the device is present in all frequency ranges, including those that are not occupied with payload signals. When you perform a spectrum analysis and display the results graphically, it is easy to see when a spectral line disappears into the noise floor. - Page 148 9 “UMTS P-CPICH Demodulation” mode (option) SRM-3000 Fig. 9-14 CONFIGURATION UMTS P-CPICH DEMODULATION MODE menu, setting the noise suppression threshold (Noise Threshold Factor) 7. Press the ENT key. The threshold value is set. 8. Press the ESC twice to return to the measurement menu.
-
Page 149: Selecting The Result Type
SRM-3000 9 “UMTS P-CPICH Demodulation” mode (option) Selecting the result type The result type defines how the values recorded are displayed. The actual (latest) measured values are displayed. AVERAGE A specified number of measured values are averaged. The resulting values are displayed. The number of values averaged is set in the CONFIGURATION menu. -
Page 150: Selecting The Averaging Parameters
9 “UMTS P-CPICH Demodulation” mode (option) SRM-3000 Selecting the averaging parameters The SRM provides two ways of averaging the results: • Averaging over a specified number of individual results (Number of Averages) • Averaging over a specified time (Average Time) You can set both parameters in the CONFIGURATION menu. - Page 151 SRM-3000 9 “UMTS P-CPICH Demodulation” mode (option) 9. Press the ENT key. 10.Use the rotary control to set the number of averages (between 4 and 64). 11. Press the ENT key. 12.Press the ESC key twice to return to the measurement menu.
-
Page 152: Selecting The Umts Demodulation Algorithm (Fast/Sensitive)
Selecting the UMTS demodulation algorithm (FAST/SENSITIVE) In FAST mode, the SRM-3000 is optimized for fast measurements (fast Process Time). The instrument detects all the UMTS channels that have a level which is not less than 10 dB below the highest measured channel level. -
Page 153: Setting The Extrapolation Factor (Extr. Fact.)
SRM-3000 9 “UMTS P-CPICH Demodulation” mode (option) Setting the extrapolation factor (Extr. Fact.) The extrapolation factor is applied to all the results of UMTS P-CPICH Demodulation, but not to the result of the analog field strength measurement for the entire UMTS frequency channel. - Page 154 9 “UMTS P-CPICH Demodulation” mode (option) SRM-3000 Activating and deactivating the extrapolation function ⇒ Press the Extr. Pol ON softkey. The extrapolation factor you set will now be applied to the results. The value of the extrapolation factor is shown in the measurement menu.
-
Page 155: Evaluating And Interpreting Measurement Results
9 “UMTS P-CPICH Demodulation” mode (option) 9.10 Evaluating and interpreting measurement results After you start the measurement, the SRM-3000 scans the UMTS frequency channel you set for scrambling codes and measures the corresponding field strengths. It also makes an analog measurement of the total power level of the UMTS frequency channel at the same time. -
Page 156: Overall Result (Total)
9 “UMTS P-CPICH Demodulation” mode (option) SRM-3000 You can clear the entire table by pressing the Table Reset softkey. You can use this function to clear unwanted scrambling codes from the list (i.e. ones that are not to be received any more), making room for new scrambling codes. -
Page 157: 10 "Time Analysis" Mode
10 “Time Analysis” mode 10.1 Operating mode function “Time Analysis” mode enables you to make selective measurements at a defined frequency (Fcent), e.g. to monitor the field strength of a GSM or UMTS channel. The resolution bandwidth (RBW) can be selected to match the channel bandwidth, and averaging over a user defined time period, e.g. - Page 158 10 “Time Analysis” mode SRM-3000 2. Use the rotary control to highlight “Time Analysis”. 3. Press the ENT button. The measurement menu for “Time Analysis” mode opens. The softkey functions change. Fig. 10-2 “Time Analysis” mode measurement menu Name Description...
- Page 159 SRM-3000 10 “Time Analysis” mode Name Description Evaluation Standard or regulation selected if result display is set to a percentage of a limit value Numerical result Time Displays the time of day in hh:mm:ss during the measurement. Displays the timestamp (resolution 0.1 second) corresponding to the measured value when the results are read out.
-
Page 160: Selecting Display Options
10 “Time Analysis” mode SRM-3000 10.3 Selecting display options ⇒ Press the DISPL button. The second to last softkey has three possible functions: Value Switches the display to show the measured values numerically. Graph Switches the display to show the measured values as a graph. - Page 161 SRM-3000 10 “Time Analysis” mode 2. Use the rotary control to select the desired units. 3. Press the ENT key. The results are shown in the desired units in the “Time Analysis” mode measurement menu. Selecting “Full Screen” display mode 1.
-
Page 162: Graph Display
10 “Time Analysis” mode SRM-3000 10.3.2 Graph display ✓ The DISPL button has been pressed. ✓ The corresponding softkeys are displayed. 1. Press the Value softkey. The result history is shown as a graph in the display: The current measured value is shown on the right as the zero position on the x axis. - Page 163 SRM-3000 10 “Time Analysis” mode 1. Press the Observ Length softkey. The “Select Observation Length” selection box opens showing a list of available values. Fig. 10-5 “Select Observation Length” selection box 2. Use the rotary control to highlight the desired value.
- Page 164 10 “Time Analysis” mode SRM-3000 1. Press the Y-Scale Ref softkey. The “Select Y-Scale Reference” selection box is displayed. 2. Use the rotary control to highlight the desired value. 3. Press the ENT button. The Y axis reference point is set to the selected value.
-
Page 165: Mixed Display
SRM-3000 10 “Time Analysis” mode 10.3.3 Mixed display ✓ The DISPL button has been pressed. ✓ The corresponding softkeys are displayed. 1. Press the Mixed softkey. The current measurement result is shown in the upper part of the display. The result history is shown as a graph in the lower part of the display (Graph display: see page 10-6). -
Page 166: Selecting The Center Frequency (Fcent)
10 “Time Analysis” mode SRM-3000 10.4 Selecting the Center Frequency (Fcent) 1. Press the Fcent softkey. The entry box for the center frequency opens. 2. Enter a value using the rotary control or the function keys. Once the first digit has been entered, the softkey labels change to indicate the possible units. -
Page 167: Selecting The Detector Type (Rms Value, Peak Value)
SRM-3000 10 “Time Analysis” mode 10.5 Selecting the Detector Type (RMS value, peak value) You can select either an RMS value detector or a PEAK value detector. 1. Press the Detector softkey. The detector type entry box opens. 2. Use the rotary control to highlight the required detector type. -
Page 168: Selecting The Resolution Bandwidth (Rbw)
10 “Time Analysis” mode SRM-3000 10.6 Selecting the Resolution Bandwidth (RBW) 1. Press the RBW softkey. The resolution bandwidth entry box opens. 2. Use the rotary control to highlight the desired resolution bandwidth. Fig. 10-9 “Select Resolution Bandwidth (RBW)” entry box 3. -
Page 169: Setting The Measurement Range
SRM-3000 10 “Time Analysis” mode 10.7 Setting the measurement range The system sensitivity depends on the input attenuator setting, which is determined by the “Measurement Range” parameter. A high measurement sensitivity avoids any falsification of the results that might occur due to the intrinsic noise of the device. -
Page 170: Search For The Best Measurement Range
10 “Time Analysis” mode SRM-3000 Fig. 10-10 “Set Measurement Range (MR)” selection box 10.7.2 Search for the best measurement range This method is best if you do not know the field situation. 1. Press the Meas Range softkey. The “Set Measurement Range (MR)” selection box opens;... -
Page 171: Using Noise Suppression (Noise Threshold)
SRM-3000 10 “Time Analysis” mode 10.7.3 Using noise suppression (Noise Threshold) The intrinsic noise of the device is present in all frequency ranges, including those that are not occupied with payload signals. When you perform a spectrum analysis and display the results graphically, it is easy to see when a spectral line disappears into the noise floor. - Page 172 10 “Time Analysis” mode SRM-3000 Fig. 10-11 CONFIGURATION TIME ANALYSIS MODE menu; setting the threshold value for noise suppression (Noise Threshold Factor) 7. Press the ENT key. The threshold value is set. 8. Press the ESC key twice to return to the measurement menu.
-
Page 173: Selecting The Result Type
SRM-3000 10 “Time Analysis” mode 10.8 Selecting the Result Type The result type defines how the values recorded are displayed. The current (actual) measured value is displayed. For “Detector” = “RMS” only: The measured values are averaged over a defined time period. -
Page 174: Selecting The Averaging Time
10 “Time Analysis” mode SRM-3000 10.9 Selecting the Averaging Time The averaging parameter is defined in the CONFIGURATION menu. It specifies the time period over which the measured values are averaged for the result types “AVERAGE” and “MAX AVERAGE”. 1. Press the CONF button. -
Page 175: Evaluating The Results
SRM-3000 10 “Time Analysis” mode 10.10 Evaluating the results The SRM just stores the last value measured when it is in numeric display mode. When in graph display mode or mixed graph and numeric display mode, it stores the numerical results continuously along with a corresponding timestamp with a time resolution of 0.1 seconds. - Page 176 10 “Time Analysis” mode SRM-3000 Notes: 10-20...
-
Page 177: Isotropic Measurements
Three axis antennas make simple, rapid isotropic measurements possible by automatically detecting the three spatial components of the field to be measured. Narda Safety Test Solutions offers a three axis antenna for measuring electric field strength which covers the frequency range from 75 MHz to 3 GHz. -
Page 178: Measurements With A Three Axis Antenna
11.1 Measurements with a three axis antenna 11.1.1 Isotropic measurement with a three axis antenna ✓ A Narda three axis antenna is connected to the SRM-3000 either directly or via a cable. Isotropic measurement mode is selected automatically by default. - Page 179 MEASUREMENT MODE menu (Isotropic measurement) 2. Use the rotary control to select “Isotropic measurement”. 3. Press the ENT button. You will use the SRM-3000 most often for this application. It is described in detail in the sections describing the different operating modes. 11-3...
-
Page 180: Measuring A Single Axis With A Three Axis Antenna
11 Isotropic measurements SRM-3000 11.1.2 Measuring a single axis with a three axis antenna ✓ A Narda three axis antenna is connected to the SRM-3000 either directly or via a cable. As stated in sec. 11.1.1, page 11-2, isotropic measurement mode is selected automatically when a three axis antenna is used. -
Page 181: Measurement Using A Single Axis Antenna
11.2.1 Standard measurement using a single axis antenna ✓ A single axis antenna (e.g. customary antenna) is connected to the SRM-3000 either directly or via a cable. A single spatial component is detected and displayed by default when a single axis antenna is used. Various methods can be applied in this configuration to determine the field strength exposure (see Appendix A). -
Page 182: Isotropic Measurement With A Single Axis Antenna
11 Isotropic measurements SRM-3000 11.2.2 Isotropic measurement with a single axis antenna The SRM-3000 provides a sequential measurement for making isotropic measurements with a single axis antenna. The three separate measurements are made one after the other. The overall result is then calculated and displayed. - Page 183 SRM-3000 11 Isotropic measurements Fig. 11-6 “Spectrum Analysis” mode; isotropic measurement with a single axis antenna 4. Press the Change Param softkey if the measurement parameters need to be changed. Further softkey functions are shown which can be used to change the measurement parameters (see the sections describing the different operating modes).
- Page 184 11 Isotropic measurements SRM-3000 Fig. 11-7 “Spectrum Analysis” mode; separate sequential measurement 8. Press the Stop meas softkey. The result for the measurement of the first axis is saved. 9. Repeat steps 6 through 8 for the two other axes.
- Page 185 SRM-3000 11 Isotropic measurements Note: Further sequential measurements can be started using the New Meas softkey. Exit from isotropic measurement mode is only by means of the MEASUREMENT MODE menu. 11-9...
- Page 186 11 Isotropic measurements SRM-3000 Notes: 11-10...
-
Page 187: Spatial Averaging (Option)
12 Spatial Averaging (option) The “Spatial Averaging” function of the SRM allows you to average the measured values recorded at different points within a room. The SRM determines the root mean square (RMS) value of the power level. For details of the “Spatial Averaging” function: see page B-9 Spatial averaging can be used in “Safety Evaluation”... - Page 188 12 Spatial Averaging (option) SRM-3000 Discrete Averaging Discrete Averaging with a three axis antenna The SRM records and averages single measurement results each time a button is pressed. This allows you to record results for specific positions in the room. The antenna must not be moved while the individual measurement is being made.
- Page 189 SRM-3000 12 Spatial Averaging (option) Discrete Averaging with a single axis antenna You can also perform discrete averaging using a single axis antenna. Three measurements must be made at each point to be measured in the room (Isotropic measurement with a single axis antenna: see page 11-6). The SRM calculates the isotropic result for each point and averages the isotropic results for all the points measured.
-
Page 190: Spatial Averaging In "Safety Evaluation" Mode
12.1 Spatial Averaging in “Safety Evaluation” mode ✓ The Option has been enabled (see sec. 16.6, page 16-16). ✓ The SRM-3000 is in “Safety Evaluation” mode (see sec. 7, page 7-1) and all settings, such as the measurement range, selection of services to be measured, etc., have been made. -
Page 191: Continuous Averaging
SRM-3000 12 Spatial Averaging (option) 12.1.1 Continuous Averaging ✓ Continuous Averaging is set (indicated by the Start softkey). Fig. 12-5 Continuous Averaging, Start 1. Locate the desired position in the room and press the Start softkey. The softkey label changes. - Page 192 12 Spatial Averaging (option) SRM-3000 3. Press the Stop softkey. The softkey label changes. The SRM stops averaging (No. of SAVG remains constant) and displays the averaged result. The SRM continues measuring in the background (indicated by No. of Runs), but does not use these measurement values to form the average.
- Page 193 SRM-3000 12 Spatial Averaging (option) Note: When you press the SAVE button, the SRM saves the current result of spatial averaging in the result memory. You can therefore use this function to record intermediate results. The SRM resumes averaging when you press the Continue softkey, incorporating the measured values already recorded.
-
Page 194: Discrete Averaging
12 Spatial Averaging (option) SRM-3000 12.1.2 Discrete Averaging 12.1.2.1 Discrete Averaging with a three axis antenna ✓ Discrete Averaging is set (indicated by the Add Value softkey). Fig. 12-8 Discrete Averaging, started by pressing the Add Value softkey 1. Position the antenna at the first point in the room to be measured. - Page 195 SRM-3000 12 Spatial Averaging (option) Fig. 12-9 Discrete Averaging after the first measurement 3. Move the antenna to the next point in the room to be measured. 4. Press the Add Value softkey. The SRM makes the measurement, indicates “RUN” under “No. of Runs”...
-
Page 196: Discrete Averaging With A Single Axis Antenna
12 Spatial Averaging (option) SRM-3000 12.1.2.2 Discrete Averaging with a single axis antenna ✓ The antenna is fitted on a tripod using the antenna holder. Measurement setup with a single axis antenna: see page 5-3. Isotropic measurement with a single axis antenna: see page 11-6. - Page 197 SRM-3000 12 Spatial Averaging (option) Fig. 12-11 Discrete Averaging with single axis antenna after the first partial measurement: X axis measurement. 3. Align the antenna with the Y axis. 4. Press the Add Y Axis softkey. The SRM makes the measurement, indicates “RUN” under “No. of Runs”...
- Page 198 12 Spatial Averaging (option) SRM-3000 5. Align the antenna with the Z axis. 6. Press the Add Z Axis softkey. The SRM makes the measurement, indicates “RUN” under “No. of Runs” in the display, and confirms the measurement with a beep.
- Page 199 SRM-3000 12 Spatial Averaging (option) Note: When you press the SAVE button, the SRM saves the current result of spatial averaging in the result memory. You can therefore use this function to record intermediate results. The SRM resumes averaging when you press the Continue softkey, incorporating the measured values already recorded.
-
Page 200: Spatial Averaging In "Spectrum Analysis" Mode
12.2 Spatial Averaging in “Spectrum Analysis” mode ✓ The Option has been enabled (see sec. 16.6, page 16-16). ✓ The SRM-3000 is in “Spectrum Analysis” mode (see sec. 8, page 8-1), and all settings, such as the measurement range, frequency, resolution bandwidth, etc., have been made. - Page 201 SRM-3000 12 Spatial Averaging (option) The measurement procedures are described in detail above under Spatial Averaging in “Safety Evaluation” mode: • Continuous Averaging: see page 12-5. • Discrete Averaging with a three axis antenna: see page 12-8. • Discrete Averaging with a single axis antenna: see page 12-10.
-
Page 202: Spatial Averaging In "Time Analysis" Mode
“Time Analysis” mode when the display is set to “Value”. ✓ The Option has been enabled (see sec. 16.6, page 16-16). ✓ The SRM-3000 is in “Time Analysis” mode (see sec. 10, page 10-1) and all settings, such as the measurement range, frequency, resolution bandwidth, etc., have been made. - Page 203 SRM-3000 12 Spatial Averaging (option) 2. Press the Spatial AVG softkey. The following functions are now provided by the last softkey: Continuous Sets the evaluation function to “Continuous Averaging”. The softkey label changes to the next available function. Discrete Sets the evaluation function to “Discrete Averaging”.
- Page 204 12 Spatial Averaging (option) SRM-3000 Notes: 12-18...
-
Page 205: Result Memory
13 Result memory The results obtained in any operating mode can be saved. The SRM provides the following functions for this: • Saving of the current result by pressing the SAVE key. • Automatic saving of results when a threshold value is exceeded; set using the MEMORY menu. -
Page 206: Saving A Single Measurement
13 Result memory SRM-3000 13.1.1 Saving a single measurement Note: Single measurements can be saved without a comment, with a pre- defined standard comment or with your own comment. These settings are made in the MEMORY menu. Also refer to sec. 13.3, page 13-17 ✓... - Page 207 SRM-3000 13 Result memory Softkey functions The softkeys have the following functions: Empt. Space Enters a space. Number Opens a list with numerical characters. The required character is selected with the rotary control and the ENT key. Spec. Char Opens a list with special characters.
-
Page 208: Automatic Saving
13 Result memory SRM-3000 13.1.2 Automatic saving The SRM can save results automatically. To do this, a threshold can be set and a save mode selected for the individual operating modes. Note: Automatic saving can be done without a comment, with a pre- defined standard comment or with your own comment. - Page 209 SRM-3000 13 Result memory Selecting the store mode ✓ The appropriate operating mode is selected, e.g. Spectrum Analysis. ✓ The CONDITIONAL STORING menu is displayed. 1. Use the rotary control to highlight “Conditional storing options”. 2. Press the ENT key.
- Page 210 13 Result memory SRM-3000 Selecting the maximum number of data sets ✓ The appropriate operating mode has been selected, e.g. “Spectrum Analysis”. ✓ The CONDITIONAL STORING menu is displayed. 1. Use the rotary control to highlight “Max. number of records”.
- Page 211 SRM-3000 13 Result memory Starting storage ✓ The appropriate operating mode is selected, e.g. Spectrum Analysis. ✓ The CONDITIONAL STORING menu is displayed. ✓ The threshold and desired storing option are set. ⇒ Press the Immd start softkey. Storage is activated.
- Page 212 13 Result memory SRM-3000 Stopping automatic storage ✓ Automatic storage was activated using the Immd start softkey (see fig. 13-5). ⇒ Press the STOP softkey. Automatic storage terminates. 13-8...
-
Page 213: Time Controlled Storing (Option)
SRM-3000 13 Result memory 13.1.3 Time Controlled Storing (option) The SRM can store measurement results under timer control. To do this, you can set the start date, start time, measurement duration and other parameters in the TIME CONTROLLED STORING sub menu. - Page 214 13 Result memory SRM-3000 Start date 6 digits (Setting the number format (Configure General): see page 14-15) Start time Entered in hours:minutes:seconds Duration Measurement duration entered in hour:minutes:seconds maximum 99:99:99 Time interval Time interval between result saves. Can be set to fixed values between 1.2 seconds and 60 minutes or to the maximum rate possible (As many as possible).
- Page 215 SRM-3000 13 Result memory 14.Use the rotary control to set a value between 1.2 seconds and 60 minutes or select the setting “As many as possible”. 15.Press the ENT key. The time interval between result saves is set. 16.Use the rotary control to highlight “Maximum reset” markieren.
- Page 216 13 Result memory SRM-3000 Starting time controlled storing 1. Press the Start now softkey. The measurement starets immediately. The measurement duration and time, and all other parameters correspond to the option settings. A pane opens in the measurement menu containing the message “Time controlled storing”, together with the index numbers of the stored data...
-
Page 217: Managing Data Sets
SRM-3000 13 Result memory Note: You can stop the measurement at any time by pressing the Stop softkey. The results stored up till that time will be retained. 13.2 Managing data sets The MEMORY VIEWER is used to display and manage the data sets. The data sets are listed in a table. - Page 218 13 Result memory SRM-3000 Fig. 13-8 MEMORY VIEWER showing stored data sets 4. Use the Page up or Page down softkeys and / or the rotary control to highlight the desired data set. The data set is highlighted in black.
- Page 219 SRM-3000 13 Result memory Displaying sub data sets ✓ The MEMORY VIEWER menu is open (see fig. 13-10). ✓ At least one data set containing sub data sets is stored. 1. Press the Expand Tree softkey. A list of all the data sets and sub data sets is now displayed.
- Page 220 13 Result memory SRM-3000 Deleting a data set ✓ The MEMORY VIEWER is displayed (see fig. 13-8). ✓ At least one data set has been stored. 1. Use the Page up or Page down softkeys and / or the rotary control to highlight the desired data set.
-
Page 221: Entering And Editing Comments
SRM-3000 13 Result memory 13.3 Entering and editing comments Each data set can be stored without a comment, with a pre-defined default comment or with your own comment. The comments are managed separately for each operating mode. 1. Press the MEM key. - Page 222 13 Result memory SRM-3000 Entering a default comment ✓ The COMMENTS menu is displayed. 1. Use the rotary control to highlight “Standard text for comment”. 2. Press the ENT key. The “Enter text for comment” dialog opens. The softkey functions change.
-
Page 223: Reading Out Stored Data Sets
SRM-3000 13 Result memory 13.4 Reading out stored data sets Stored data sets can be transferred to a PC / laptop computer via the serial data interface (RS 232). The “SRM-Tools” PC software supplied with the instrument can be used for this. - Page 224 13 Result memory SRM-3000 Notes: 13-20...
-
Page 225: General Settings (Configuration)
14 General settings (Configuration) General settings or configurations are selected using the CONF button. Opening the Configuration menu ⇒ Press the CONF button. The CONFIGURATION menu opens showing the following options: Fig. 14-1 CONFIGURATION menu *) only if “UMTS P-CPICH Demodulation” option is installed Option Explanation Antenna/Sensor... - Page 226 14 General settings (Configuration) SRM-3000 Option Explanation Cell Name Table Selects a cell name table See sec. 14.7, page 14-9 Device Information Displays instrument information See sec. 14.8, page 14-11 Clock Sets the date / time See sec. 14.9, page 14-13...
-
Page 227: Configurations For "Spectrum Analysis" Mode
SRM-3000 14 General settings (Configuration) 14.1 Configurations for “Safety Evaluation” mode ✓ The CONFIGURATION menu is open. 1. Use the rotary control to highlight “Configure Safety Evaluation Mode”. 2. Press the ENT button. The CONFIGURATION SAFETY EVALUATION menu opens. Configurations for the input attenuation (Measurement Range) and averaging parameters (Number of Averages) are set here. -
Page 228: Configurations For "Umts P-Cpich Demodulation" Mode
14 General settings (Configuration) SRM-3000 14.3 Configurations for “UMTS P-CPICH Demodulation” mode ✓ The CONFIGURATION menu is open. 1. Use the rotary control to highlight “Configure UMTS P-CPICH Demodulation Mode”. 2. Press the ENT button. The CONFIGURATION UMTS EVALUATION menu opens. -
Page 229: Configurations For "Time Analysis" Mode
SRM-3000 14 General settings (Configuration) 14.4 Configurations for “Time Analysis” mode ✓ The CONFIGURATION menu is open. 1. Use the rotary control to highlight “Configure Time Analysis Mode”. 2. Press the ENT button. The CONFIGURATION TIME ANALYSIS MODE menu opens. -
Page 230: Selecting A Safety Standard
14 General settings (Configuration) SRM-3000 14.5 Selecting a safety standard Note: Safety standards can be selected and transferred to the SRM-3000 using the “SRM-Tools” or “SRM-TS” PC software. ✓ The CONFIGURATION menu is open. 1. Use the rotary control to highlight “Standard”. -
Page 231: Selecting A Service Table
1. Use the rotary control to highlight “Service Table”. 2. Press the ENT button. The “SERVICE TABLE LIST” selection box opens. The various service tables stored in the SRM-3000 are listed here. Fig. 14-3 “SERVICE TABLE LIST” selection box 3. Use the rotary control to highlight a service table. - Page 232 14 General settings (Configuration) SRM-3000 Displaying a service table ✓ The CONFIGURATION menu is open. ✓ The “Service Table List” is displayed. 1. Use the rotary control to highlight a service table. 2. Press the Show Table softkey. The selected service table is displayed.
-
Page 233: Selecting A Cell Name Table
(long name, up to 35 characters). Note: Cell name tables can be edited, created and transferred to the SRM-3000 using the “SRM-Tools” or “SRM-TS” PC software. ✓ The CONFIGURATION is open. 1. Use the rotary control to highlight “Cell Name Table”. - Page 234 14 General settings (Configuration) SRM-3000 Displaying a cell name table ✓ The CONFIGURATION menu is open. ✓ The “Cell Name Table List” is displayed. 1. Use the rotary control to highlight a cell name table. 2. Press the Show Table softkey.
-
Page 235: Displaying Device Information
SRM-3000 14 General settings (Configuration) 14.8 Displaying device information ✓ The CONFIGURATION menu is open. 1. Use the rotary control to highlight “Device Information”. 2. Press the ENT button. The “DEVICE INFORMATION” display box opens. Device-specific information such as the serial number, ID number, software version and date of last calibration is displayed here. - Page 236 SRM-3000 Diagnostic function (Device Diagnostic) This function delivers detailed information about the device. For example, it tells you which options are activated and provides assistance for Narda service. ✓ The “DEVICE INFORMATION” display pane is open. 1. Press the Device Diag softkey.
-
Page 237: Setting The Date And Time
SRM-3000 14 General settings (Configuration) 14.9 Setting the date and time ✓ The CONFIGURATION menu is open. 1. Use the rotary control to highlight “Clock”. 2. Press the ENT button. The CLOCK menu opens. The date format can be selected and the date and time entered or edited here. - Page 238 14 General settings (Configuration) SRM-3000 Fig. 14-11 CLOCK menu - Date entry Entering the time 1. Use the rotary control to highlight “Time”. 2. Press the ENT button. 3. Use the rotary control and the < and > softkeys to set the time.
-
Page 239: Setting The Number Format (Configure General)
SRM-3000 14 General settings (Configuration) 14.10 Setting the number format (Configure General) ✓ The CONFIGURATION menu is open. 1. Use the rotary control to highlight “Configure General”. 2. Press the ENT button. The “CONFIGURE GENERAL” display box opens showing the “Number Format”... -
Page 240: Selecting The Parameters For The Measurement Range Search (Configure General)
14 General settings (Configuration) SRM-3000 14.12 Selecting the parameters for the measurement range search (Configure General) The SRM uses two parameters to search for the best measurement range automatically. • NORMAL is suitable for all signals that are more or less static. -
Page 241: Selecting An Antenna / Sensor
Note: Antenna or sensor data can be created, edited and transferred to the SRM-3000 using the “SRM-Tools” software. This step is not required for Narda antennas because the SRM automatically recognizes the antenna or sensor data via the control cable as soon as it is connected to the multi pin connector. -
Page 242: Selecting A Cable
Note: Antenna or sensor cable data can be created, edited and transferred to the SRM using the “SRM-Tools” software. This step is not needed if Narda cables are used because the SRM-3000 automatically recognizes the data via the control cable as soon as it is connected to the multi pin connector. - Page 243 SRM-3000 14 General settings (Configuration) Fig. 14-13 “CABLE LIST” display box 3. Use the rotary control to highlight an item. 4. Press the ENT button. The data for the selected antenna cable will be used for the evaluations. 14-19...
-
Page 244: Creating And Managing Setups
14 General settings (Configuration) SRM-3000 14.15 Creating and managing setups The SETUP button is used for storing a complete instrument configuration. The following settings are stored: • Operating mode • Operating mode parameters • Antenna and cable • Standard • Service table •... - Page 245 SRM-3000 14 General settings (Configuration) Store current setup Stores the current settings. A setup name must be entered. Factory setup Loads the factory default setup. Recall setup Loads the highlighted setup. Delete setup Deletes the highlighted setup. Delete all Deletes all the setups after confirmation.
- Page 246 14 General settings (Configuration) SRM-3000 “Repairing” a saved setup ✓ The message “SRM Setup Check” is displayed. 1. Make a note of the error message that is displayed, e.g. “Could not find specified antenna”. 2. Press the ENT key. The setup opens.
-
Page 247: Maintenance And Repairs
15 Maintenance and repairs 15.1 Changing the battery pack 1. Unscrew the battery holder lock. 2. Remove the cover. 3. Pull out the battery pack using the strap provided. 4. Slide in a new battery pack. The battery pack is designed so that it cannot be inserted wrongly. 5. -
Page 248: Cleaning
15 Maintenance and repairs SRM-3000 Function Cover Lock Battery pack with strap Table 15-1 Changing the battery pack Battery pack disposal Do not throw away battery packs with household trash. Take them to the appropriate recycling collection center or return them to the manufacturer for disposal. -
Page 249: Ac Adapter / Charger
SRM-3000 15 Maintenance and repairs 15.3 AC Adapter / Charger The AC Adapter / Charger is not designed to be repaired. If a defect occurs or operation is faulty, the entire unit must be replaced. Opening the unit Electric shock Parts carrying live voltages may be exposed when the AC Adapter / Charger is opened. - Page 250 15 Maintenance and repairs SRM-3000 Notes: 15-4...
-
Page 251: Adapting The Instrument Configuration Using "Srm-Tools" Or "Srm
16 Adapting the instrument configuration using “SRM-Tools” or “SRM-TS” 16.1 Task of the “SRM-Tools” software Fig. 16-1 “SRM-Tools” software The PC configuration software “SRM-Tools” is a stand-alone software tool that runs on any customary PC under Windows 2000 or higher. The software performs the following main tasks: •... - Page 252 16 Adapting the instrument configuration using “SRM-Tools” or “SRM-TS” SRM-3000 Note: The PC configuration software “SRM-Tools” is included with the SRM-3000. The PC software “SRM-TS” can be purchased. It includes all the functions of “SRM-Tools” combined with convenient remote-control, evaluation, and database functions. You do not need to install the “SRM-Tools”...
-
Page 253: Connecting A Pc To The Srm-3000
SRM-3000 16 Adapting the instrument configuration using “SRM-Tools” or “SRM-TS” 16.2 Connecting a PC to the SRM-3000 Note: You do not have to connect the SRM to a PC in order to process configuration data for the SRM. The connection is only required when data are to be transferred to or from the SRM. -
Page 254: Serial Interface Connection
SRM-3000 16.2.1 Serial interface connection ✓ The SRM-3000 and PC are switched off. 1. Connect the serial interface (1) of the SRM to a serial port of the PC using a zero modem cable. You can also use a serial to USB adapter if you want to use the USB port on your PC. - Page 255 SRM-3000 16 Adapting the instrument configuration using “SRM-Tools” or “SRM-TS” First time connection Description for the Windows 2000 operating system ✓ The “SRM-Tools” or “SRM-TS” software is installed on the PC, but the application is not running. 1. Switch on the SRM and set the Remote Control Port to USB (see sec.
- Page 256 16 Adapting the instrument configuration using “SRM-Tools” or “SRM-TS” SRM-3000 First time connection Description for Windows XP operating system ✓ The “SRM-Tools” or “SRM-TS” software is installed on the PC, but the application is not running. 1. Switch on the SRM and set the Remote Control Port to USB (see sec.
- Page 257 SRM-3000 16 Adapting the instrument configuration using “SRM-Tools” or “SRM-TS” The following message appears: Fig. 16-5 “Hardware Installation” window This message appears because the driver has not passed the “Windows Logo Test” routine provided by Microsoft. It has, however, been thoroughly tested and can be used without reservations.
- Page 258 16 Adapting the instrument configuration using “SRM-Tools” or “SRM-TS” SRM-3000 First time connection Description for Windows Vista operating system ✓ The “SRM-Tools” or “SRM-TS” software is installed on the PC, but the application is not running. 1. Switch on the SRM and set the Remote Control Port to USB (see sec.
- Page 259 SRM-3000 16 Adapting the instrument configuration using “SRM-Tools” or “SRM-TS” Selecting the USB port on the PC The USB driver sets up a virtual COM port when you connect the SRM basic unit to the PC using a USB cable. You will have to select this COM port manually if SRM-TS does not locate it automatically.
-
Page 260: Srm Configuration
Creating a configuration The “SRM-Tools” software performs the following tasks: • Creation and management of up to 20 antenna factor lists for non-Narda antennas. Antenna factors for Narda antennas do not need to be entered because the SRM-3000 detects them automatically. - Page 261 SRM-3000 16 Adapting the instrument configuration using “SRM-Tools” or “SRM-TS” Fig. 16-8 “SRM-Tools” software in “Configuration” mode Transferring a configuration from the PC to the basic instrument ✓ SRM and PC are connected together (see sec. 16.2, page 16-3). ✓ “SRM-Tools” or “SRM-TS” is running and is in “Device Configuration”...
- Page 262 16 Adapting the instrument configuration using “SRM-Tools” or “SRM-TS” SRM-3000 Always therefore transfer a complete data set with ALL the configurations that you want to save in the SRM, i.e the new ones AND the old ones. If you are in any doubt, you can first transfer the configurations from the basic instrument to the PC (image).
-
Page 263: Reading Out The Stored Results From A Srm
SRM-3000 16 Adapting the instrument configuration using “SRM-Tools” or “SRM-TS” 16.4 Reading out the stored results from a SRM All the results saved by the SRM can be transferred to the PC using the “SRM-Tools” software. ✓ SRM and PC are connected together (see sec. 16.2, page 16-3). - Page 264 16 Adapting the instrument configuration using “SRM-Tools” or “SRM-TS” SRM-3000 Fig. 16-11 List of transferred data sets The “SRM-Tools” software provides the following features in this mode: • Export all results or individual results in text or CSV format for further ...
-
Page 265: Updating The Firmware Of The Srm
16 Adapting the instrument configuration using “SRM-Tools” or “SRM-TS” 16.5 Updating the firmware of the SRM Malfunction Downgrading from a higher to a lower firmware version can cause the SRM-3000 to malfunction. Caution ✓ The new firmware release is stored on the PC. Data loss Updating the firmware can take up to 10 minutes. -
Page 266: Activating Options
Options are delivered along with new firmware releases. To activate them, you require a special code (Option Key) which you will find in the “SRM-3000 Options Passport”. This document is supplied along with the purchase documents for the option. 1. Connect the AC Adapter / Charger to the SRM. - Page 267 SRM-3000 16 Adapting the instrument configuration using “SRM-Tools” or “SRM-TS” If activation is successful, the option status will change to UNLOCKED. Fig. 16-13 8. Exit the “SRM-Tools” software. 16-17...
-
Page 268: Installing And Uninstalling "Srm-Tools" Or "Srm-Ts
16 Adapting the instrument configuration using “SRM-Tools” or “SRM-TS” SRM-3000 16.7 Installing and uninstalling “SRM-Tools” or “SRM-TS” To install “SRM-Tools” or “SRM-TS” 1. Insert the CD-ROM in the PC CD-ROM drive. 2. Open the “SRM Tools” or “SRM-TS” folder using the file manager (Windows Explorer). -
Page 269: Remote Control
17 Remote control All the instrument functions can be remote controlled using a remote control program (e.g. a standard terminal emulator such as “Hyperterminal”). The following hardware is required for this: • PC with serial interface • Interface cable (zero modem cable supplied) –... -
Page 270: Switching The Srm To Remote Controlled Operation
✓ The data connection has been made. ✓ The interface parameters have been set. ⇒ Transmit the command Remote<ws>ON<SC> (<ws> = white space, <SC> = semicolon) The SRM-3000 should now display the following: Fig. 17-2 SRM-3000 in remote control mode 17-2... -
Page 271: Fundamentals Of Remote Control
SRM-3000 17 Remote control Help for problems Check the following if the SRM does not switch to remote control mode: • Has the correct remote control cable been used (zero modem cable)? • Do the interface parameters of the PC and the SRM match? •... -
Page 272: Parameter Syntax
17 Remote control SRM-3000 17.3.2 Parameter syntax The parameters in the commands have various formats: Parameter Explanation String The maximum number of characters or values that can be assumed by a parameter is specified in the remote control command. The use of upper or lower case letters is decided within a string by a block without a space. -
Page 273: Separate Document About Remote Control
This document contains the individual remote control commands as well as some example programs. You can obtain the latest version of this PDF document about remote control by requesting it from Narda. 17-5... - Page 274 17 Remote control SRM-3000 Notes: 17-6...
-
Page 275: Specifications
18 Specifications 18.1 Frequency range and operating modes Frequency range 100 kHz to 3 GHz Operating modes Spectrum Analysis Safety Evaluation UMTS P-CPICH Demodulation (Option) Time Analysis − Time Controlled Storing (Option) 18.2 RF characteristics 18.2.1 Frequency Resolution bandwidths (RBW) See individual operating mode specifications Phase noise (SSB) - Page 276 18 Specifications SRM-3000 Intrinsic noise -120 dBm for 1 kHz RBW, f > 20 MHz and measurement range (MR) = -27 dBm RF attenuation 0 to 50 dB in 1 dB steps (coupled to measurement range) Second order < -57 dBc for two signals with levels 9 dB below the...
-
Page 277: Spectrum Analysis" Mode
SRM-3000 18 Specifications 18.2.2 “Spectrum Analysis” mode Measurement type Spectrum analysis Resolution bandwidths 1 kHz to 5 MHz in decade steps of 1, 2, 3, 5, and 10. (RBW, -3 dB) List of available resolution bandwidths depends on the SPAN setting Measurement range Manually from list or using the “MR Search”... -
Page 278: Safety Evaluation" Mode
18 Specifications SRM-3000 Display functions Y-axis display range: 20, 40, 60, 80 or 100 dB Y-axis reference point: -47 dB to +43 dB Full Screen mode: Function enabling the entire display to be used to show the spectrum Zoom Zoom Min: Zoom window lower frequency setting... -
Page 279: Umts P-Cpich Demodulation" Mode (Option)
SRM-3000 18 Specifications Display functions Table view showing service names, field strength contributions, and corresponding frequency band (maximum three columns) Full Screen mode: Function enabling the entire display to be used to show the table Noise suppression Determines whether measured values are above the device noise floor by setting a threshold (0, 3, 6, 10, 15, 20 dB relative to the intrinsic noise). - Page 280 18 Specifications SRM-3000 Marker functions − Highest peak, right peak, left peak, next highest peak, in “Hold” status only, next lowest peak “Bar graph”, “Mixed” and Selection of Value or Max. Value display “Graph” display modes Evaluation function Extrapolation factor for multiplying the individual results and the overall result, selectable from 0 to 100 in steps of 0.001...
-
Page 281: Time Analysis" Mode
SRM-3000 18 Specifications “Value” display mode Total of selected scrambling codes: Value and Max. value shown as enlarged numerical display “Graph” display mode Total of selected scrambling codes: Graphic display of history for the past 1 to 60 minutes Noise suppression... -
Page 282: Measurement Functions
Antenna factors Used for displaying results in units of field strength Stored in all Narda antennas during calibration Up to 20 antenna factor lists for non-Narda antennas can be saved (these lists are defined using “SRM-Tools” or “SRM-TS” PC software) - Page 283 Cable attenuation factors Used to correct the power level display Stored in all Narda cables during calibration Up to 20 cable attenuation factor lists for non-Narda cables can be saved (these lists are defined using “SRM-Tools” or “SRM-TS” PC software)
- Page 284 18 Specifications SRM-3000 Memory Storage modes Instantaneous result storage: • Spectrum in “Spectrum Analysis” mode (SPEC) • Table in “Safety Evaluation” mode (TAB) • Values in “UMTS P-CPICH Demodulation” mode (UTAB) • Values in “Time Analysis” mode (VAL), Also lists of values with “Time Controlled Storing”...
-
Page 285: General Specifications
SRM-3000 18 Specifications 18.2.7 General specifications Operating temperature -10 °C to +50 °C for operation from batteries and AC range adapter / charger unit 0 °C to +40 °C for recharging Humidity < 29 g/m3 (< 93% at +30 °C) - Page 286 18 Specifications SRM-3000 Interfaces RS-232 Electrical or optical (with optional accessory); transmission speed 115.2 kbaud USB 1.1 Power supply Rechargeable batteries Battery Lithium-ion rechargeable battery Typical operating time 4 hours Rechargeable using AC adapter / charger unit External power supply AC/DC Adapter (12 V DC / 2.5 A)
-
Page 287: Three Axis E-Field Measurement Antenna Specifications
SRM-3000 18 Specifications 18.3 Three axis E-field measurement antenna specifications The three axis measurement antenna is included with the SRM-3000. 18.3.1 Characteristics Frequency range 75 MHz to 3 GHz The correction factors individually determined during calibration are stored in an EEPROM and are applied automatically when used together with the SRM basic unit. -
Page 288: Measurement Uncertainty
18 Specifications SRM-3000 18.3.2 Measurement uncertainty Extended Frequency range Single axis Isotropic measurement measurement with measurement uncertainty three axis antenna (when used with 75-900 MHz +2.4 / -3.4 dB +2.4 / -3.3 dB SRM basic unit and 1.5 m RF 901-1400 MHz +2.3 / -3.1 dB... - Page 289 SRM-3000 18 Specifications ESD and EMC EN 61326:2004 Safety EN 61010-1:2002 CE (European Yes (Conformity declaration: see page 18-24) Community) Dimensions and weight Dimensions 450 mm long, 120 mm antenna head diameter Weight 450 g Calibration Calibration 18 calibration points: 75, 100, 200, 300, 433, 600, 750, 900 MHz, 1, 1.2, 1.4, 1.6, 1.8, 2, 2.2, 2.45, 2.7, 3 GHz.
-
Page 290: Single Axis E-Field Antenna Specifications (3531/01)
18 Specifications SRM-3000 18.4 Single axis E-field antenna specifications (3531/01) The single axis E-field measurement antenna 3531/01 is available as an option. 18.4.1 Characteristics Frequency range 27 MHz to 3 GHz Antenna type E-field Sensor type Single axis broadband dipole Dynamic range 90 µV/m to 80 V/m... -
Page 291: Measurement Uncertainty
SRM-3000 18 Specifications 18.4.2 Measurement uncertainty Extended measurement Frequency range Single axis 1, 2) uncertainty measurement with (when used with SRM basic unit antenna and 1.5 m RF cable) 36 - 300 MHz 2.1 dB 301 - 433 MHz 2.3 dB 434 - 1600 MHz 2.1 dB... - Page 292 18 Specifications SRM-3000 ESD and EMC EN 61326:2004 Safety EN 61010-1:2002 CE (European Yes (Conformity declaration: see page 18-24) Community) Dimensions and weight Dimensions 460 mm long, 135 mm x 90 mm antenna head dimensions Weight 450 g Calibration Calibration...
-
Page 293: Single Axis E-Field Antenna Specifications (3531/02B)
SRM-3000 18 Specifications 18.5 Single axis E-field antenna specifications (3531/02B) The single axis E-field measurement antenna 3531/02B is available as an option. 18.5.1 Characteristics Frequency range 100 kHz to 300 MHz Antenna type E-field Sensor type Single axis, active broadband dipole Dynamic range 125 µV/m to 16 V/m... -
Page 294: Measurement Uncertainty
18 Specifications SRM-3000 18.5.2 Measurement uncertainty Extended measurement Frequency range Single axis 1, 2) uncertainty measurement with (when used with SRM basic unit antenna and 1.5 m RF cable) 0.1 - 20 MHz 2.7 dB 20.1 - 300 MHz 2.0 dB Calibration uncertainty <... - Page 295 SRM-3000 18 Specifications Dimensions and weight Dimensions 460 mm long, 135 mm x 90 mm antenna head dimensions Weight 550 g Calibration Calibration 141 calibration points. The SRM basic unit interpolates linearly between the calibration points. Recommended calibration interval 24 months...
-
Page 296: Single Axis H-Field Antenna Specifications (3551/01)
18 Specifications SRM-3000 18.6 Single axis H-field antenna specifications (3551/01) The single-axis H-field measurement antenna 3551/01 is available as an option. 18.6.1 Characteristics Frequency range 100 kHz to 300 MHz Antenna type H-field Sensor type Single axis loop antenna Dynamic range 0.4 µA/m to 71 mA/m... -
Page 297: General Specifications
SRM-3000 18 Specifications 18.6.3 General specifications Operating temperature -10 °C to +50 °C (same as SRM basic unit) range Humidity < 29 g/m3 (< 93% at +30 °C) Standards compliance Climatic Storage 1K3 (IEC 60721-3), extended to -10 °C to +50 °C... -
Page 298: Conformity Declaration
18 Specifications SRM-3000 18.7 Conformity declaration 18-24... - Page 299 SRM-3000 18 Specifications 18-25...
- Page 300 18 Specifications SRM-3000 Notes: 18-26...
-
Page 301: Measurement Methods Using A Single Axis Antenna
Appendix A: Measurement methods using a single axis antenna This Appendix describes methods that can be used to determine field strength exposure using a single axis antenna, e.g. a customary antenna. It also describes how the SRM can be used with these methods. Pendulum or sweep method (mobile measurement) Measurement setup The single axis antenna is fitted directly on to the basic instrument or the... - Page 302 Using a cable to connect the antenna to the basic instrument: see page 5-8. Alternatively, the single axis antenna can be fitted to a tripod and connected to the basic instrument by a long cable. Fitting the Narda antenna to a tripod: see page 5-11.
- Page 303 SRM-3000 Appendix A Procedure The rotation method may be considered as a combination of the sweep method and the matrix method. As with the matrix method, the volume to be measured is considered in terms of a cylinder that is supposed to represent the human body. The...
- Page 304 The single axis antenna is mounted on a tripod and connected to the basic instrument by a long cable. Fitting the Narda antenna to a tripod: see page 5-11. Defining the matrix The measurement volume is sampled at points on a fixed matrix during a measurement using the matrix method.
- Page 305 SRM-3000 Appendix A Measurement procedure 1. Fit the antenna to the tripod with the antenna positioning device. 2. Place the tripod at the first point of measurement. 3. Set the tripod to the first measurement height. 4. Perform sequential measurement at this position as described in sec.
- Page 306 Appendix A SRM-3000 Notes:...
-
Page 307: Technical Descriptions
Appendix B: Technical descriptions Measurement principle Signal frequencies of 3 GHz can hardly be sampled digitally. The SRM therefore uses a combination of analog and digital signal processing. The SRM is not a customary spectrum analyzer. It has been engineered specially to enhance particular characteristics for the analysis of electromagnetic fields. - Page 308 Appendix B SRM-3000 The 1st mixer converts the input signal to the first IF of 3 972 MHz. The IF filter has a bandwidth of 6.8 MHz. The LO (local oscillator) can be set on a frequency raster of 400 kHz (coarse tuning). The oscillator is pre-tuned to a frequency close to the desired frequency so that the PLL (phase-locked loop) locks quickly to the correct frequency.
- Page 309 4 MHz with one FFT. If the FFT range is insufficient, the RF synthesizer may have to be retuned several times to other frequencies. The SRM-3000 then performs the FFT block by block and forms the overall result from the individual FFT results.
- Page 310 It is similar for the x axis, which is linked to the frequency span and the resolution bandwidth (RBW). The SRM-3000 provides resolution bandwidths from 1 kHz up to 5 MHz - fine enough to separate long wave transmitters from one another and broad enough to capture an entire UMTS frequency block.
- Page 311 The resolution bandwidth is set automatically so that there are still eight spectral lines in the narrowest band. The SRM-3000 thus achieves high measurement accuracy without wasting time on the measurement. All of takes place unseen by the user, who does not need to worry about what is happening.
- Page 312 Appendix B SRM-3000 “UMTS P-CPICH Demodulation” mode The problem with measuring the electromagnetic fields that emanate from mobile phone base stations is that the output power level varies according to the level of traffic. As a result, the field strength also varies. However, both GSM and UMTS use at least one channel per base station that transmits at a constant, known power level.
- Page 313 Hertz. This is a highly precise frequency, since the prescribed deviation from the nominal frequency for base stations in the UMTS system is less than 0.1 ppm. The SRM-3000’s AFC thus reduces the field strength measurement error due to mis-tuning to negligible values.
- Page 314 Appendix B SRM-3000 three spatial axes one after the other, and no measurement results can be recorded while the instrument is switching from one axis to another. The three axis antenna can be used for continuous recording of results if one axis is selected for measurement.
- Page 315 SRM-3000 Appendix B “Spatial Averaging” function The major standards concerned with human exposure to radio frequency radiation specify maximum exposure levels averaged over the whole body. The co-linear dipole antenna arrays that are very common in modern wireless communications systems, for example, have multiple lobes close to the antenna.
- Page 316 Appendix B SRM-3000 Spatial Averaging can be used in “Safety Evaluation” mode, “Spectrum Analysis” mode and “Time Analysis” mode, but not in “UMTS P-CPICH Demodulation” mode. Depending on the operating mode, the SRM averages • the individual results for the different services (“Safety Evaluation”...
- Page 317 SRM-3000 Appendix B The SRM averages all the recorded measurement values. If the field remains constant over time, the order in which the measurement points within the room are sampled is unimportant. When discrete averaging is performed using a single axis antenna, the SRM automatically calculates the isotropic result for each measurement point in the room.
- Page 318 Appendix B SRM-3000 Notes: B-12...
-
Page 319: Instrument Graphics
Appendix C: Instrument graphics Complete instrument Element Antenna Side with antenna and cable connection LCD panel, rotary control, operating keys, and Status and Charge LED Side with battery holder, serial interface and connector for AC Adapter / Charger Carrying strap... - Page 320 Function Antenna connector socket • N connector 12 pole socket (multi pin connector) for connecting the control cable • If a Narda antenna or Narda cable is used this socket automatically detects the antenna and cable.
- Page 321 SRM-3000 Appendix C Side with battery holder and external connections On the base of the instrument you will find the battery holder on the left and three further external connections on the right: USB, serial interface, AC Adapter / Charger.
- Page 322 Appendix C SRM-3000 Notes:...
- Page 323 Connecting customary antenna Average time 7-12, 8-12, 9-29 types using a cable 5-10 Averaging time 10-18 Connecting the Narda cable to the Narda antenna Connecting the Narda cable to the Battery holder 6-12, 15-1, C-1 Connecting to the PC 17-1...
- Page 324 Destruction of AC Adapter / Entering a default comment 13-18 Charger Entering the date 14-13 Diagnostic function (Device Entering the measurement Diagnostic) 14-12 range Dimensions 18-11, 18-15, 18-18, Entering the numerical value and 18-21, 18-23 units Discharge indication Entering the time 14-14 Discrete averaging 12-2, 12-8...
- Page 325 Loading a setup 14-21 N connector 5-5, 5-6, 5-8, 5-9, Loading the factory default 5-10, 5-13, 6-12, 18-2, C-2 setup 14-22 Number format 14-15 Low battery Number of Averages 7-11 Number of averages 8-12, 9-28 Main board, digital Malfunction through incorrect Observation length 9-14, 10-6 2-2, 2-3...
- Page 326 18-12 Selecting the maximum number of Reducing / enlarging the zoom data sets 13-6 area 8-25 Selecting the reference value Registering a non-Narda automatically 8-19, 10-8 antenna 5-14 Selecting the result type 10-17 Registering a non-Narda Selecting the store mode...
- Page 327 Setting the upper limit of the zoom USB interface 17-1 area 8-23 Using the Backspace softkey Softkey functions 13-3, 13-18 Using the rotary control Softkeys Spare parts 15-3 Spatial averaging 12-1, B-9 Velcro strips 5-11, 5-13 Starting storage 13-7 Starting the charge cycle Status LED 3-4, 6-1, 6-9, C-1 Stopping automatic storage...
- Page 328 Narda Safety Test Solutions GmbH Sandwiesenstrasse 7 72793 Pfullingen, Germany Int’l phone: +49 7121-9732-777 Int’l fax: +49 7121-9732-790 E-mail: support@narda-sts.de www.narda-sts.com Narda Safety Test Solutions 435 Moreland Road Hauppauge, NY 11788 USA phone: 631-231-1700 USA fax: 631-231-1711 E-mail: NardaSTS@L-3COM.com www.narda-sts.com...
Need help?
Do you have a question about the SRM-3000 and is the answer not in the manual?
Questions and answers