Table of Contents
Advertisement
Quick Links
Advertisement
Table of Contents

Subscribe to Our Youtube Channel
Related Manuals for Larson Davis SoundTrack LxT


Summary of Contents for Larson Davis SoundTrack LxT
- Page 1 LxT Manual SoundTrack LxT ® & SoundExpert LxT...
- Page 2 Larson Davis LxT Manual SoundTrack LxT & SoundExpert I770.01 Rev K Supporting Firmware Version 2.301...
- Page 3 Copyright 2016 by PCB Piezotronics, Inc. This manual is copyrighted, with all rights reserved. The manual may not be copied in whole or in part for any use without prior written consent of PCB Piezotronics, Inc. Trademarks , SoundTrack LxT and SoundExpert are registered trademarks of PCB Piezotronics, Inc.
-
Page 4: Table Of Contents
Unpacking and Inspection ..................3-1 Connecting the Microphone and Preamplifier ............3-2 Connecting the Preamplifier to the LxT ............... 3-3 Disconnecting the Preamplifier from the LxT ............3-4 Powering the SoundTrack LxT ................3-4 Chapter 4 Basic Measurement Setup Measurement Settings Tabs .................. 4-1... - Page 5 Control Panel - Calibrate ..................7-2 Acoustic Calibration ....................7-4 Sensitivity Tab .....................7-11 Calibration Without Preamplifier ................7-13 Certification ......................7-14 Chapter 8 Voice Recording Launching the Voice Recorder Dialog ..............8-1 Making a Voice Recording ..................8-2 Playing a Voice Recording ..................8-3 Storing Voice Recordings ..................8-3 Chapter 9 Time History Parameters Logged ....................9-1...
- Page 6 Chapter 13 Lock/Unlock the LxT 13-1 Control Panel - Lock ................... 13-1 Fully Locked ....................... 13-4 Locked With Auto-Store ..................13-5 Locked With Manual-Store ................. 13-7 Calibration When The LxT Is Locked ..............13-7 Chapter 14 About 14-1 Control Panel - About ..................14-1 About Tab ......................
- Page 7 Standards Met by LxT ..................A-1 LxT Specifications ....................A-2 Electromagnetic Emission .................. A-15 1/1 and 1/3 Octave Filters ................... A-16 Position of Instrument and Operator ..............A-19 Frequency Response ................... A-20 Microphone Preamplifier Specifications ............A-43 Vibration Sensitivity ................... A-59 Appendix B Testing to IEC61672-1 1 Sections 5, 6, 7 and 9 (except 9.3) ................
-
Page 8: Lxt Features
SoundExpert sound level meters. SoundTrack LxT The following sections describe the features for the SoundTrack LxT. Hardware Features The Larson Davis SoundTrack LxT has the following features: • Precision integrating sound level meter • 2 GB unformatted standard data memory •... -
Page 9: Basic Operation
• LXT-LOG: Automatic data logging with intervals from 1 second to 24 hours • LXT-HSLOG: Extends data dogging (LXT-LOG) with intervals down to 100 milliseconds • LXT-ENV: Measurement History Environmental Data Logging • LXT-CN: Community Noise SoundTrack LxT LxT Manual... - Page 10 • ADP002 6.8pF adaptor for 1/4 in., 7pF microphone (377C01 or 377C10) • ADP005 18pF adaptor for 1/2 in., 18pF microphone (375B02) • ADP090 12pF adaptor for 1/2 in., 12 pF microphone (377B02) LxT Manual SoundTrack LxT...
- Page 11 - PSA029 Power Supply - CBL138 USB Cable Other • 377C20 1/2” random incidence pre-polarized microphone, mV/Pa, providing performance conforming to Class 1 sound level meter standards • ACC003 Headset with microphone for voice recording/ Playback (included LXT-DVA) SoundTrack LxT LxT Manual...
-
Page 12: Soundexpert Lxt
• LXT-CCS Storage Case Environmental Protection • EPS2116 Environmental Shroud • EPS2106-2 Environmental Shroud • EPS2108-2 Environmental Shroud • EPS030-LXT Environmental Case with one lead acid battery to be used with an external microphone tripod (the tripod is not included) Tripods •... -
Page 13: Standard Features
Hardware Features The hardware features for t he SoundExpert LxT are the same as those for the SoundTrack LxT. Additionally, the following accessories are included with the SoundExpert LxT: • PSA029 Power Supply • CBL138 USB Cable Standard Features The SoundExpert LxT is delivered with the standard features listed below. -
Page 14: Power Supplies
• Lanyard Optional Accessories Equivalent Electrical Impedance Adaptor An equivalent electrical impedance adapter can be used in place of the microphone when a measurement is being made electrically. The adapter is simply a series capacitor with the same capacitance as the microphone it is replacing. The following adapters are available: •... - Page 15 • EPS2106/8-2 Environmental Shroud outdoor microphone protection • EPS030-LXT Environmental Case with one lead acid battery to be used with an external microphone tripod (the tripod is not included) Tripods • TRP001 Instrument/Camera Tripod with ADP032 1/2 inch microphone clip. Use with EPS2108-2 Calibrators •...
-
Page 16: Chapter 2 Overview
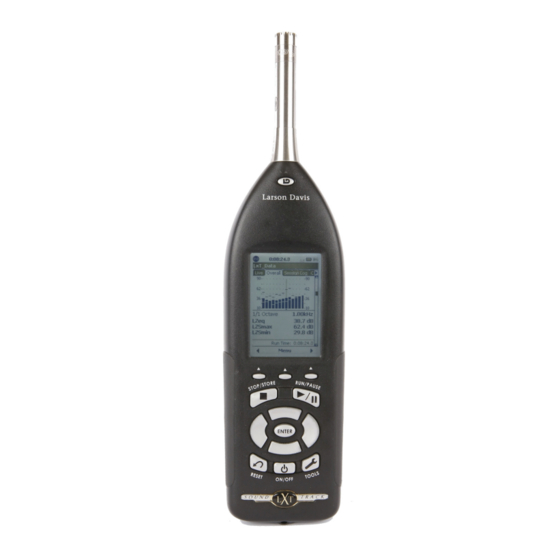
C H A P T E R Overview This chapter provides an overview of the SoundTrack sound level meter, including the following sections: • LxT Components • Summary of Displays and Icons • Navigating and Selecting • Basic Run Functions •... - Page 17 The standard LxT shown in FIGURE 2-1 includes the following: • 1/2 in. diameter condenser microphone • Backlit graphic 160 x 240 pixel LCD display • 13-key soft rubber backlit keypad • AC/DC output, control, USB, and external power connectors (shown in FIGURE 2-2) •...
- Page 18 • AC/DC Output and Headset Jack: This jack is used to output analog AC and DC signals or to connect to headsets for recording and playback of voice records • Auxiliary USB Connector: The auxiliary USB connector allows attaching USB storage devices. Display The LxT has a 160 x 240 graphic, liquid crystal display that is backlit to provide comfortable viewing in most ambient...
- Page 19 Keypad The LxT has a 13 button keypad. This section describes the buttons on the keypad. Softkeys The three buttons just beneath the display, on the body of the LxT, are called Softkeys, as shown in Figure 2-3. Above each Softkey, on the bottom of the display, is an icon or label indicating the action that takes place when the key is pressed.
- Page 20 Use the Power, or ON/OFF button to turn the LxT on and off. The hardware power wwitch on the base of the unit must be in the “|” position. Use the Navigation buttons Up, Down, Left and Right to move to areas on the display, to make selections from multiple options, or to enter alphanumeric characters into data fields.
-
Page 21: Summary Of Displays And Icons
Summary of Displays and Icons Tabs Data on the LxT is presented in a tabbed format. Move between tabs by using the right and left Softkeys. Pages Tabs are divided into pages that logically group the data together (i.e., 1/3 Octave data on the Live tab). Navigate up or down to different pages by using the 8 (Up) and 2 (Down) keys. - Page 22 While the overload is present, the icon flashes. When the overload is removed, the icon disappears from the display. If a measurement is running and an overload occurs, the icon shown below flashes during overloads. When the overload has been removed, the icon is still present (not flashing) to indicate that overloads have occurred during the measurement.
-
Page 23: Navigating And Selecting
starts the run after the initialization has completed (less than 10 seconds). Run Icon The Run icon is animated, moving from left to right to indicate that a measurements is in progress. Pause Icon The Pause icon indicates that the current measurement has been paused. -
Page 24: Basic Run Functions
Basic Run Functions The basic measurement run functions are as follows: • Running • Pausing • Stopping • Storing (RUN/PAUSE) key initiates a run. If a measurement is running, this key pauses the run. It does not end the run; to end the measurement run, press the (STOP/STORE) key. - Page 25 Measurement Settings Tabs Opening From the Data Display tabs, pressing the Center Softkey labeled Menu brings up the menu shown in FIGURE 2-5. FIGURE 2-5 Menu Select Settings and press to open the Settings tabs. Closing Press the Center Softkey to return the Data Display tabs. Control Panel (Tools) Properties The Control Panel is accessed by pressing the (TOOLS)
- Page 26 • Session Log: The Session Log is a record of data accumulation actions. A time-stamped record is made for every Run, Pause, Stop or Voice Message action. • Current (optional) used conjunction with Measurement History. Similar to the Overall tab except that data is based on the most recent run instead of the first run of the measurement.
-
Page 27: Chapter 12 System Properties
• Markers (optional): Use in conjunction with time history measurements, this feature permits the user to annotate portions of a time history record to identify noise sources or make other notes. • Day/Night (optional): Defines hours for day, night, and evening periods for 24-hour noise monitoring. - Page 28 Data Explorer For a detailed description of Data The Data Explorer is used to examine data that has been Explorer, see Chapter 12 in the stored following previous measurements. It is also used to section entitled “Data Explorer” on manage stored measurements, such as rename or delete files. page 12-1.
- Page 29 About For a detailed description of the The About tabs provide the user with information specific to About tabs, see Chapter 14 in the this instrument, such as serial number, options, etc. section entitled “About” on page 14- The About tabs include the following: •...
-
Page 30: Preparing For First Use
• Connecting the Microphone and Preamplifier • Disconnecting the Preamplifier • Powering the SoundTrack LxT Unpacking and Inspection Retain the packaging for safe Your LxT has been shipped in protective packaging. Please shipment for calibration service. verify that the package contains the items listed below. -
Page 31: Connecting The Microphone And Preamplifier
The microphone model and serial numbers are engraved on the outside of the microphone, as shown in FIGURE 3-1. The preamplifier model and serial numbers are engraved on the preamplifier body as shown in FIGURE 3-2. FIGURE 3-1 Microphone You may be asked to provide this information during any ... -
Page 32: Connecting The Preamplifier To The Lxt
Connecting the Preamplifier to the LxT The connectors are keyed for correct Insert the preamplifier into the mating connector on the LxT alignment. and rotate the preamplifier until the keyways line up. Press the assemblies together until a small click is heard. Caution: Do not attempt to unscrew If the LxT is powered when the preamplifier is inserted, a the collar/ring at the top of the LxT... -
Page 33: Disconnecting The Preamplifier From The Lxt
LxT, as shown in Figure 3-4. Preamplifier Release Button FIGURE 3-4 Preamplifier Release Button Powering the SoundTrack LxT The following sections provide power information for the LxT, including the following: • Important Notice Regarding Proper Shutdown •... - Page 34 When the unit is powered on again, either with fresh batteries or an external power supply, the unit returns to the state it was in when it shut down. LxT Manual Powering the SoundTrack LxTâ...
- Page 35 LxT while the drive is being copied, or if the LxT is within Data Explorer mode. External Power Supply PSA029 In addition to running on batteries, or USB power, the LxT can be powered from a PSA029 power supply. When Powering the SoundTrack LxTâ LxT Manual...
-
Page 36: Power Settings
Power Control Page, as shown in FIGURE 3-7. FIGURE 3-7 Power Control Page The first section of this page shows the estimated battery run time (calculated using the voltage of the installed batteries), battery voltage, and the USB power voltage. LxT Manual Powering the SoundTrack LxTâ... - Page 37 The Center Softkey provides an exit, Pressing the Center Softkey, labeled Close, closes the escape or cancel function as well as Power Control page. the function displayed above it on the display. Powering the SoundTrack LxTâ LxT Manual...
-
Page 38: Basic Measurement Setup
C H A P T E R Basic Measurement Setup This chapter describes how to setup the LxT to perform basic sound level measurements, including the following: • Leq, Lmax, Lmin corresponding to user-selected values of frequency weighting and detector •... - Page 39 Settings In Use Message If the LxT is not already connected to If the Blaze, SLM Utility-G3, or G4 software is already a computer running Blaze, SLM connected to the LxT when an attempt is made to access the Utility-G3, or G4 software, ignore Measurement Settings Screen, the display shown in this section.
- Page 40 General Tab Figure 4-2 shows the General tab. FIGURE 4-2 General Tab The SLM Utility-G3 or G4 software The General Tab is used to enter file names and can be used to easily enter both the measurement descriptions for the measurements being file name and the measurement defined.
- Page 41 SLM Tab Figure 4-2 shows the SLM tab. FIGURE 4-3 SLM Tab To modify settings on the SLM tab, navigate to either Frequency Weighting, Detector, Peak Weighting, or Integration Method page and press Frequency Weighting A, C and Z frequency weightings are provided for the RMS and peak detectors.
- Page 42 Octave Band Analyzer Tab (Optional) default values these This tab only appears when the LxT has the optional LxT- parameters shown OB1 or LxT-OB3 firmware enabled. FIGURE 4-4. FIGURE 4-4 OBA Tab OBA Parameter Selection The OBA parameters are selected as shown in FIGURE 4-5. Left Click to Select FIGURE 4-5 OBA Parameter Selection OBA Range Setting...
- Page 43 Graph scaling range OBA Frequency Weighting modified by the user, as described in The user can select that the 1/1 and/or 1/3 Octave frequency “Graph Scale Adjustment” analysis modules process data from the A, C or Z weighting page 5-2. filters.
- Page 44 Dosimeter 1 and 2 Tabs Figure 4-6 shows the Dosimeter 1 tab. FIGURE 4-6 Dosimeter 1 The Dosimeter 1 and Dosimeter 2 tabs are provided to permit the evaluation of two independent noise dose data sets. Other than being on separate tabs, they are identical. Predefined Setups In most cases, measurements of this type are setup to conform to specific standards.
- Page 45 Name field already The names of the predefined setups can be accessed from the highlighted when the Dosimeter Name field at the top of the display. Press to show a list View is opened. If this has been of predefined setups by name as shown in FIGURE 4- changed, use the key to move 7 "Predefined Dose Setups"...
- Page 46 Ln Tab Figure 4-8 shows the Ln tab. FIGURE 4-8 Ln Tab The Ln value is the measured sound level that exceeds n% of the measurement time. For example, a value of L = 35 dB means that the measured sound level is above 35 dB for 90% of the measurement period.
- Page 47 Control Tab The Control tab, shown in Figure 4-9, is used to set the Run Mode for the measurement to be performed. FIGURE 4-9 Control Tab When the optional firmware LXT- The Run Mode on the Control tab can be setup for one of been enabled, six modes, including the following.
- Page 48 • Daily Timer: The measurement is initiated manually by pressing the 9 key and is stopped by pressing the 7 key. Measurements are made only during the separate time blocks defined by the setup. When the Control tab is opened, the Run Mode field is already selected.
- Page 49 Entering Run Time for the Timed Stop Mode To enter the Run Time, navigate to select the Time data field and press . You can then move left and right to different digit positions in the data field using the 4 and 6 keys, as shown in Figure 4-12.
- Page 50 the following sections are for setups without Measurement History enabled. When Measurement History enabled, measurement must be manually stored at the conclusion of the duration. Because only a single measurement exists, the data displayed on the Overall and Current tabs is identical. Continuous The Continuous run mode is similar to the Manual Stop mode, except that Daily Auto-Store can also be enabled, in...
- Page 51 The selection and setting of appropriate parameters for the Continuous, Single Block Timer and Daily Timer run modes is shown in FIGURE 4-14. Click to open data fields for blocks 2 and FIGURE 4-14 Setup of Continuous, Daily Timer and Single Block Time Run Modes For each run mode option, select the corresponding data field and press the .
- Page 52 Select the data field and use the navigation keys to specify the start time. Run Mode with Measurement History Measurement History requires that To measure and store sequences of measurements using the the optional firmware LXT-ENV be same setup, either manually or automatically, you can use enabled.
- Page 53 FIGURE 4-17 shows the Day/Night tab. FIGURE 4-17 Day/Evening/Night Definition The day-night level L defined by the following formula: 0700 2200 2400 10 10 ----- - 10Log ...
- Page 54 • Day: 07.00 to 19.00 • Evening: 19.00 to 23.00 • Night: 23.00 to 07.00 Lday, Levening and Lnight are A-weighted long-term average sound levels measured during the day, evening and night, respectively. To account for the increased impact of environmental noise during the evening and night, penalties are added to the measured level;...
- Page 55 4-18 Measurement Settings Tabs LxT Manual...
-
Page 56: Data Display
C H A P T E R Data Display This chapter describes how data is displayed for basic sound level measurements. Data Labels The LxT sound metrics labels are designated by international standards. For many displayed values, the frequency and time weighting are indicated in the name of the metric. - Page 57 Selecting Options for Settings within Tabs By using the 4 and 6 keys or the 8 or 2 keys to move between options on tabs or pages, you can select options by highlighting them. Once the desired value or option is selected, press (ENTER).
-
Page 58: Live Tab
Select Adjust Graph and press to obtain the Adjust Graph menu shown in FIGURE 5-3 FIGURE 5-3 Adjust Graph Menu Move the 4 and 6 keys to change the baseline level and the 8 or 2 keys to adjust the height (range between the baseline and the top of the display). - Page 59 Profile Page The Profile page presents recent graphic history of L using the user-selected frequency weighting, calculated for each second. The graph presents the last 120 seconds of the measurement. Figure 5-4shows the Profile page. Profile of 1 Sec Leq using selected Frequency Weighting from Setup Current Value of 1 Sec Leq using selected Frequency Weighting from Setup...
- Page 60 Digital Page The Digital page displays both the instantaneous sound level and the value of the user-selected SPL1 Trigger Level, as shown in Figure 5-5. Current SPL using selected Frequency Weighting and Detector, Updated Once per Second SPL1 Trigger Level Indication of Current Exceedance of SPL1 Trigger Level FIGURE 5-5 Live Tab, Digital Page...
- Page 61 1/1 Octave Page (Optional) The 1/1 Octave Band Analyzer The 1/1 Octave page displays bar graphs of sound level in 1/ appears only when the sound level 1 octave frequency bands, as shown in Figure 5-6. The right meter is loaded with the optional most bar on the graph is the selected broadband SPL value LxT-OB1 or LxT-OB3 firmware.
- Page 62 1/3 Octave Page (Optional) The 1/3 Octave Band Analyzer page The 1/3 Octave Page is similar to the 1/1 Octave Page, but appears only when the sound level the graph and data are presented for 1/3 octave filters, as meter is loaded with the optional shown in Figure 5-7.
-
Page 63: Overall Tab
Power Page The Power page displays the current Date and Time, the run time for the measurement, the battery voltage, the calculated run time and the memory usage. The Memory section indicates the amount of memory available as a percentage and in number of kilobytes. The number of stored data files is also indicated. - Page 64 • Percentiles • Exceedances • Overloads • Community Noise • Miscellaneous • Memory Profile (with Overall Leq) Figure 5-10 shows the Profile page of the Overall tab. Leq using Frequency Weighting and Detector from Setup Sound Level Currently Selected Weighting and Detector FIGURE 5-10 Overall Tab, Profile Page Digital Figure 5-11shows the Digital page of the Overall tab.
- Page 65 FIGURE 5-11 Overall Page, Digital Page The Digital page presents a profile of the sound level for the run time of the measurement. The run time for the average calculation is shown at the top of the screen. The graph is updated once per second and the calculation of the average sound level is updated approximately four times per second.
- Page 66 1/1 Octave (Optional) The 1/1 Octave Band Analyzer page The 1/1 Octave page displays bar graphs of sound level in 1/ appears only when the optional 1 octave frequency bands, as shown in Figure 5-13. firmware LxT-OB1 or LxT-OB3 has been enabled and this measurement mode has been selected in the setup.
- Page 67 FIGURE 5-14 Overall Tab, 1/3 Octave Page Dosimeter 1 and 2 There are two separate, but similar, dosimeter data displays in these pages. Figure 5-15 shows the measurement parameters that correspond to the setup named “OSHA-1”. FIGURE 5-15 Overall Tab, Dosimeter 1 &...
- Page 68 value of Criterion Time is set by selecting predefined setups, as described in “Predefined Setups” or by entering numerical values, as described in “Threshold and Criterion”. For example, suppose a measurement was performed over a time period of ten minutes. The value of TWA(8) would be the same as the TWA measured over an eight hour period if there were no other sound exposure other than that which occurred during that ten minute period.
- Page 69 SEL (Sound Exposure) Figure 5-16 shows the SEL page. The SEL page displays Sound Exposure metrics, (in this instance for A-weighted, Slow). FIGURE 5-16 Overall Tab, SEL Page is the sound exposure level (previously known as SEL). The Sound Exposure metrics indicate the actual and extrapolated (8 and 40 hours) exposure accumulated in terms of hours and seconds.
- Page 70 The SEA parameter is used mainly in The SEA page is an integration of 1 second peaks that the Canadian province of Quebec. exceeded 120 dB, as shown in Figure 5-17. Both the SEA value and the frequency weighting used for the measurement are displayed.
- Page 71 Percentiles The Percentiles page displays the Ln statistics for the measurement based on the run time, as shown in Figure 5- 18. Also shown are the maximum and minimum sound levels measured. An Ln is the level that was exceeded “n” percent of the time.
- Page 72 Exceedances Exceedances occur when the instantaneous sound levels are greater than set trigger levels. The Exceedances page shows the number of exceedances that have occurred during the measurement and the total duration of exceedances. Exceedances are shown for two threshold levels of the RMS detector and three for the peak detector, as shown in Figure 5-19.
- Page 73 Overloads The Overloads page displays any overloads that might have occurred during the measurement, as shown Figure 5-20. FIGURE 5-20 Overall Tab, Overloads Page Community Noise The times intervals associated with The Community Noise page displays three equivalent the Day, Evening and Night periods levels calculated for the total measurement time, as shown in are set as described in “Triggers Figure 5-21.
- Page 74 C minus A and Impulsivity Figure 5-22 shows the C minus A level and Impulsivity pages. FIGURE 5-22 C-A Level and Impulsivity Page The integrated levels for L are always calculated using the linear detector, regardless of the value selected in the SLM Setup.
-
Page 75: Session Log Tab
Memory The Memory page presents the quantity of each type of measurement made and the memory status, as shown in Figure 5-23. FIGURE 5-23 Overall Tab, Memory Page Session Log Tab The Session Log is a record of sound measurement actions, as shown in Figure 5-24. -
Page 76: View Spectrum Normalized (Optional)
A time-stamped record is made for every Run, Pause, Stop, Voice Message or Marker action. The source responsible for each action is also recorded, which may be any of the following: • Key press • USB command • Run timer compete •... - Page 77 A standard spectrum displayed on the Live tab appears as shown in FIGURE 5-25. FIGURE 5-25 Live Spectrum Display To access the View Normalized display, press the center softkey Menu to display the menu shown in FIGURE 5-26 when viewing 1/1 or 1/3 octave data. FIGURE 5-26 Menu 5-22 View Spectrum Normalized (Optional)
- Page 78 Select View Normalized. This displays the spectrum in the normalized view, as shown in FIGURE 5-27. FIGURE 5-27 Normalized Live Spectrum Display By default the display represents a spectrum normalized to reference spectrum 1. If reference spectrum 1 has not been previously defined, the display shows the actual live SPL spectrum.
- Page 79 Select the Ref: data field and press to open the Reference Menu, as shown in FIGURE 5-29. FIGURE 5-29 Live Reference Menu The items listed in this menu are as follows: • • • • • • • • The first four items permit the user to define four reference spectra.
- Page 80 FIGURE 5-30 shows an -A reference display for an A- weighted version of a spectrum. FIGURE 5-30 Normalized Spectrum with -A Weighting Graph Relative Selecting Graph Relative changes the graph to show the difference between the current data and the reference, with the center of the graph being 0dB.
- Page 81 5-26 View Spectrum Normalized (Optional) LxT Manual...
-
Page 82: Making Measurements
Microphone Extension Cable If desired, a microphone extension cable may be placed between the meter and the preamplifier/microphone. No correction is required when using Larson Davis Model EXC<xxx> shielded microphone extension cables in combined lengths up to 200 feet. (The variable <xxx>... -
Page 83: Performing Measurements
Larson Davis provides the WS001 windscreen, a 3 1/2” diameter ball made of open cell foam which can be placed over the microphone and preamplifier as shown in FIGURE 6-1. -
Page 84: Measurement Range
Measurement Range The measurement ranges in which the LxT meets the standards, which depend upon the selected frequency weighting, are shown in Table A-4, “LxT Performance Specifications,” on page A-4. Measurements which include levels outside this range should not be considered accurate. Overload Indication When input signals exceed the input range of the LxT, the Input Overload Icon appears at the top of the display. - Page 85 Pausing Measurements At any time the measurement of overall data can be temporarily suspended by pressing the 9 key. Note that the run clock also pauses. However, instantaneous data continues to be displayed on the Live tab. Pressing the 9 key one more time starts the measurement Measurements may be paused and then run again multiple times.
- Page 86 > Ten Seconds Since Last Stop or Pause After pressing the center softkey to implement a five second back erase, if the measurement duration since the last Stop or Pause has been more then ten seconds, the center softkey is then labeled Back-10s, as shown in FIGURE 6-4. Ten Second Back Erase Label FIGURE 6-4 Ten Second Back Erase Label The Back-10 label does not indicate...
- Page 87 < Ten Seconds Since Last Stop or Pause After pressing the center softkey, if the measurement duration since the last Stop or Pause has been less than ten seconds, the center softkey is then labeled Undo, as shown in FIGURE 6-5. Back Erase Undo Indication FIGURE 6-5 Back Erase Undo Indication The user can take one of the following actions:...
-
Page 88: Storing Measurements
Resetting Measurements To reset a measurement in progress, press the 1 (RESET) A measurement is most often reset when a noise event which is not key. This erases all data previously measured and resets the typical of the desired measurement run time clock to zero. - Page 89 After a file has been successfully The data is stored under the file name defined in the section stored, the LxT automatically resets "General Tab" along with a file number. The file number when the key is pressed to begin automatically begins at 000 for the first measurement stored.
-
Page 90: Data Storage After Improper Shutdown
To continue with the overwrite operation, select Yes and press Data Storage After Improper Shutdown When the LxT has been shutdown improperly during a measurement, for example during a power outage, the procedure for handling the data depends upon the setup being used at the time of the measurement. - Page 91 Improper Shutdown Following an improper shutdown, when the instrument is next turned On: Step 1 The user is prompted to save the data. • If the user responds by selecting to store the data, the data is stored and the instrument is reset •...
- Page 92 Data Saved Save Data prompt No Response for 10 seconds Reset Instrument prompt No Response for 10 seconds Instrument Reset FIGURE 6-9 Improper Shutdown Sequence, Case 2 LxT Manual Data Storage After Improper Shutdown 6-11...
- Page 93 6-12 Data Storage After Improper Shutdown LxT Manual...
-
Page 94: Chapter 7 Calibration
C H A P T E R Calibration This chapter describes both the purposes and steps for calibrating the SoundTrack LxT and SoundExpert LxT. Calibration Overview Sensitivity Determination The primary role of sound level meter calibration is to... -
Page 95: Control Panel - Calibrate
Large Change Notification During calibration, an automatic comparison is made between the sensitivity determined by the calibration and a published value of sensitivity. An on-screen window appears to warn the user when the difference between these two values exceed 3 dB. Control Panel - Calibrate To activate the Calibration function, press the (TOOLS) - Page 96 The four Calibration tabs are shown in FIGURE 7-2. Calibrate Tab History Tab Sensitivity Tab Certification Tab FIGURE 7-2 Calibration Tabs Calibrate Tab The Calibrate tab is used when performing an acoustic calibration, including the selection of the sound level calibrator to be used and the implementation of the calibration procedure.
-
Page 97: Acoustic Calibration
History Tab To create a history record for a The History tab lists the results, along with the date and calibration, it must be saved; time, of the ten most recent calibrations performed using the calibrations must also be saved to same type of preamplifier as presently connected to the LxT. - Page 98 Calibrating the LxT1 and 377B02 microphone The CAL200 provides a nominal pressure level of 94 dB or 114 dB. The exact levels are printed on the Larson Davis calibration sheet that came with the calibrator. When using a free-field microphone, the pressure level at the microphone diaphragm is slightly different.
- Page 99 If the system is calibrated at 18° C then it is 0.045 dB more sensitive at 23° C. The Larson Davis 3" Wind Screen has less than 0.05dB effect on the system response at 1 kHz. Set the CAL200 level switch to 94 or 114 dB.
- Page 100 -0.015 dB/°C. If the system is calibrated at 18° C then it is 0.07 dB less sensitive at 23° C. The Larson Davis 3" Wind Screen has less than 0.05dB effect on the system response at 1 kHz.
- Page 101 Instrument Class Parameter Range Static Pressure 65 kPa to 108 kPa Class 2, LxT2 with 375B02 9.4 psi to 15.7 psi microphone 0 C to + 40C Temperature 32 F to + 104F Relative Humidity 25% to 90%, without condensation from - 10 C to + 39C (14 F to + 102F) Table 7-2 Environmental Parameter Ranges for Calibration...
- Page 102 The microphone being used is selected from the Sensitivity tab shown in FIGURE 7-2. Larson Davis Microphone If using one of the Larson Davis microphones most frequently used with the LxT, highlight the down arrow portion of the Type data field to obtain a list of microphones such as shown in FIGURE 7-4.
- Page 103 If using a microphone from another manufacturer, or if the Under Range Levels Larson Davis microphone type being used does not appear determined when the microphone is in this list, the name and parameters can be entered not selected from the drop down list manually.
- Page 104 You can simply verify the calibration When the calibration is completed, select Yes to save the selecting No. Also, results of the calibration. Select No to cancel the results of significant changes are seen you may the calibration. choose to answer No. However, to create an historical record for it, or to export post-calibration data, you must save it.
-
Page 105: Sensitivity Tab
Sensitivity Tab The Sensitivity tab, shown in FIGURE 7-8, is used primarily to establish the noise floor of the instrument with the preamplifier and microphone presently being used and, from that, determine the under range levels for A, C and Z- weighting sound level measurements. -
Page 106: Calibration Without Preamplifier
When a calibration has been performed using any of the four preamplifiers listed above, that calibration information is saved for that preamplifier. If the preamplifier is switched from one of these types to another, then the calibration information already saved for that new preamplifier type is recalled. - Page 107 FIGURE 7-9 Sensitivity Tab Without Preamplifier In this situation, the sensitivity of the transducer and the self noise can be entered directly, if known. 7-14 Calibration Without Preamplifier LxT Manual...
-
Page 108: Certification
Certification The Certification tab is shown in FIGURE 7-10. FIGURE 7-10 Certification Tab A certification interval of one year is The user has the opportunity to set the calibration interval recommended but this can be and a calibration reminder. lengthened or disabled depending on applicable requirements. - Page 109 Available values of Certification Interval are as follows: • 1 Year • 2 Years • 3 Years • 4 Years • Never The default value is Never Available values of Certification Reminder are as follows: • 15 Days • 30 Days •...
- Page 110 7-17 LxT Manual Certification...
-
Page 111: Voice Recording
C H A P T E R Voice Recording The LxT provides a voice recorder as a convenient way to annotate measurements. Voice recordings can be made with or without a headset, are sampled at 8 kHz, and can be up to 20 seconds long. Launching the Voice Recorder Dialog To activate the voice recorder dialog, press the 3 (TOOLS) key and navigate to the Voice Recorder icon as shown in... -
Page 112: Making A Voice Recording
Select the Voice Recorder icon and press 5 to open the The Voice Record list is initially empty. dialog shown in FIGURE 8-2. FIGURE 8-2 Voice Recorder Making a Voice Recording With Headset When using a headset, the Jack When a headset is connected to the headset jack, voice Function must to set to “Headset”... -
Page 113: Playing A Voice Recording
Playing a Voice Recording Voice recordings can also be played FIGURE 8-2 shows that voice records are presented in a list back from the Session Log. on the dialog. To play back a recording via the headset jack, select the desired recording in the list and press the right soft key (labeled with the icon). -
Page 114: Time History
C H A P T E R Time History This chapter describes the measurement features associated with the optional data logging firmware LXT- LOG and LXT-HSLOG. Parameters Logged With the optional firmware LXT-LOG enabled, the Time History mode permits the LxT to automatically log up to twenty parameters, both acoustic and non-acoustic, at time intervals ranging from 1 second to twenty-four hours. - Page 115 Table 9-2 shows additional acoustical parameters that are logged for Time History. Parameter Label Description Optional firmware LxT-OB1 is required. OBA 1/1 Leq Optional firmware LxT-OB1 is required. OBA 1/1 max Optional firmware LxT-OB1 is required. OBA 1/1 min Optional firmware LxT-OB3 is required. OBA 1/3 Leq Optional firmware LxT-OB3 is required.
-
Page 116: Time History Setup
Increased Timer Resolution Tms Resolution When the optional firmware LXT-HSLOG is enabled and the time history interval has been selected to be 500 ms or less, the parameter Tms causes the time value to be measured and saved with higher resolution. Time History Setup To set up Time History, navigate to the Time History tab, as shown in Figure 9-1. - Page 117 Set Time History Period To set the Time History Period, select the Period data field and press to list all the available values of time, as shown (partially) in Figure 9-2. FIGURE 9-2 Time History Period Menu The values 100 ms, 200 ms and 500 The following values are available for selection as time ms appear only when the optional increments for Time History:...
-
Page 118: Time History Tab
The first item in the options list is highlighted, as shown in Figure 9-3. FIGURE 9-3 Time History Options Window Press 6 to select a check box option. Press 4 to deselect a box already checked. Exiting Time History Options When the options have been selected, press to exit from the Time History Options Menu. - Page 119 Graph scaling can be modified as The first display, labeled Run, represents the keypress described in section “Graph Scale initiating the measurement, with the corresponding data and Adjustment”. time. There is no measured data associated with this sample point. Data Display at Cursor Position Press the 6 key once to display data measured during the first time interval, as shown in FIGURE 9-5.
- Page 120 At any time, the role of the left and right arrow keys, as well as the means to change it, are indicated in the lower portion of the display, as shown in FIGURE 9-6. Left and Right Arrow keys Step through Records Switch role of left/right arrow keys from “Change Record”...
-
Page 121: Link To Measurement History Display
Frequency Spectra When the LxT is equipped with the When frequency spectra have been included in the metrics to optional firmware LXT-OBA and be measured in the setup, as described in ‘Time History either the 1/1 octave spectra or the Setup”... -
Page 122: Markers
Markers Markers are used to annotate portions of the time history, especially for the purpose of identifying sound sources as they become dominant in the measurement. The LxT offers ten separate user-definable markers. Markers Setup default values these Markers are setup using the Markers tab, as shown in parameters are shown in FIGURE 9- Figure 9-10. - Page 123 Naming a Marker The process of naming markers is Select the field of the marker to be named and press simplified by using the SLM Utility- This produces a cursor that can be moved left and right to different digit positions in the data field using the 4 and 6 G3 or G4 software.
- Page 124 Highlight Mark Sound Type and press , which modifies the Time History display as shown in Figure 9-14. FIGURE 9-14 Time History Display with Markers Setting Markers On/Off At any time during a measurement, any of the markers can be set On or Off. Select the field of the desired marker. Pressing the 4 key toggles the marker status between Off and On.
- Page 125 The first display, labeled Run, represents the keypress initiating the measurement, with the corresponding data and time. There is no measured data associated with this sample point. 9-12 Markers LxT Manual...
-
Page 126: Measurement History
C H A P T E R Measurement History This chapter describes Measurement History setup and operation, as well as the data displays associated with the feature. The optional firmware LXT-ENV must be enabled to perform measurement history (Timed Stop and Continuous Run Modes) Enabling Measurement History Before beginning to work with... -
Page 127: Continuous And Timer Modes
TABLE 10-1 shows when measurement histories are created for each run mode. Run Mode Measurement History Creation when Stop is pressed Manual when instrument stops Timed Stop when instrument stops Stop When Stable at every pre-specified period (1 minute minimum) Continuous at every pre-specified period (1 minute minimum) Single Block Timer... -
Page 128: Timed Stop Mode
Valid Measurement Times When other values are selected, the The interval time sync function is intended to be used with interval time sync still functions, but the following measurement time values: time which first • 1, 5, 10, 15, 20 or 30 minutes measurement is cut short is different. - Page 129 Measurement Displays When a measurement is in progress, the data appears on the Current tab, as shown in FIGURE 10-4. The first numerical value displayed, L in this example, is Leq using the ASeq frequency weighting and detector from the setup. The second numerical value displayed, in this example, is a user-selected parameter.
- Page 130 Measurement Tab During the first measurement, the The Measurement tab displays data for any of the same data appears on the Overall previously completed measurements. These measurement and Current tabs. After that, the records are numbered in sequence from the first to the last. overall measurement continues while The data displayed on the History page of the new current measurements are made...
- Page 131 Selecting and Changing Record Numbers For all pages of the Measurement tab, except the History page, the selected record number is indicated below the graph, as shown in FIGURE 10-6. Level versus Time Graph for the Selected Record Leq and Maximum and Minimum Levels Selected Measurement Record...
- Page 132 Depending on firmware options and the configured setup, the Measurement tab may include up to 14 tabs. TABLE 10-2 shows Measurement tab pages that may appear on your meter. The table includes the page name and an example of how the page may appear. Page Page Name Example...
- Page 133 Page Page Name Example Sequence Digital 1/1 Octave TABLE 10-2 Measurement Tab Pages 10-8 Display of Measurement History LxT Manual...
- Page 134 Page Page Name Example Sequence 1/3 Octave Dose 1 Dose 2 TABLE 10-2 Measurement Tab Pages Display of Measurement History 10-9 LxT Manual...
- Page 135 Page Page Name Example Sequence Percentiles TABLE 10-2 Measurement Tab Pages 10-10 Display of Measurement History LxT Manual...
- Page 136 Page Page Name Example Sequence Exceedances Overloads Miscellaneous TABLE 10-2 Measurement Tab Pages Display of Measurement History 10-11 LxT Manual...
-
Page 137: Link To Time History
There is no cursor on the Profile Non-Spectra Displays graph, nor a numerical display of With the exception of frequency spectra displays, the 6 and amplitude or time. 4 keys are used to step the selected measurement record number up or down, respectively. Frequency Spectra Displays When a frequency spectrum is displayed, you can navigate to the right or left so that the levels can be displayed for... -
Page 138: Data Explorer
C H A P T E R Data Explorer This chapter describes how to view the stored data files in the SoundTrack LxT and SoundExpert LxT Data Explorer. Control Panel - Data Explorer To display the Data Explorer Page, press the (TOOLS) key. - Page 139 Data Explorer consists of just one page, the Data Explorer page, as shown in FIGURE 11-2. Highlighted Data File Toggles Between Scrolling Modes FIGURE 11-2 Data Explorer Navigational Scrolling Modes There are two navigational scrolling modes: • By item (default mode): pressing the up or down arrow key moves to previous or next data files in sequence.
- Page 140 To leave this menu without selecting an option, press the Close Softkey. View View opens the selected file to see its contents. Delete Delete causes a message box to appear asking you to confirm the request, as shown in FIGURE 11-4. FIGURE 11-4 Delete File Press to delete or select No and press...
- Page 141 Overwrite an Existing File You can also overwrite a stored file. In the Rename File prompt, select the Browse button and press to display a list of file names, as shown in FIGURE 11-6. FIGURE 11-6 File Name List Select a name from the list and press .
- Page 142 Jump to Beginning The Jump to Beginning option selects the first data file listed. Jump to End The Jump to End option selects the last data file listed LxT Manual Control Panel - Data Explorer 11-5...
- Page 143 11-6 Control Panel - Data Explorer LxT Manual...
-
Page 144: System Properties
C H A P T E R System Properties This chapter describes the System Properties tabs, which you can use to identify or control functions of the sound level meter not related to sound measurement or calculations. Control Panel - System Properties To activate the System Properties tabs, press the (TOOLS) key. -
Page 145: Device
Device It is easier to enter the text The Device tab displays three fields in which the user may information for these three fields enter information about the instrument, as shown in Figure using the Blaze software or the SLM 12-2. -
Page 146: Time
Time Use the Time tab to specify the time and date for the LxT, as shown in Figure 12-3. FIGURE 12-3 Time Tab Setting Day and Year Navigate to select the Day and Year fields for System Date. to select the 1st character position. Use the 8, Press 2, 4 and 6 keys to change the values. -
Page 147: Power
Setting the Time Navigate to the System Time field and specify the time for the meter in the same manner used for setting the Day and Year. Navigate to the Set Time button and press Sync Data/Time with PC Selecting the Sync Date/Time with PC check box enables the LxT time to be set to the PC time when the unit is connected to the SLM Utility-G3 or G4 software. - Page 148 Select the desired time and press The default is Alkaline. Do not use 3.8 Volt Lithium WARNING:Do not mix Alkaline and NiMH batteries. batteries; they will blow the fuse. WARNING:Do not mix batteries from different manufacturers WARNING:Replace all four batteries when installing fresh cells WARNING:The correct battery type must be specified based on the battery type installed.
- Page 149 display and to the analog circuitry to save power when the Power-Save Time is set to a value other than Never. The display is powered down when no keys on the instrument have been pressed for the time set. Pressing any key reactivates the display.
- Page 150 Exit from Power Save Mode Press any of the following keys to exit from the power save mode: 7 (STOP/STORE) • 1 (RESET) • • (RUN / PAUSE): There is a short delay before the instrument starts recording data. The following actions also cause an exit from the power save mode: •...
-
Page 151: Preferences
Backlight Using the backlight on Bright The Backlight field sets the intensity of the backlight. To set significantly increases power it, select the field and press to open the Backlight Menu, consumption and decreases battery as shown in FIGURE 12-10. life. - Page 152 FIGURE 12-11 shows the Preferences tab. FIGURE 12-11 Preferences Tab To change the fields on the Preferences tab, navigate and select values as described in previous sections. Microphone Correction When using a free-field microphone, a correction can be applied to provide a random incidence response or, when using a random incidence microphone, a correction can be applied to provide a free-field response.
- Page 153 • None • Prompt • Store To set the Auto-Store preference, select the field and press as shown in FIGURE 12-13. FIGURE 12-13 Auto-Store Preferences Select the desired setting and press None Press the 7 key to stop the measurement. Press it again to store the data and also assign a filename.
- Page 154 Run Mode Type of Stop Auto-Store Preference Prompt Store Timer-activated final Prompts when timer File automatically stored stop is complete Timed Stop Manually-activated No action performed No action performed (stop key) Timer-activated stop Prompts when stable File automatically stored Stop When Manually-activated Prompts when Stable...
- Page 155 The jack function setting becomes To set the Jack Function preference, select the field and active as soon as it is selected. press , as shown in FIGURE 12-14. FIGURE 12-14 Jack Function Preferences Select the desired Jack function setting and press Reset Prompting If the Reset Prompting check box is selected, you are prompted with an “Are You Sure”...
- Page 156 • Auto: Store data to USB memory if available; otherwise, store to internal memory. Select the USB Storage field and press as shown in FIGURE 12-16. FIGURE 12-16 USB Storage Preferences Select the desired USB Storage and press When data is stored to USB memory, it is first stored to internal flash memory, a process which is much faster than storing directly to USB memory.
- Page 157 FIGURE 12-18 Print Screen Menu Item Selecting either option and pressing initiates the corresponding printing action. When the print is successfully completed, the message shown in FIGURE 12-19 appears. FIGURE 12-19 Print Complete Message Print Error Messages Printing without connecting the printer, or with the printer off, results in the message shown in FIGURE 12-20.
-
Page 158: Localization
Localization default values The Localization tab contains display options for values Localization tab are shown in that may vary from one country or region to another, as FIGURE 12-22. shown in FIGURE 12-22. FIGURE 12-22 Localization Tab To change the fields on the Localization tab, navigate and select values as discussed in previous sections. -
Page 159: Date Format
Select the Language field and press as shown in FIGURE 12-23. FIGURE 12-23 Language Preferences Select the desired language and press Decimal Symbol The LxT supports two formats for the decimal symbol: • Period ( • Comma ( Select the Decimal Symbol field and press as shown FIGURE 12-24. -
Page 160: Displays
Units The LxT supports both English and SI units. Select the Units field and press , as shown in FIGURE 12-26. FIGURE 12-26 Units Menu Select the desired units and press Displays The default values for the Displays The Displays tab contains options for customization of the tab are shown in FIGURE 12-27. - Page 161 Select the Start field and press as shown in FIGURE 12-28 FIGURE 12-28 Display Start Options Select the desired Start display and press Selecting Displays to Appear When there are measurement functions not being used or data displays which are not of interest for a measurement, the instrument operation can be streamlined by hiding selected displays.
- Page 162 Live Tab Displays (6) FIGURE 12-30 Live Tab Displays Overall Tab Displays (15) FIGURE 12-31 Overall Tab Displays Session Log Display FIGURE 12-32 Session Log Displays LxT Manual Displays 12-19...
- Page 163 Current Display (14) Measurement Display (13) Time History Displays (5) FIGURE 12-33 Time History Tab Displays All checked displays appear on the LxT. 12-20 Displays LxT Manual...
-
Page 164: Options
To modify any of the displays associated with one of the tabs, select the field listing those displays and press obtain the display shown in FIGURE 12-34. FIGURE 12-34 Display; Set to Appear or Hide Pressing the 4 key toggles the state of the highlighted display between Appear (checked) and Hide (unchecked). - Page 165 Note that this is temporary and does When the option is checked in mask, it is enabled in the not result in permanent loss of a instrument. Unchecking removes the option. To mask or purchased option. You can re-enable unmask any option(s), press to enter the dialog mode.
- Page 166 Select Yes and press , which produces the message shown in FIGURE 12-38, indicating that the instrument must be rebooted for the masking/unmasking changes to take effect. FIGURE 12-38 Reminder to Reboot Instrument Press to return to the System Properties Menu and reboot the instrument.
- Page 167 12-24 Options LxT Manual...
-
Page 168: Lock/Unlock The Lxt
C H A P T E R Lock/Unlock the LxT To prevent unauthorized use or tampering with measurements and data, the LxT provides a lock feature. When this is enabled, the LxT is tamper proof to one of four user-selectable levels of security. Control Panel - Lock To activate the Lock dialog, press the (TOOLS) key. - Page 169 Select the Lock Mode list box. Press to expand the drop down list, as shown in FIGURE 13-2. FIGURE 13-2 Lock Mode List Select the desired lock mode. Press to accept the selection. Lock Modes Unlocked The user has complete access to the features of the instrument.
- Page 170 Fully Locked The user has no access to the instrument, except to start a run. Auto-Store preferences are enabled in this mode. See Chapter 13 "Fully Locked" on page 13-4. A measurement cannot be reset when the Model LxT is locked in any mode.
-
Page 171: Fully Locked
Allow Calibration When Locked Select Allow Cal. When Locked. Press to toggle the state of the check boxes shown in FIGURE 13-4. If the box is checked, calibration is allowed while the unit is locked and not running. FIGURE 13-4 Allow Calibration When Locked Fully Locked When the LxT is fully locked, the display appears as shown in FIGURE 13-5. -
Page 172: Locked With Auto-Store
Also, while fully locked, pressing the (RUN/PAUSE) key starts a measurement with the message box shown in FIGURE 13-6. FIGURE 13-6 Measurement While Locked Message Selecting Yes begins the measurement. A measurement cannot be paused, stopped or stored in the Fully Locked mode. - Page 173 Pressing the key initiates storing the data file, as shown in Figure 13-8. FIGURE 13-8 Auto-Store-Stop If Yes is selected, the data file is saved. The unit is still locked and a new measurement may be started by pressing key. If No is selected, the data is reset and a new measurement can be made.
-
Page 174: Locked With Manual-Store
Locked With Manual-Store If you seelect the Locked w/Manual-Store mode, measurements are started by pressing the key. Pressing key a second time pauses the measurement and pressing it again continues the measurement. key stops a measurement and pressing it a second time initiates the storage process by displaying the “Save File”... - Page 175 If the Center Softkey indicating CAL is active, as shown in FIGURE 13-11, press this key. This displays the calibration screen. See "Calibration" for complete details on calibrating the LxT. FIGURE 13-11 Locked with Calibration Permitted 13-8 Calibration When The LxT Is Locked LxT Manual...
-
Page 176: Chapter 14 About
C H A P T E R About The About tabs summarize information about the instrument. Control Panel - About To activate the About tabs, press the (TOOLS) key and navigate to the About icon, as shown in FIGURE 14-1. FIGURE 14-1 Control Panel About Tab The About tab displays important information about the... -
Page 177: Standards
FIGURE 14-2 shows the About tab. FIGURE 14-2 About Tab Standards The Standards tab shown in FIGURE 14-3 lists standards met by the LxT. For more information on the technical standards for the LxT, refer to the section "Standards Met by LxT". -
Page 178: Options
Options Options may be added at any time. The Options tab shown in FIGURE 14-4 lists the options To purchase additional options, available for the LxT. Installed options have a check mark contact your local representative next to them. listed under “Sales” on the Larson Davis web site. - Page 179 FIGURE 14-5 shows the User tab. FIGURE 14-5 User Tab 14-4 User LxT Manual...
-
Page 180: Chapter 15 System Utilities
C H A P T E R System Utilities This chapter describes the system utilities for the LxT. System Utilities Press the key one time in order To activate the System Utilities, press the (TOOLS) key. Use the 8, 2, 4 or 6 keys to select the System to see the System Utilities icon on the Control Panel. -
Page 181: File System
File System The File System tab is used to repair or recover from file system problems. The functions available on this page are similar to functions that would be used to manage a hard drive. See Figure 15-2. FIGURE 15-2 File System The functions on the File System page are as follows: •... - Page 182 PC. If a problem is detected, an attempt is made to repair the problem. Format Selecting this function formats the internal data storage area in the memory of the LxT. This operates similar to the Format function on a PC. System and measurement settings are preserved.
- Page 183 Format USB CAUTION: When the mass storage If you believe that the Check/Repair USB operation device is formatted, all data stored described in "Check/Repair USB" on page 15-3 was not on it will be lost. successful, try formatting the USB mass storage device. Set the USB Host Port to ON, insert the USB mass storage device into the USB connector and run this utility.
- Page 184 As a result, the operation is denied and the message shown in FIGURE 15-6 is displayed. The Copy to USB icon appears on FIGURE 15-6 Cannot Check/Repair/Format Message the upper left corner of this display. LxT Manual File System 15-5...
- Page 185 15-6 File System LxT Manual...
-
Page 186: Parameters Measured
C H A P T E R Parameters Measured This chapter describes the different acoustic parameters that can be measured, displayed, and stored using the LxT. Basic Sound Level Measurements Frequency Weighting Each of the sound level parameters measured at one time is frequency weighted as set by the user from the Measurement Settings tabs. - Page 187 RMS Averaging The exponential averaging time for RMS sound levels is set to one of the following: • Slow • Fast An impulse detector is also available. Sound Level Metrics Measured In Table 16-1 "Sound Level Metrics Measured" the symbol X is used to represent the user-selected RMS and Impulse frequency weighting (A, C or Z) and the symbol Y is used to represent the user-selected peak frequency weighting (A, C...
-
Page 188: Sound Exposure Metrics Measured
Spectral data is displayed on both the Live and Overall tabs, but only the Overall Data can be stored. Live Tab From the Live tab, the graphic shows the instantaneous SPL value for all frequencies and the bar to the far right shows the summation value for the entire frequency band. -
Page 189: Statistical Metrics Measured
In Table 16-2: "Sound Exposure Metrics Measured" the symbol X is used to represent the user-selected RMS and Impulse frequency weighting (A, C or Z) and the symbol Y is used to represent the user-selected peak frequency weighting (A, C or Z). The symbol V is used to represent the user selected time weighting (F, S or I). -
Page 190: Exceedance Counters
Exceedance Counters The LxT has three exceedance event counters: two RMS event counters and three peak event counters. For each exceedance there is a threshold level, event counter, and duration. The thresholds L or L are the levels that the Ypeak parameter must exceed to increment the counter and duration. - Page 191 16-6 Miscellaneous Parameters LxT Manual...
-
Page 192: Memory Utilization
C H A P T E R Memory Utilization This chapter presents formulas to calculate the amount of memory used by the parameters that can be stored to internal memory. Out Of Memory Stop In order to ensure that all measured data can be stored, the LxT is stopped automatically when the amount of available memory drops to 100 KB. -
Page 193: Time History
Takt = 4 Bytes Time History The amount of memory utilized, in bytes, when storing time history blocks is calculated as follows: 52 + [16+4*(Number of parameters enabled)]*(Number of records) where Number of Records = Number of Samples + Number of Run, Pause and Stop events Voice Messages The amount of memory utilized, in bytes, when storing... -
Page 194: Upgrading Firmware And Options
LxT. firmware and option upgrades. Refer Refer to the Larson Davis website (www.LarsonDavis.com) to the G4 Software Manual for more to determine if you are using the most recent version of this information. - Page 195 Firmware upgrade is performed from the Manual Control tab as shown in FIGURE 18-1. FIGURE 18-1 Manual Control Page 18-2 Upgrading LxT Firmware LxT Manual...
- Page 196 Click the UpgradeSoundTrack LxT button and follow the on screen prompts until the Select File dialog box shown in FIGURE 18-2 appears. FIGURE 18-2 Select File Menu Firmware and options can be Click Browse to select the firmware file you wish to send to upgraded at the same time by the LxT.
-
Page 197: Upgrading Lxt Options
To enable additional options on the LxT, a new options file is required. To purchase additional options, contact your local representative listed under “Sales” on the Larson Davis web site (www.LarsonDavis.com). The procedure for upgrading the options installed on the LxT is the same as for upgrading firmware, except that you select “Changing installed options using a .OPT file”... -
Page 198: Appendix A Technical Specifications
A P P E N D I X Technical Specifications The specifications contained in this chapter are subject to change without notice. Please refer to calibration and measurement results for data on a specific unit. Standards Met by LxT The SoundExpert LxT meets the same standards as the LxT1. -
Page 199: Lxt Specifications
LxT Specifications Features Class 1 Precision Integrating Sound Level Meter with real-time 1/3 Octave Filters. High contrast 1/8th VGA LCD display with white LED backlight; sunlight readable Icon-driven graphic user interface Soft rubber keys Large dynamic range Time weightings: Slow, Fast, Impulse, Integration and Peak Frequency weightings: A, C, Z 1/1 and 1/3 octave frequency analysis available Voice message annotation available, which includes headset... - Page 200 Sound Level Meter Specifications RMS Time weighting Slow, Fast or Impulse A, C or Z Frequency Weightings See Frequency Weightings on page A-7. Peak detector Frequency weighting A, C or Z Reference range: Normal range Exchange rate 3, 4, 5, or 6 dB Sample rate 51,200 Hz ...
-
Page 201: Performance Specifications
Performance Specifications LxT1 LxT1L LxT2 LxT2L Direct In Measurement 39 to 140 dB 27 to 118 dB 37 to 139 dB 31 to 125 dB 13 to 117 dBV Range 39 to 140 dB 29 to 118 dB 37 to 139 dB 35 to 125 dB 10 to 117 dBV 44 to 140 dB 34 to 118 dB... -
Page 202: General Specifications
-20 °C to 70 °C ± 0.5 dB error from 30% and 90% Humidity effects relative humidity at 40 °C Equivalent microphone 12 pF for Larson Davis 1/2” microphone impedance Range level error (OBA option) ±0.1 dB relative to the reference range Digital Display Update Rate Four times per second (0.25 sec between... - Page 203 Resolution Specifications Resolution of data shown on the instrument’s display is specified in Table A-7. Higher resolution level, dose and elapsed time data are available via I/O commands and data file downloads. Levels 0.1dB Dose 0.01% Elapsed time 0.1 second Real time clock 1 second Calendar...
-
Page 204: Frequency Weightings
Frequency Weightings Electrical Microphone Microphone Nominal Exact Weight Weight Weight Limits: Limits: Limits: Frequency Frequency (Ideal) (Ideal) (Ideal) Class 1 Class 1 Class 2 10.00 -0.0 -70.4 -14.3 + 1.4, - 0.7 ±1.5 ±2.0 12.5 12.59 -0.0 -63.4 -11.2 + 0.5, - 0.6 ±1.3 ±1.8 15.85... - Page 205 Electrical Microphone Microphone Nominal Exact Weight Weight Weight Limits: Limits: Limits: Frequency Frequency (Ideal) (Ideal) (Ideal) Class 1 Class 1 Class 2 1000 1000.00 ±0.2 ±0.5 ±1.0 1250 1259.00 ±0.2 ±0.5 ±1.0 1600 1585.00 -0.1 ±0.2 ±0.5 ±1.3 2000 1995.00 -0.2 ±0.2 ±0.5...
- Page 206 Typical Z-Weight Frequency Response LxT Manual Technical Specifications...
- Page 207 AC/DC Output The purpose of the AC output is to drive a headset to listen to live and recorded sounds. It may be used for other purposes, but may not function as expected as a source for additional analysis equipment. The output is amplified for listening purposes and therefore is limited in its maximum output to be less than the instrument’s maximum input level.
- Page 208 DC Output Voltage Range 0 to +3 Volt (0 to 300 dB) V0 = SPL/100 SPL = 100*V0 Sensitivity = 0.01 V/dB with resolution of 0.001 V 3650 DC Output Impedance for less than 0.4% error DC Output Recommended Loads A 10 DC Voltmeter represents negligible error (-0.036%).
- Page 209 Time of Day Drift The LxT displays the time of day and also time-stamps various single events (i.e. maximum level). Two different time reference sources are used in the LxT depending on whether the unit power is on or off, as described in Table A-11. Instrument Power Ambient Temperature Nominal Drift in 24 hours...
- Page 210 Power Supply Batteries 4-AA (LR6) Alkaline, NiMH or Lithium cells External Power Powered through USB interface from computer or from PSA029 AC to DC Power Adapter: 5 Volt 5% required. Applying a voltage greater than specified can damage the instrument and void the warranty.
- Page 211 Memory Retention Permanently stored in non-volatile flash memory every one minute. If power Data Memory fails, maximum data loss is less than one minute. Always shut down the LxT completely before unplugging USB power connections. Otherwise, memory faults and memory wear may occur more quickly over time. Also, to avoid creating Flash Memory corruption errors, do not unplug USB drives from the USB port on the LxT while the drive is being copied, or if the LxT is within Data Explorer mode.
-
Page 212: Electromagnetic Emission
Humidity Operation: 10% to 90% Storage: 5% to 85% Emissions FCC Part 15 Class B EN55022 Class B Immunity EN61000-4-2, Level 4 EN61000-4-3, Level 2 EN61000-4-4, Level 2 EN61000-4-5, Level 3 EN61000-4-6, Level 3 EN61000-4-11 Harmonic EN6100-3-2 (A1 +A2 + A14) Flicker EN6100-3-3 0.20 A maximum 254 Vac, 54 Hz... -
Page 213: 1/1 And 1/3 Octave Filters
CBL139 AC/DC output cable with an applied acoustic field of 74 dB at 1 kHz in accordance with the following directives: • 89/336/EEC The Electromagnetic Compatibility Directive and its amending directives has been designed and manufactured to the following specifications: •... - Page 214 Sound Level Meter Model: LxT1 Serial Number: 0000033 Firmware: Certificate of 1000.0 Hz Full Octave Filter Shape This Sound Level Meter (including attached PRMLXT1 preamplifier and ADP005 18pF input adapter) was calibrated with a reference 1kHz sine wave. The instrument's 1000.0 Hz filter response was then electrically tested using a 137.00 dBSPL sinewave at selected frequencies as specified in IEC 61260-am1 (2001-09).
- Page 215 Sound Level Meter Model: LxT1 Serial Number: 0000033 Firmware: Certificate of 1000.0 Hz Third Octave Filter Shape This Sound Level Meter (including attached PRMLXT1 preamplifier and ADP005 18pF input adapter) was calibrated with a reference 1kHz sine wave. The instrument's 1000.0 Hz filter response was then electrically tested using a 137.00 dBSPL sinewave at selected frequencies as specified in IEC 61260-am1 (2001-09).
-
Page 216: Position Of Instrument And Operator
Position of Instrument and Operator When making a measurement, it is recommended that the observer be positioned as far behind and to the right of the instrument as possible to minimize interference of the sound field at the microphone resulting from body reflections. When using the LxT, the meter is held in one hand with the arm extended away from the body. -
Page 217: Frequency Response
Frequency Angle from Reference direction (degrees) (Hz) 3758.37 0.20 0.23 0.13 0.17 0.23 0.27 0.20 0.23 0.33 0.37 0.27 0.40 0.30 3981.07 0.10 0.10 0.13 0.13 0.00 0.13 0.10 0.10 0.23 0.20 0.13 0.27 0.23 4216.97 0.03 0.00 0.10 0.03 -0.10 0.07 0.00... - Page 218 LD Model: LxT1, Serial #: 0010, Normalized to 251.19Hz @ 0° Tested 11/23/05 12:25:57 by Alex T. Note: PRMLxT1/0155 and 377B02/100650 Reference Mic: B&K Model: 4189, Serial Number: 2440346, Tested: 11/23/05 08:44:02 -2.0 -6.0 -10.0 -14.0 -18.0 -22.0 -26.0 200 Hz 1K Hz 20K Hz Mic 0°...
- Page 219 LD Model: LxT1, Serial #: 0010, Normalized to 251.19Hz @ 0° Tested 11/23/05 12:25:57 by Alex T. Note: PRMLxT1/0155 and 377B02/100650 Reference Mic: B&K Model: 4189, Serial Number: 2440346, Tested: 11/23/05 08:44:02 -2.0 -6.0 -10.0 -14.0 -18.0 -22.0 -26.0 200 Hz 1K Hz 20K Hz Mic 30°...
- Page 220 Directional Characteristics LD Model: LxT1, Serial #: 0010, Normalized to 251.19Hz @ 0° Tested 11/23/05 12:25:57 by LD Note: PRMLxT1/0155 and 377B02/100650 Reference Mic: B&K Model: 4189, Serial Number: 2440346, Tested: 11/23/05 08:44:02 0° 2.0 dB -2.0 dB -6.0 dB -10.0 dB -14.0 dB -18.0 dB...
- Page 221 LD Model: LxT1, Serial #: 0010, Normalized to 251.19Hz @ 0° Tested 11/23/05 12:25:57 by Alex T. Note: PRMLxT1/0155 and 377B02/100650 Reference Mic: B&K Model: 4189, Serial Number: 2440346, Tested: 11/23/05 08:44:02 0° 6.0 dB 2.0 dB -2.0 dB -6.0 dB -10.0 dB -14.0 dB -18.0 dB...
- Page 222 LD Model: LxT1, Serial #: 0010, Normalized to 251.19Hz @ 0° Tested 11/23/05 12:25:57 by Alex T. Note: PRMLxT1/0155 and 377B02/100650 Reference Mic: B&K Model: 4189, Serial Number: 2440346, Tested: 11/23/05 08:44:02 0° 6.0 dB 2.0 dB -2.0 dB -6.0 dB -10.0 dB -14.0 dB -18.0 dB...
- Page 223 LxT With 375B02 Free Field Microphone and PRMLxT2B Preamplifier LD Model: 375B02, Serial #: 010512, Normalized to 251.19Hz @ 0° Tested 06/22/11 15:49:15 by LD Note: with LxT2 and PRMLxT2B Preamp Reference Mic: B&K Model: 4189, Serial Number: 2440346, Tested: 06/22/11 14:04:53 -2.0 -4.0 -6.0...
- Page 224 LD Model: 375B02, Serial #: 010512, Normalized to 251.19Hz @ 0° Tested 06/22/11 15:49:15 by LD Note: with LxT2 and PRMLxT2B Preamp Reference Mic: B&K Model: 4189, Serial Number: 2440346, Tested: 06/22/11 14:04:53 -2.0 -4.0 -6.0 -8.0 -10.0 -12.0 -14.0 200 Hz 1K Hz 20K Hz...
- Page 225 Directional Characteristics LD Model: 375B02, Serial #: 010512, Normalized to 251.19Hz @ 0° Tested 06/22/11 15:49:15 by LD Note: with LxT2 and PRMLxT2B Preamp Reference Mic: B&K Model: 4189, Serial Number: 2440346, Tested: 06/22/11 14:04:53 0° 4.0 dB 0.0 dB -4.0 dB -8.0 dB -12.0 dB...
- Page 226 LD Model: 375B02, Serial #: 010512, Normalized to 251.19Hz @ 0° Tested 06/22/11 15:49:15 by LD Note: with LxT2 and PRMLxT2B Preamp Reference Mic: B&K Model: 4189, Serial Number: 2440346, Tested: 06/22/11 14:04:53 0° 4.0 dB 0.0 dB -4.0 dB -8.0 dB -12.0 dB -16.0 dB...
- Page 227 LD Model: 375B02, Serial #: 010512, Normalized to 251.19Hz @ 0° Tested 06/22/11 15:49:15 by LD Note: with LxT2 and PRMLxT2B Preamp Reference Mic: B&K Model: 4189, Serial Number: 2440346, Tested: 06/22/11 14:04:53 0° 4.0 dB 0.0 dB -4.0 dB -8.0 dB -12.0 dB -16.0 dB...
- Page 228 LxT1, PRMLxT1 with 377B02 LxT1 Low Range, PRMLxT1 and 377B02 Noise 25.0 20.0 15.0 10.0 -5.0 -10.0 -15.0 -20.0 10.0 100.0 1000.0 10000.0 100000.0 Electronic Noise Mic Noise Total Noise FIGURE A-17 Noise: LxT1, 377B02, PRMLxT1; Low Range LxT Manual Technical Specifications...
- Page 229 LxT1 Normal Range, PRMLxT1 and 377B02 Noise 40.0 30.0 20.0 10.0 -10.0 -20.0 10.0 100.0 1000.0 10000.0 100000.0 Electronic Noise Mic Noise Total Noise FIGURE A-18 Noise: LxT1, 377B02, PRMLxT1; Normal Range A-32 Technical Specifications LxT Manual...
- Page 230 17-Nov-05 377B02, PRMLxT1 and LxT1 Noise LxT1 & PRMLxT1 377B02 LxT1, PRMLxT1 and 377B02 Frequency Noise Noise Noise dB SPL dB SPL dB SPL 18.6 -21.2 18.6 18.0 -20.2 18.0 10.0 17.5 -19.2 17.5 12.6 17.0 -18.2 17.0 15.8 16.9 -17.2 16.9 20.0...
- Page 231 LxT1, PRMLxT1L with 377B02 LxT1 Low Range, PRMLxT1L and 377B02 Noise 15.0 10.0 -5.0 -10.0 -15.0 -20.0 10.0 100.0 1000.0 10000.0 100000 Electronic Noise Mic Noise Total Noise FIGURE A-19 Noise: LxT1, 377B02, PRMLxT1L; Low Range A-34 Technical Specifications LxT Manual...
- Page 232 LxT1 Normal Range, PRMLxT1L and 377B02 Noise 20.0 15.0 10.0 -5.0 -10.0 -15.0 -20.0 10.0 100.0 1000.0 10000.0 100000.0 Electronic Noise Mic Noise Total Noise FIGURE A-20 Noise: LxT1, 377B02, PRMLxT1L; Normal Range LxT Manual Technical Specifications...
- Page 233 17-Nov-05 377B02, PRMLxT1L and LxT1 Noise LxT1 & PRMLxT1L 377B02 LxT1, PRMLxT1L and 377B02 Frequency Noise Noise Noise dB SPL dB SPL dB SPL 10.3 -21.2 10.3 -20.2 10.0 -19.2 12.6 -18.2 15.8 -17.2 20.0 -16.2 25.1 -15.2 31.6 -14.2 39.8 -13.2 50.1...
- Page 234 LxT2, PRMLxT2B with 375B02 LxT2 Low Range, PRMLxT2B and 375B02 Noise 1000 10000 100000 Electronic Noise Mic Noise Total Noise FIGURE A-21 Noise: LxT2, 375B02, PRMLxT2B; Low Range LxT Manual Technical Specifications...
- Page 235 LxT2 Normal Range, PRMLxT2B and 375B02 Noise 1000 10000 100000 Electronic Noise Mic Noise Total Noise FIGURE A-22 Noise: LxT2, 375B02, PRMLxT2B; Normal Range A-38 Technical Specifications LxT Manual...
- Page 236 375B02, PRMLxT2B and LxT2 Noise Low Range LxT2, PRMLxT2B LxT2 & PRMLxT2B 375B02 and 375B02 Frequency Noise Noise Noise dB SPL dB SPL dB SPL 18.1 -18.3 18.1 16.7 -17.3 16.7 10.0 15.0 -16.3 15.0 12.6 13.8 -15.3 13.8 15.8 12.6 -14.3 12.6...
- Page 237 LxT2, PRMLxT2L with 375B02 LxT2 Low Range, PRMLxT2L and 375B02 Noise 1000 10000 100000 Electronic Noise Mic Noise Total Noise FIGURE A-23 Noise LxT2, 375B02, PRMLxT2L; Low Range A-40 Technical Specifications LxT Manual...
- Page 238 LxT2 Normal Range, PRMLxT2 and 375A02 Noise 40.0 35.0 30.0 25.0 20.0 15.0 10.0 -5.0 -10.0 10.0 100.0 1000.0 10000.0 100000.0 Electronic Noise Mic Noise Total Noise FIGURE A-24 Noise: LxT2, 375B02, PRMLxT2L; Normal Range LxT Manual Technical Specifications...
- Page 239 375B02, PRMLxT2L and LxT2 Noise Low Range LxT2 & PRMLxT2L 375B02 LxT2, PRMLxT2L and 375B02 Frequency Noise Noise Noise dB SPL dB SPL dB SPL 10.1 -18.3 10.1 -17.3 10.0 -16.3 12.6 -15.3 15.8 -14.3 20.0 -13.3 25.1 -12.3 31.6 -11.3 39.8 -10.3...
-
Page 240: Microphone Preamplifier Specifications
LxT. Model PRMLxT1 The Larson Davis PRMLxT1 is a prepolarized microphone preamplifier for use with a Larson Davis LxT Sound Level Meter. It requires very little supply current and will drive 200 feet of cable. The preamplifier operates over wide temperature and humidity ranges. - Page 241 Attenuation 22.8 dB (typical) Input Impedance 10 G Ohm // 5.3 pF Output Impedance 50 Ohm Maximum Output 2.8 Vpp 143 dB peak for microphones with 50 mV/Pa sensitivity Maximum Output Current 10 mA peak Distortion Harmonics <-58 dBC with 0.7 Volt rms output at 1 kHz Output Slew Rate 2 V/µS (typical) Electronic Noise...
- Page 242 Table A-25 Output Connector Compatibility Use with Larson Davis 377B02 or any ½" prepolarized microphone having about 50 mV/Pa sensitivity and meeting the mechanical requirements of IEC 61094-4. It can also be used with a ¼" prepolarized microphone using a Larson Davis ADP043 adapter.
- Page 243 Preamplifier Model: PRMLxT1 Serial Number: 0163 Certificate of Electrical Conformance Frequency response of this model PRMLxT1 preamplifier was tested at a level of 13.858 Vrms with 18pF microphone capacitance and driving a short cable. Output level at 1kHz is 0.9442 Vrms (-0.499 dBV), uncertainty 0.045 dB. Output is 3.511 V DC, uncertainty 0.001.
- Page 244 Model PRMLxT1L The Larson Davis PRMLxT1L is a prepolarized microphone preamplifier for use with Larson Davis LxT Sound Level Meters. It requires very little supply current and will drive 200 feet of cable. The preamplifier operates over wide temperature and humidity ranges. It is for use with 50 mV/Pa sensitivity microphones up to 118 dBSPL.
- Page 245 Electronic Noise with 18pF equivalent microphone 1.8 µV typical A-weighted (2.5 µV max) 3.2 µV typical Flat 20 Hz to 20 kHz (5 µV max) Power Supply Voltage 6 to 15 Volts DC Output Level ~1/2 power supply voltage Power Supply Current 1.3 mA typical Temperature Sensitivity <±0.1 dB from -10°...
- Page 246 Use with Larson Davis 377B02 or any ½" prepolarized microphone having about 50 mV/Pa sensitivity and meeting the mechanical requirements of IEC 61094-4. It can be used with either the Larson Davis ADP043 or ADP008 adapters for ¼" or 1" prepolarized microphones. Due to continual product improvement, specifications are subject to change without notice.
- Page 247 Preamplifier Model: PRMLxT1L Serial Number: 0102 Certificate of Electrical Conformance Frequency response of this model PRMLxT1L preamplifier was tested at a level of 1.157 Vrms with 18pF microphone capacitance and driving a short cable. Output level at 1kHz is 1.0167 Vrms (0.144 dBV), uncertainty 0.035 dB. Output is 3.664 V DC, uncertainty 0.001.
- Page 248 Model PRMLxT2B The Larson Davis PRMLxT2B is a prepolarized microphone preamplifier for use with Larson Davis LxT Sound Level Meters. It requires very little supply current and will drive 200 feet of cable. The preamplifier operates over wide temperature and humidity ranges. It has a built in attenuation of 19 dB for use with 35.5 mV/Pa sensitivity microphones up to 140 dBSPL.
- Page 249 Output Slew Rate 2 V/µS (typical) Electronic Noise with 18pF equivalent microphone 1.0 µV typical A-weighted (1.4 µV max) 1.5 µV typical Flat 20 Hz to 20 kHz (2.4 µV max) Power Supply Voltage 6 to 15 Volts DC Output Level ~1/2 power supply voltage Power Supply Current 1.3 mA typical...
- Page 250 Use with PCB 375B02 or any ½" prepolarized microphone having about 35.5 mV/Pa sensitivity and meeting the mechanical requirements of IEC 61094-4. It can be used with either the Larson Davis ADP043 or ADP008 adapters for ¼" or 1" prepolarized microphones.
- Page 251 Uncertainties are given as expanded uncertainty at ~95% confidence level (k=2). Control File: R:\Provo\Engineering\Tools\Preamps\PRMLxT2B.xml Technician: James Higley Test Date: 11 Jul 2011 16:43:47 Test performed at: Larson Davis, a division of PCB Piezotronics, Inc. 1681 West 820 North, Provo, Utah 84601 Tel: 716 684-0001 www.LarsonDavis.com Page 1 of 1 FIGURE A-27 Certificate of Conformance;...
- Page 252 Model PRMLxT2L The Larson Davis PRMLxT2L is a prepolarized microphone preamplifier. It requires very little supply current and will drive 100 feet of cable. The preamplifier operates over wide temperature and humidity ranges. It is for use with 20 mV/Pa sensitivity microphones up to 126 dBSPL.
- Page 253 Electronic Noise with 18pF equivalent microphone 1.8 µV typical A-weighted (2.5 µV max) 3.2 µV typical Flat 20 Hz to 20 kHz (5 µV max) Power Supply Voltage 6 to 15 Volts DC Output Level ~1/2 power supply voltage Power Supply Current 1.3 mA typical Temperature Sensitivity <±0.1 dB from -10°...
- Page 254 Use with PCB 375B02 or any ½" prepolarized microphone having about 35.5 mV/Pa sensitivity and meeting the mechanical requirements of IEC 61094-4. It can be used with either the Larson Davis ADP043 or ADP008 adapters for ¼" or 1" prepolarized microphones.
- Page 255 Preamplifier Model: PRMLxT2L Serial Number: 0104 Certificate of Electrical Conformance Frequency response of this model PRMLxT2L preamplifier was tested at a level of 1.157 Vrms with 18pF microphone capacitance and driving a short cable. Output level at 1kHz is 1.0018 Vrms (0.016 dBV), uncertainty 0.035 dB. Output is 3.586 V DC, uncertainty 0.001.
-
Page 256: Vibration Sensitivity
Vibration Sensitivity In these tests, the LxT is mounted on an electrodynamic exciter and vibrated sinusoidally at an amplitude of 1.0 m/s at the following frequencies: 35.5, 63, 125, 250, 500, 630, 800 and 1, 000 Hz. The tests are performed with the meter oriented such that vibrations are produced in two different directions: parallel to the microphone diaphragm and perpendicular to the diaphragm. - Page 257 Frequency 52.6 51.4 60.5 50.4 61.0 54.4 1,000 62.2 60.0 Table A-29 Axis of Vibration Parallel to the Microphone Diaphragm Vibration Perpendicular to the Microphone Diaphragm REFERENCE MICROPHONE Vibration VIBRATION PERPENDICULAR TO MICROPHONE DIAPHRAM FIGURE A-30 Vibration Perpendicular to Microphone Diaphragm A-60 Technical Specifications LxT Manual...
- Page 258 Frequency 31.5 35.9 35.6 38.6 34.5 46.0 35.5 54.1 39.4 67.1 44.2 82.6 70.0 69.7 45.7 1,000 69.2 51.7 Table A-30 Axis of Vibration Perpendicular to the Microphone Diaphragm LxT Manual Technical Specifications...
- Page 259 A-62 Technical Specifications LxT Manual...
-
Page 260: Appendix B Testing To Iec61672-1
A P P E N D I X Testing to IEC61672-1 This appendix presents information for measuring the sound level meter functionality of the LxT according to IEC61672-1. Sections 5, 6, 7 and 9 (except 9.3) The following table references sections and tables in this manual where information called for in specific sections of IEC61672-1 can be found. - Page 261 Section LxT Manual Section Comments 5.1.15 Typical Z-Weight Frequency Response Electrical Insert Signals 5.1.16 Highest Sound Pressure Level for LxT1 and LxT2 5.1.17 The Model LxT is a single channel instrument 5.1.18 Performing Measurements 5.2.1 Calibrator 5.2.3 Calibrating the LxT1 and 377B02 micro- phone Calibrating the LxT2 and the 375B02 micro- phone...
- Page 262 Manual, Timed Stop, or Stop When Stable Modes 5.18.1 Cables 5.18.2 Radio Frequency Emission 5.19.2 The LxT is a single channel instrument 5.20.2 Battery Power Voltage Range 5.20.3 Power Supply 5.20.4 Powering the SoundTrack LxT LxT Manual Sections 5, 6, 7 and 9 (except 9.3)
- Page 263 Section LxT Manual Section Comments 5.20.5 The LxT is not intended to be powered by a public source of AC power 6.1.2 Typical Stabilization Time 6.2.2 Calibrating the LxT1 and 377B02 micro- phone Calibrating the LxT2 and the 375B02 micro- phone 6.5.2 General Specifications...
- Page 264 Section LxT Manual Section Comments Parameters Measured Frequency Response Sound Level Meter Specifications Sound Level Meter Specifications LxT Performance Specifications The LxT measures sound level using a single range LxT Specifications LxT Performance Specifications LxT Performance Specifications Sound Level Meter Specifications Computer software is not an integral part of the LxT None.
- Page 265 Section LxT Manual Section Comments General Specifications Positioning the LxT The LxT measures sound level using a single range Data Storage After Improper Shutdown Performing Measurements Integration Method on SLM Tab Control Tab Time Manual, Timed Stop, or Stop When Stable Modes Hardkeys Overload Indication...
- Page 266 Section LxT Manual Section Comments No components of the LxT are intended to be operated only in an environmentally controlled enclosure LxT Specifications Microphone Reference Point The following two sections are related to the LxT1 and the LxT2 configurations, respectively. In each, information is provided which corresponds to the specific item number in this standard.
-
Page 267: Lxt1
LxT1 Section 9.2.4 a) Calibrator The calibrator to be used with the LxT1 is the Larson Davis Model CAL200. b) Calibration Frequency The calibration check frequency is 1000 Hz. c) Calibration Procedure For calibration refer to the chapter "Calibration" on page 7-1. - Page 268 d) Frequency Response and Corrections Lars on Davis LxT 1 with P R MLxT 1 and typical 377A02 Microphone average frequency res pons es and corrections R equired by IE C 61672-1 S ections 5.2.4, 5.2.5, 5.2.6 and 9.2.4 (d) 0°...
- Page 269 3548.13 -0.1 -0.1 3758.37 3981.07 4216.97 -0.1 4466.84 4731.51 -0.3 -0.4 5011.87 -0.1 -0.1 -0.5 5308.84 5623.41 -0.1 5956.62 -0.3 6309.57 -0.4 6683.44 7079.46 -0.1 7498.94 -0.1 -0.4 7943.28 -0.3 -0.7 8413.95 -0.4 -0.5 8912.51 -0.1 -0.5 -0.4 9440.61 -0.3 -0.6 10000.00 -0.2...
- Page 270 Periodic Testing Table 2 lists values of Larson Davis LxT1 with PRMLxT1 and 377B02 Microphone adjustment data of A-weighted levels used for periodic measurements. Table 2 - Larson Davis LxT1 with PRMLxT1 and 377B02 Microphone adjustment data of A-weighted levels used for periodic testing 0°...
- Page 271 The electrical design of the input device to insert electrical signals into the preamplifier for the 377B02 microphone is a series 12pF ± 5% capacitor. The Larson Davis ADP076 is used for this purpose. The ADP076 can be used for noise floor measurements by attaching the included short on the front of the ADP076.
-
Page 272: Lxt2
For a humidity change of 30% (non-condensing) then 30 minutes are required. m) Field Strength > 10 V/m The Larson Davis model LxT1 was not measured for field strengths greater than 10 V/m. n) Radio Frequency Emission The mode of operation of the LxT1 that produces the greatest radio frequency emission levels was with the LxT1 set to run and with an LxT-EXC010 (10' microphone extension cable) used to connect the PRMLxT1 to the LxT1. - Page 273 Frequency Response Larson Davis LxT2 with PRMLxT2B Preamp and typical 375B02 Microphone average frequency responses and corrections Required by IEC 61672-1 Sections 5.2.4, 5.2.5, 5.2.6 and 9.2.4 (d) 0° Free Field expanded Wind Screen Corrections with uncertainty 0° Free Field 0°...
- Page 274 The microphone reference point is the center of the diaphragm of the 7052 microphone. d) Periodic Testing See table 2 for values of Larson Davis LxT2 with PRMLxT2 and 7052 Microphone adjustment data of A-weighted levels used for periodic measurements.
- Page 275 The electrical design of the input device to insert electrical signals into the preamplifier for the 375A02 microphone is a series 18pF ± 5% capacitor. The Larson Davis ADP005 is used for this purpose. The ADP005 can be used for noise floor measurements by attaching the included short on the front of the ADP005.
- Page 276 ADP005 in place i) Highest Sound Pressure Level The highest sound pressure level the Larson Davis LxT2 is designed to accommodate at the level of overload is 139 dB. The peak-to-peak voltage at this level is 10.7 Vpp input through the ADP005.
- Page 277 For a humidity change of 30% (non-condensing) then 30 minutes are required. m) Field Strength > 10 V/m The Larson Davis model LxT2 was not measured for field strengths greater than 10 V/m. n) Radio Frequency Emission The mode of operation of the LxT2 that produced the greatest measurement radio frequency emission levels was with the LxT2 set to run and with an LxT-EXC010 (10' microphone extension cable) used to connect the PRMLxT2 to the LxT2.
-
Page 278: Appendix C Glossary And Formulas
This appendix contains technical definitions of key acoustical and vibration terms and formulas commonly used with Larson Davis instruments. Refer to American National Standards Institute document S1.1-1994 for additional definitions. Specific use of the terms defined are in the main body of the text. - Page 279 Average Sound Level (L The logarithmic average of the sound during a Measurement Duration (specific time period), using the chosen Exchange Rate Factor. Exposure to sounds at this level over the measurement duration result in the same noise dose as the actual (unsteady) sound.
- Page 280 Criterion Duration (T The time required for a constant sound level equal to the Criterion Level to produce a Noise Dose of 100%. Criterion Duration is typically 8 hours. Example: If the Criterion Level = 90 dB and the Criterion Duration is 8 hours, then a sound level of 90 dB for 8 hours, will produce a 100% Noise Dose.
- Page 281 0700 1900 2200 2400 10 10 10 ----- - 10log 0000 0700 1900 2200 The continuous equivalent sound level is generally calculated on an hourly basis and is shown in the equation as L.
- Page 282 To account for the increased impact of environmental noise during the evening and night, penalties are added to the measured level; 5 dB for evening and 10 dB for night, as can be seen in the equation. The Directive 2002/49/EC of the European Parliament and of the Council of 25 June 2002, relating to the assessment of environmental noise permits member states to shorten the evening period by one or two hours and lengthen the day...
- Page 283 Decibel is the name; dB is the sym- It is not possible to directly add or subtract physical bol. quantities when expressed in decibel form since the addition of logarithmic values correspond to multiplication of the original quantity. The word level is normally attached to a physical quantity when expressed in decibels;...
- Page 284 Table 1 shows the actual value of a specific item, such as sound power, for which the sound level is calculated. First, the sound power value is divided with the reference used and then the ten-based logarithm is applied. This value is then multiplied by 10 to create the decibel value.
- Page 285 Dose See Noise Dose. Dose and Projected Dose Dose is a measure of Sound Exposure and is defined in Calculations ANSI S1.25 Section 4.7 as: – -------------- -------- - ...
- Page 286 The factor of 100 in the equation produces a result that is a percentage. Dose is obtained from the accumulations made for TWA and SEL using the formula: where, is the current SPL at sample s; for measurements that include a threshold L (s) is set to × if L (s) is less than the Threshold Level L t k is the exchange rate constant.
- Page 287 Projected Dose in the analyzer is obtained with an equation similar to that of Dose except that the actual duration (time) of the measurement is used rather than a Criterion Time, as shown: L s ...
- Page 288 NOTE: This definition applies only for a Criterion Duration of 8 hours. Standard: ANSI S12.19 Equivalent Continuous The Larson Davis SoundTrack LxT calculates equivalent continuous sound levels based on equations from IEC Sound Level standard 61672-1, Section 3.9 which defines L eq as follows:...
- Page 289 () is the A-weighted sound pressure is the reference sound pressure of 20 µPa In the equation, the numerator of the argument of the logarithm is the root-mean-square, frequency-weighted sound pressure level over the averaging time interval T. The format used by the LxT to dis- When a frequency weighting other than A is used, the play equivalent continuous sound frequency weighting used shall be included explicitly in the...
- Page 290 the far field for all frequencies measured, the lowest frequency should be chosen for determining the distance. For example, if the lowest frequency is 20 Hz, the wavelength at normal temperatures is near 56 ft. (17 m); at 1000 Hz, the wavelength is near 1.1 ft. (1/3 m). See the definition of Acoustic Near Field for the advantages of the acoustic far field.
- Page 291 High Pass: A frequency filter that permits signals to pass through that have frequencies above a certain fixed frequency, called a cutoff frequency. It is used to remove lower frequencies. Bandpass: A frequency filter that permits signals to pass through that have frequencies above a certain fixed frequency, called a lower cutoff frequency, and below a certain fixed frequency, called an upper cutoff frequency.
- Page 292 Flat-Weighting, or z-weighting: A filter that does not adjust the levels of a frequency spectrum. It is usually an alternative selection for the frequency-weighting selection. Center Frequencies, Hz Weighting Network Frequency Response 1/3 Octave 1 Octave -50.4 -24.2 -6.2 -44.7 -20.4 -4.4 31.5...
- Page 293 Microphone Guidelines Microphone Types: A device for detecting the presence of sound. Most often it converts the changing pressure associated with sound into an electrical voltage. It can be composed of one of the following types: Capacitor (Condenser): A microphone that uses the motion of a thin diaphragm caused by the sound to change the capacitance of an electrical circuit and thereby to create a signal.
- Page 294 Guidelines: 1. Do not permit any solid or liquid to touch the microphone diaphragm. Keep a protective grid over the diaphragm. 2. Do not blow on a microphone and use a wind screen over the microphone to reduce the effect of wind noise. 3.
- Page 295 A microphone measures sound from any direction: Most measurements are intended to measure the sound level of a specific source, but most microphones are not directional so they measure whatever is there, regardless of source. When making hand-held measurements, keep your body at right angles to the direction of the sound you are interested in and hold the meter as far from your body as possible.
- Page 296 Noise Typically is unwanted sound. This word adds the response of humans to the physical phenomenon of sound. The descriptor should be used only when negative effects on people are known to occur. Ambient: The all encompassing sound at a given location caused by all sources of sound.
- Page 297 is the threshold sound level. is the criterion sound level. Q is the exchange rate in dB, and q = the parameter that determines the exchange rate, where: q = 10 for a 3dB exchange rate. q = 13.29 = 4/log(2) for a 4dB exchange rate. q = 16.61 = 5/log(2) for a 5dB exchange rate.
- Page 298 is the criterion sound duration as set by the LxT’s “Criterion Time Hours” setting which by default is set to 8 hours L is the criterion sound level as set by the LxT’s “Overall Criterion” or “Current Criterion” settings. Addition of the term “log(100)” was used to implement the 100 multiplier of the ANSI equation that creates the percentage.
- Page 299 Noise Exposure (See Sound Exposure) OSHA Level (L The Average Sound Level calculated in accordance with the OSHA Occupational Safety and Health Administration Exchange Rate and Threshold Level. Preamplifier A part of the sound level meter that matches a particular model of microphone to the meter.
- Page 300 Sound Exposure (SE) The total sound energy of the actual sound during a specific time period. It is expressed in Pascal-squared seconds. t t d where p is the instantaneous sound pressure and T the Measurement Duration (specific time period). The LxT displays Sound Exposure as When applied to hearing damage potential, the equation is , where X is the frequency weight-...
- Page 301 SEL Calculations The LxT displays SEL as L , where SEL is available for the overall measurement and is X is the frequency weighting (X = A, calculated using this formula: C or Z). t t d ------------------------ - 10Log Alternatively, SEL can also be calculated with this formula:...
- Page 302 Sound Exposure Level Sound Exposure in hours Sound Exposure in seconds FIGURE C-3 Sound Exposure Level and Sound Exposure Sound Exposure Level (SEL, The total sound energy in a specific time period. The sound pressure is squared and integrated over a specific period of time (T ) this is called the sound exposure and has the units Pascal squared- seconds or Pascal squared-...
- Page 303 (20 Pa xs = 400 x 10 = 1 s T = t , the time interval for measurement, in seconds, for sound exposure level and time-average sound level The SEA parameter is used mainly in the Canadian provence of Quebec.
- Page 304 SEA = 10 log n = 0 Sound Pressure The physical characteristic of sound that can be detected by microphones. Not all pressure signals detected by a microphone are sound (e.g., wind noise). It is the amplitude of the oscillating sound pressure and is measured in Pascals (Pa).
- Page 305 It is used for hearing damage risk assessment. Standard: ANSI S1.25 Time-Weighted Averages The Larson Davis LxT calculates many time-integrated levels or time-weighted averages (TWA) based on different parameters and time intervals. They are all designed and programmed to perform the equation specified in IEC...
- Page 306 The numerical value for the TWA and ProjTWA Time-weighted average (TWA) based on 8 hours The Projected Time Weighted Average for 8 hours The currently selected Frequency Weighting (A) and Detector Response (Slow) The currently selected Exchange Rate Threshold Level Elapsed measurement time shown as h:mm:ss.s FIGURE C-4 TWA The LxT displays the time weighted...
- Page 307 16.61 for an exchange rate of 5dB (L OSHA 20.00 for an exchange rate of 6dB (L n is the total number of samples taken in the measurement. The sample rate is 32 samples per second. Time Weighting The response speed of the detector in a sound level meter. There are several speeds used.
Need help?
Do you have a question about the SoundTrack LxT and is the answer not in the manual?
Questions and answers