
Related Manuals for TSI Instruments Q-TRAK Plus 8552


Summary of Contents for TSI Instruments Q-TRAK Plus 8552
- Page 1 I n d o o r A i r Q u a l i t y Model 8552/8554 Plus IAQ Monitor Data Analysis Software enclosed Operation and Service Manual 1980417, Revision H February 2005...
- Page 3 Model 8552/8554 Plus IAQ Monitor Operation and Service Manual February 2005 P/N 1980417, Rev H SHIP/MAIL TO: E-mail address: TSI Incorporated answers@tsi.com 500 Cardigan Road Website: Shoreview, MN 55126-3996 http://www.tsi.com INTERNATIONAL U.S. Customer Service: (001 651) 490-3838 Customer Service: (800) 861-7919/(651) 490-3838 Fax: Fax: (001 651) 490-3824...
- Page 4 Copyright © TSI Incorporated / 2000–2005 / All rights reserved. Address TSI Incorporated / 500 Cardigan Road / Shoreview, MN 55126 / USA Fax No. (651) 490-3824 Limitation of Warranty and Liability (effective July 2000) Seller warrants the goods sold hereunder, under normal use and service as described in the operator's manual, shall be free from defects in workmanship and material for twenty-four (24) months, or the length of time specified in the operator's manual, from the date of shipment to the customer.
-
Page 5: Table Of Contents
CONTENTS 1. UNPACKING AND PARTS IDENTIFICATION ........1 Unpacking the Q-T Plus IAQ Monitor..........1 Optional Accessories ................3 2. SETTING UP...................5 Supplying Power to the Q-T Plus IAQ Monitor......5 Installing the Batteries................5 Using the AC Adapter ................5 Instrument Software and Communications Setup........5 Setting up T Data Analysis Software ........6 Connecting the Q-T... - Page 6 Ventilation Rates................28 % Outside Air ................29 Statistics ..................... 31 Single Point Statistics ..............31 Logged Test Statistics..............31 4. CALIBRATION AND MAINTENANCE ..........33 Calibrating the CO Sensor..............33 Calibrating the CO Sensor ..............37 Calibrating the Temperature or Relative Humidity Measurement..41 Restore Factory Calibration ..............
-
Page 7: Unpacking And Parts Identification
Chapter 1 Unpacking and Parts Identification Unpacking the Q-T Plus IAQ Monitor Carefully unpack the Q-T Plus IAQ Monitor from the shipping container. Use the tables and illustrations below to make certain that there are no missing components. Contact TSI immediately if anything is missing or damaged. - Page 8 Figure 1-2: Calibration Certificate, Operation and Service Manual, T Data Analysis Software Qty. Item Description Part/Model Calibration Certificate Operation and Service Manual 1980417 Data Analysis Software Chapter 1...
-
Page 9: Optional Accessories
Optional Accessories The following pages contain component identification information for optional accessories available for the Q-T Plus IAQ Monitor. Figure 1-3: Auxiliary Sensor, Probe Stand, Instrument Stand Item Description Part/Model Probe Stand 800679 Instrument Stand 1206526 Auxiliary Temperature Sensor 8590 Air Velocity Probe 8592 Unpacking and Parts Identification... - Page 10 Figure 1-4: Model 8928 Portable Printer Kit Item Description Part/Model RJ45 to 9-pin Printer Cable 8926 Model 8928: portable printer 8928 AC adapter/charger for printer 2613049 User Guide 8928 Thermal paper (roll) 802011 Chapter 1...
-
Page 11: Setting Up
Chapter 2 Setting Up Supplying Power to the Q-T Plus IAQ Monitor The Model 8552/8554 Q-T Plus IAQ Monitor may be powered with four AA alkaline batteries or the optional AC adapter. Installing the Batteries Insert four AA-size batteries, as indicated by the diagram located on the inside of the battery compartment. -
Page 12: Setting Up Trak Pro Tm Data Analysis Software
Setting up T Data Analysis Software Follow the instructions on the label of the T software to install the software on your computer. T software contains a very comprehensive Help Function. This utility provides all the necessary information to guide you in all aspects of software operation. The software is shipped on a CD-ROM. -
Page 13: Using The Optional Instrument Stand
Figure 2-1: Instrument Setup, Communications Dialog Box 4. Select the correct serial port (such as, COM2); then select Test. The software will verify that you have set up the communications port correctly and that it is communicating with the Q-T Plus monitor. -
Page 14: Connecting The Optional Model 8928 Portable Printer
Figure 2-2: Optional Probe and Instrument Stands Connecting the Optional Model 8928 Portable Printer To connect the Model 8928 printer to the Q-T Plus monitor, do the following: 1. Ensure that the Q-T Plus monitor and printer are off. 2. Locate the printer interface cable and connect the 9-pin end labeled PRINTER to the printer and the other end to the communications port on the Q-T Plus monitor. -
Page 15: Operation
Chapter 3 Operation Overview The Model 8552/8554 Q-T Plus IAQ Monitor measures CO temperature, relative humidity, calculates dew point, wet bulb, and % outside air, and measures one (1) additional parameter. The Model 8554 will also measure CO. The instruments have three main modes of operation: Survey, Sample, and Data Log. -
Page 16: Survey Mode
Escape key Enter key Arrow keys Power on/off key Figure 3-1: Q-T Plus IAQ Monitor Keypad and Display Survey Mode After the instrument has completed its power-up sequence, the Q-T Plus monitor will automatically go into the Survey mode. Note: It is not unusual for gas sensors to take some time to become stable. -
Page 17: Units
SAMPLE °F 75.1 TEMP 35.1 °F 70.1 TEMP 2 Figure 3-2: Survey Mode Screen (sample) Description Primary Parameter (CO concentration is shown). Sample mode. Used for capturing single data points. Remaining parameters. Status message area. Battery status. Units To change units displayed in the Survey mode use the key to select the parameter. -
Page 18: Recording And Saving A Single Data Point
Recording and Saving a Single Data Point With SAMPLE selected and the key pressed, the Q-T Plus monitor begins a countdown. During these 10 seconds, it is taking an average reading of each parameter. At the end of the averaging period, the following sample screen is displayed: SAMPLE # 1 °F... -
Page 19: Time Constant
Time Constant Highlighting and selecting TIME CONSTANT displays the Time Constant Menu. This allows you to adjust the dampening time-constant that will affect the real-time display of parameters, in the Survey mode only. The values shown in the Survey Mode are updated once per second;... -
Page 20: Log Mode 1: Log Interval
While logging, you are able to view statistical summary data of the current test. Pressing the key will display the statistics for each parameter. The CO summary screen is shown in Figure 3-6. TEST 1 MIN: 800 PPM CO2 06:51 02/04/05 MAX: 950 PPM CO2... - Page 21 The default values for log intervals are set at 1 second, 1 minute, 5 minutes, 15 minutes and 30 minutes. To select the logging interval, press either the key until the desired interval is shown. When the ↵ key is pressed, the program begins the data logging process.
-
Page 22: Log Mode 2 And 3
Note: This log interval only applies to Log 1 mode. The log interval for Log 2 and Log 3 modes is adjustable only within T software. Log Mode 2 and 3 The Q-T Plus monitor may be programmed for more sophisticated data logging modes, using the T software and Log Modes 2 and 3. - Page 23 The following table summarizes the information displayed in the Plus Logging Protocols dialog box. Item Description Serial Number Displays the serial number of the Q-T Plus IAQ Monitor. Number Tests Displays the number of tests currently logged and stored Logged in the instrument.
- Page 24 To program the Q-T Plus monitor for Log Mode 2 or 3, enter the following: Item Description Start Date Enter the date and time to begin the sample: • Start Time If the start date field is left blank, the date defaults to the current date.
-
Page 25: Sample Protocol For Log Mode 2 Or 3
Sample Protocol for Log Mode 2 or 3 The following steps describe how to program a sample protocol for Log Mode 2 or 3. Log Mode 2 sample protocol features: • The sample protocol for Log Mode 2 is set to take unattended readings for one day. - Page 26 02/04/2005 02/04/2005 Figure 3-10: Q-T Plus IAQ Monitor Logging Example To program this logging example, do the following: 1. Make sure the Q-T Plus monitor is connected to the computer and turned on. 2. Select Logging Setup from the Instrument Setup menu. software retrieves the current settings for Log Modes 2 and 3 from the Q-T Plus monitor and displays...
- Page 27 5. Note in the example that the LOG 2 test requires 4% of the available memory and LOG 3 requires 4% of the memory. A total of 100% of the memory is available for use. 6. Disconnect the Q-T Plus monitor from the computer. Refer to other sections of this Operation and Service Manual for details on making measurements using LOG 2 and LOG 3 modes.
-
Page 28: Memory Considerations
Memory Considerations The Q-T Plus IAQ Monitor has a great deal of memory and will not normally run out. The instrument contains separate memory for the single points and for the logged tests (filling up the memory for one type of data will have no affect on the other type). The Q-T Plus monitor can store approximately 440 separate single points;... -
Page 29: Keypad Lockout Switch
Keypad Lockout Switch Recording data over extended time periods in Log Mode 1, 2, or 3 often requires leaving the Q-T Plus monitor unattended. To reduce the risk of having an unauthorized person either intentionally or inadvertently interrupt the measurements, you can lock the keypad. -
Page 30: Setup Menu
Setup Menu The setup menu allows access to a wide range of options for reviewing data, examining statistics, changing operational parameters, performing calibration and more. To reach the Setup menu from the Survey Mode press key. To access any of the submenus use the key to highlight the menu and press the ↵... - Page 31 When first entering this screen, the first character in the time field will have a cursor underneath it. Use the key to increment and/or decrement values. Use the key to move to the required field. When all adjustments are complete, press the ↵ key to accept the changes and return to the Setup menu.
-
Page 32: Backlight
Alternately, the date and time can be manually entered into the dialog box. 4. Select Send to reprogram the Q-T Plus monitor. Backlight The BACKLIGHT DELAY option on the Setup menu adjusts how long the display backlight stays on after any key is pressed. After the delay has elapsed, the backlight will automatically turn off. -
Page 33: Clear Memory
Figure 3-16: Instrument Parameters 3. Click a time duration in the backlight box. 4. Click Send to reprogram the Q-T Plus monitor. Clear Memory The CLEAR MEMORY option on the Setup menu allows you to clear the instrument memory. To preserve data integrity, the Plus monitor does not automatically erase the “older”... -
Page 34: Calibration
The highlighted default selection is Single Point Memory. Pressing ↵ erases all Single Point data. The Logged Test Memory is unaffected. Logged Test Memory is cleared in a similar manner. Single Point Memory or Logged Test Memory cannot be cleared through the T software. -
Page 35: Outside Air
-VENTILATION RATES- % OUTSIDE AIR Figure 3-19: Ventilation Rates Select Screen % Outside Air Percentage Outside Air may be calculated by using a temperature- or CO -based method. Percentage Outside Air is calculated from the ratio between the differences of the supply air, return air, and outside air by using the following formula: −... - Page 36 -% OUTSIDE AIR- CALCULATE % OUTSIDE AIR USING TEMPERATURE Figure 3-20: % Outside Air Screen The following examples assume that CO2 was selected as the measured parameter. The % OUTSIDE AIR info screen will display. TO CALCULATE % OUTSIDE AIR, MAKE THREE MEASURMENTS: OUTSIDE AIR SUPPLY AIR...
-
Page 37: Statistics
6. Use the key to select CALCULATE and press the ↵ key. The %OUTSIDE AIR value will display at the top of the screen. 7. For repeated calculations repeat steps 3 through 6. 8. To exit press the key. Note: None of the % Outside Air data is stored in memory. - Page 38 -LOGGED TEST STATS- TEST # 3 START 08:23 02/04/05 STOP 08:23 02/04/05 LOG INTERVAL 00:05 DURATION 0:12:30:35 NEXT: TEST VALUE Figure 3-24: Logged Test Statistics Summary Description Test number (not user adjustable). Start time and date. Stop time and date. Log interval used during sampling.
-
Page 39: Calibration And Maintenance
Chapter 4 Calibration and Maintenance The Model 8552/8554 Q-T Plus IAQ Monitor requires very little maintenance to keep it performing well. The Q-T Plus monitor may be calibrated in the field using the instructions below. Even so, we recommend that you return your Q-T Plus monitor to TSI for calibration annually. - Page 40 -SELECT CAL ITEM- TEMPERATURE HUMIDITY RESTORE DEFAULTS Figure 4-1: Calibration Submenu Screen Locate the calibration collar and slide it over the main probe (see Figure 4-4). -C02 ZERO CAL: STEP 1- SLIDE CO2 CAL COLLAR OVER PROBE ATTACH ZERO GAS TO CAL COLLAR NEXT Figure 4–2: CO...
- Page 41 Figure 4–4: CO Calibration 5. The Q-T Plus monitor will indicate the status of the calibration process. After the instrument has averaged the zero gas, the display will highlight "ZERO CAL COMPLETE" (see Figure 4-5). -CO2 ZERO CAL: STEP 3- DETECTING ZERO GAS AVERAGING ZERO GAS ZERO CAL COMPLETE...
- Page 42 6. Once the zero calibration is complete, turn the gas off. Press the ↵ or key to continue to the span gas calibration step. 7. Detach the regulator from the zero gas cylinder and install the regulator onto the span calibration gas cylinder. Press the ↵ or key to continue (Figure 4-6).
- Page 43 The CO sensor in some models of TSI IAQ monitors may be adversely affected when exposed to isopropyl alcohol vapors released from TSI instruments utilizing condensation particle counting (CPC) technology. For maximum performance, keep CO sensors away from CPC-based instruments utilizing isopropyl alcohol.
- Page 44 pressure. Normal day-to-day variations due to local weather conditions have little effect. However, changes in altitude can cause more significant errors. For best accuracy, calibrate the Q-T Plus monitor's CO measurement for your local conditions or if conditions change. To calibrate the CO sensor, follow the procedure below. You can also follow the prompts displayed on the screen while in the user calibration mode.
- Page 45 Figure 4–11: CO Calibration 3. Turn the gas on (0.3 L/min). Make sure the cylinder is not empty. It should quietly “hiss” when it is on. Press the ↵ key to begin zero gas calibration (Figure 4-12). -CO ZERO CAL: STEP 3- DETECTING ZERO GAS AVERAGING ZERO GAS ZERO CAL COMPLETE...
- Page 46 5. Turn gas off. Detach the regulator from the zero CO calibration gas cylinder. Press the ↵ key to continue to the span gas calibration step. 6. Install the regulator onto the span calibration gas cylinder. Press the ↵ key to continue. 7.
-
Page 47: Calibrating The Temperature Or Relative Humidity Measurement
Calibrating the Temperature or Relative Humidity Measurement To perform a temperature or humidity calibration on the Q-T Plus monitor you will need a reference temperature or humidity device, one that is more accurate than the Q-T Plus monitor. To obtain the best accuracy, care must be taken so that both the Q-T Plus probe and the reference device are able to sense the same air. -
Page 48: Restore Factory Calibration
-TEMP CAL: STEP 2- SET TO CORRECT TEMPERATURE °F TEMP 75.1 ↵ TO ACCEPT AND CONTINUE Figure 4–16: Temperature Calibration Screen -HUMIDITY CAL: STEP 2- SET TO CORRECT HUMIDITY VALUE 35.1 % RH ↵ TO ACCEPT AND CONTINUE Figure 4–17: Humidity Calibration Screen Note: If the two readings are the same, there is no need to proceed with the calibration. -
Page 49: Storage Precautions
2. The following warning message appears on the display. Press the to continue or the ↵ key to abort (Figure 4-18). -RESTORE FACTORY CAL- IN SOME CASES, IT MAY BE NECESSARY TO RESTORE FACTORY CAL VALUES DO NOT RESTORE UNLESS REQUIRED! NEXT QUIT: Figure 4–18: Restore Defaults Screen... -
Page 51: Auxiliary Sensors
Chapter 5 Auxiliary Sensors Auxiliary sensors are available for the Q-T Plus that enhance the functionality of the instrument. If you purchased an auxiliary sensor to measure another parameter, you may attach the sensor at any time during the Survey mode and the Q-T Plus monitor will display the values instantly. -
Page 52: Model 8592 Air Velocity Probe (Avp) Accessory
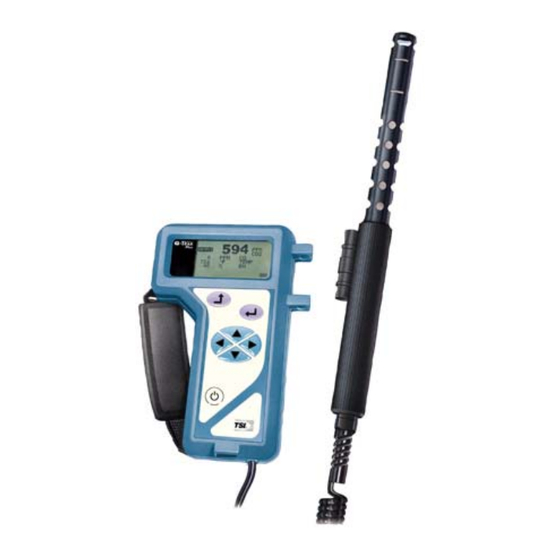
second temperature measurement. All data acquired with this accessory can be evaluated using T Data Analysis Software. Model 8592 Air Velocity Probe (AVP) Accessory The Model 8592 Air Velocity Probe (AVP) accessory allows you to make and record air velocity and flow rate measurements. The AVP can readily be used to conduct velocity sampling and to calculate air flow rate using average velocity and your input duct dimensions. -
Page 53: Rak Tm
• Clean room studies • Draft measurements • Wind tunnel testing • Filter velocity checks Upgrading Your Q-T Plus IAQ Monitor and T Data Analysis Software Past users of Q-T Plus IAQ Monitor instruments will have to upgrade their instrument to be compatible with the Model 8592 Air Velocity Probe accessory. - Page 54 After inserting the product CD into your computer’s CD disk drive, the CD will automatically run and its main menu will be displayed. From the CD’s main menu, click once on the “Upgrade Q-T Plus Firmware” menu option. The Q-T Plus Flash Memory Programmer will be started and its menu will be displayed as shown in Figure 5-3.
-
Page 55: Using The Telescoping Probe
Figure 5-4: Q-T Plus Flash Memory Programmer Menu—Upon Completion Using the Telescoping Probe To extend the probe, grasp the handle in one hand while gently pulling on the probe tip with your other hand. Be aware that the AVP cable slides through the telescoping probe as it is extended or retracted. -
Page 56: Measuring Air Flow Rate Or Average Velocity
with the (up/down arrow) key and then change the units displayed using the (left/right arrow) key. Table 5-1: Velocity Measurement Units Velocity Actual Standard Velocity Measurement Units Velocity Units Units Feet per minute sfpm Meters per second sm/s Measurements are made by holding the probe so the sensor window is positioned in the desired measurement location with the sensor window perpendicular to the air flow stream. -
Page 57: Q-Trak Plus Lcd Display During Avp Operation
Plus LCD Display During AVP Operation The following figures show the screens/pages displayed on the Q-T Plus LCD during operation with the AVP connected to the instrument. -MENU- TIME CONSTANT LOG MODE 1 SETUP VENTILATION RATES STATISTICS Figure 5-5: Default Menu of the Q-T Plus (no accessory probe attached) -MENU-... -
Page 58: Measuring Average Velocity
-VELOCITY MENU- VELOCITY AVERAGING VOLUMETRIC FLOW RATE Figure 5-7: Velocity Menu Options Measuring Average Velocity VELOCITY AVERAGING may be selected by using the and pressing the ↵ key will display the VELOCITY AVERAGING menu. -VELOCITY AVERAGING- 4.25 M/S VEL SAMPLES TAKEN: 0 ↵... -
Page 59: Measuring Volumetric Flow Rate
Individual sample points can be reviewed by pressing the ↵ key to select VIEW SAMPLES. VELOCITY SAMPLE 2 4.21 M/S VEL Figure 5-10: Reviewing Individual Samples from the Velocity Sample Set Using the key allows you to view individual samples from the velocity sample set. - Page 60 -VELOCITY MENU- VELOCITY AVERAGING VOLUMETRIC FLOW RATE Figure 5-12: Velocity Menu Options Select VOLUMETRIC FLOW RATE using the key and press the ↵ key to display the VOLUMETRIC FLOW RATE menu shown in Figure 5-12. -VOLUMETRIC FLOW RATE- SELECT SHAPE RECTANGULAR ROUND Figure 5-13: Selecting the Duct Shape...
- Page 61 Repeat these steps to enter the height dimension. When both dimensions are set correctly, press the enter key [↵]. The minimum dimension that can be entered is 4 inches (10 cm) and the maximum is 100 inches (300 cm). Dimensions can be entered in increments of 0.1 inches or 0.1 cm.
- Page 62 be taken to comprise a sample set. The measured velocity and a calculated volumetric flow rate will be displayed for each sample taken. When you have completed acquiring all traverse sample points, use the and press the ↵ key to key to highlight SAMPLING COMPLETE complete the measurement.
-
Page 63: Maintenance
Maintenance Periodically inspect the AVP sensor window to ensure that it is clean. Dust and oil deposits on the sensor will affect measurement accuracy. The telescoping probe should also be kept clean. Dirt or oil accumulation will affect the ability to extend and retract the probe. Use a soft cloth dampened with water to remove accumulation of unwanted material. -
Page 65: Troubleshooting
Chapter 6 Troubleshooting The table below lists the symptoms, possible causes, and recommended solutions for the Model 8552/8554 Q-T Plus IAQ Monitor. Symptom Possible Cause Corrective Action No display Unit not switched on. Switch unit on. Low or dead batteries. Replace the batteries or plug in the AC adapter. - Page 66 Symptom Possible Cause Corrective Action "TEMP FLT" There is a fault in the Factory service is required to temperature sensor. correct this fault. "HUMID There is a fault in the Factory service is required to FLT" humidity sensor. correct this fault. Chapter 6...
-
Page 67: Specifications
Appendix A Specifications Specifications are subject to change without notice. Sensor type........Non-Dispersive Infrared (NDIR) Range ..........0 to 5000 ppm Accuracy .........±(3% of reading + 50 ppm) at 25°C (Add uncertainty of ±0.36% of reading per °C [±0.2% of reading per °F] for change in temperature.) Resolution ........1 ppm Temperature Sensor... - Page 68 Power Requirements Batteries .......... Four AA-size alkaline or rechargeable AC adapter ........6 VDC nominal, 300 mA [Q-T Plus monitor mates with 5.5 mm OD x 2.1 mm ID plug, center pin positive(+)] Approximate battery life ....Up through 20 hours (alkaline). Physical External dimensions......
- Page 69 Model 8592 Air Velocity Probe Velocity Range...........0 to 4000 fpm (0 to 20 m/s) Accuracy........5% of reading or ±5 fpm (±0.025 m/s), whichever is greater. Temperature Range Operating Range......5 to 45°C (41 to 113°F) Storage Range......–20 to 60°C (–4 to 140°F) Volumetric Flow Rate Range...........up to 275,000 cfm up to 467,000 m...
-
Page 71: Standard Velocity Vs. Actual Velocity Measurements
Thermal air velocity sensors are sensitive to changes in both air density and air velocity. Thermal anemometers, therefore, typically indicate velocities with reference to a set of standard conditions. For TSI instruments, standard conditions are defined as 70°F (21.1°C) and 14.7 psia (101.4 kPa). Other manufacturers may use a different set of standard conditions. - Page 73 TSI Incorporated 500 Cardigan Road, Shoreview, MN 55126 U.S.A. Web: www.tsi.com P/N 1980417 Rev. H Copyright © 2005 by TSI Incorporated Printed in U.S.A.
Need help?
Do you have a question about the Q-TRAK Plus 8552 and is the answer not in the manual?
Questions and answers