Table of Contents
Advertisement
Quick Links
Advertisement
Table of Contents

Subscribe to Our Youtube Channel
Related Manuals for ECD M.OL.E. EV12


Summary of Contents for ECD M.OL.E. EV12
- Page 1 Quick RefeRence Guide...
-
Page 2: Table Of Contents
cOnTenTS WeLcOMe........................2 eQuiPMenT feATuReS/funcTiOnS ..................3 STATuS AcTiViTY Led ....................4 HOMe ScReen ......................5 MAin Menu ......................6 SeTuP cHARGinG THe POWeR PAck ................7 SOfTWARe inSTALLATiOn ...................8 cOMMunicATiOnS .....................10 OPeRATiOn inTROducTiOn ....................12 STeP 1: SeTuP inSTRuMenT ................13 STeP 2: dATA cOLLecTiOn ..................18 STeP 3: VieW dATA ....................21 STeP 4: dOWnLOAd dATA ..................23... -
Page 3: Welcome
This Quick Reference Guide is designed to help the user to familiarize themselves with the equipment, perform basic hardware setup/communications and operation. For detailed information on both Hardware & Software components, please refer to the Help system accessible in the M.O.L.E.™ MAP Software. To access the help system start the software and use any of the methods listed: •... -
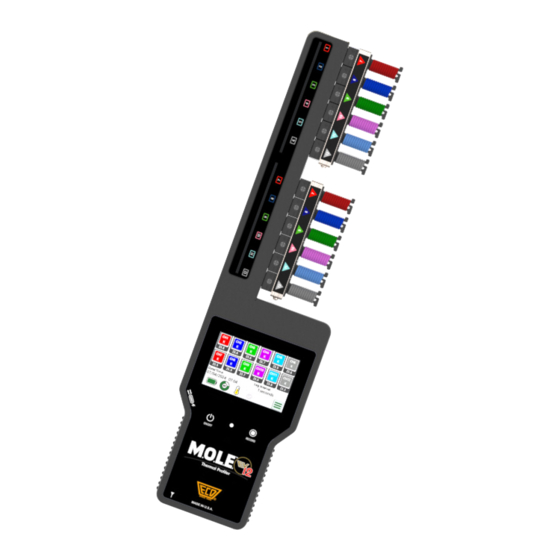
Page 4: Features/Functions
eQuiPMenT feATuReS/funcTiOnS Thermocouple/inputs This is where up to 12 display: thermocouple sensors are The touch screen interface connected. of the thermal profiler. data/charging Port: Led: Transfers data to/from a Indicates various statuses computer & charges the of the thermal profiler. internal battery. -
Page 5: Status Activity Led
LED Color Solid Flashing Indicates thermal profiler is recording data. (Log Interval: Indicates thermal profiler is Green 1 sec., flash each log, < 0.5 “ON” and idle sec., flash 4 times per sec., > 1 sec., flash every 2 seconds) Flashes 5 times to indicate when the internal battery voltage is low or internal... -
Page 6: Home Screen
eQuiPMenT HOMe ScReen ➊ channel status indicators: ➎ MOLe Temp: · Shows current sensor Temp. · Red if >70C · Grayed when disabled · Yellow if >40C, <=70C ➊ · “N/C” if T/C not connected/open · Green if <=40C · Touch opens Channel enable type selection screen ➏... -
Page 7: Main Menu
Record Configure Screen Select Profile Screen Select kPi Screen date/Time Screen units Screen Bluetooth® Screen Battery Screen M.O.L.e. History Screen factory Screen eQuiPMenT MAin Menu... -
Page 8: Setup
SeTuP cHARGinG THe POWeR PAck 1. Insert the USB computer interface cable into a computer USB port 2. Insert the USB-C end into the data/ charging port. A completely discharged battery takes about 4 hours to be fully ➊ charged. ➋... -
Page 9: Software Installation
1. Insert the flash drive in a USB port and the AutoPlay menu appears. 2. Select Open folder to view files button on the AutoPlay menu to launch Windows® Explorer. Closely follow the instructions for your operating system. For detailed ➋... - Page 10 SeTuP SOfTWARe inSTALLATiOn Locate the setup.exe on the installation drive. Double-click the file to proceed. 1. Select the Next command button to follow the installation wizard process.
-
Page 11: Communications
1. Plug the USB cable into a computer COM Port and the USB-C end into the M.O.L.E. thermal profiler data port. 2. Select Start M.O.L.E. MAP ➋ ➊ SeTuP cOMMunicATiOnS... - Page 12 SeTuP cOMMunicATiOnS 3. On the M.O.L.E. menu, click the Select Instrument command. ➌ 4. Select the desired instrument from the dialog box. If there are none displayed, click the Scan for Instruments command button to detect all available instruments. ➍ Once a M.O.L.E.
- Page 13 This operation procedure guides you through a typical process on how to set a M.O.L.E. thermal profiler up for performing a data run. For additional detail, consult the Help System in the software. The M.O.L.E. thermal profiler depends on the MAP (Machine-Assembly-Process) software to control how it collects and interprets data.
-
Page 14: Operation
OPeRATiOn SeTuP inSTRuMenT STeP 1: SeTuP inSTRuMenT ➍ Open the M.O.L.E. MAP software. Connect the M.O.L.E. thermal profiler to the computer. Make sure the M.O.L.E. battery is fully charged. When a M.O.L.E. thermal profiler is selected, the software status bar displays the current battery voltage. - Page 15 When navigating through the ➏ wizard, the step list on the left of the dialog box uses a color key to inform the user of the progression through the wizard. Current Completed Remaining On the M.O.L.E. menu, select Setup Instrument and the workflow wizard appears. Set the Instrument Name.
- Page 16 OPeRATiOn SeTuP inSTRuMenT For settings such as Start Parameters and Stop Parameters, select the More>> command button. Select the Sensor Platform button. Select the desired sensors then the OK command button to proceed. ➐ Confirm the settings and then, select the Next command button to send the data listed in the dialog box to the instrument.
- Page 17 Confirm the assembly information such as the test Product Description, size, sensor ➓ locations and a image. Click the Next command button. ⑪ OPeRATiOn SeTuP inSTRuMenT...
- Page 18 OPeRATiOn SeTuP inSTRuMenT Verify the instrument status. This dialog box displays the health of the M.O.L.E. thermal ⑫ profiler such as battery charge, internal temperature, thermocouple temperatures. If everything is OK, the dialog box displays a GReen sign. If there are any items that may prevent the user from collecting good data, they are highlighted and a...
-
Page 19: Step 2: Data Collection
STeP 2: dATA cOLLecTiOn Never permit the M.O.L.E. thermal profiler exceed absolute ➊ maximum warranteed internal temperature, as permanent damage may result. The warranty will not cover damage caused by exceeding maximum specified internal temperature. Attach the thermocouple sensors into the test product. - Page 20 OPeRATiOn dATA cOLLecTiOn Connect the M.O.L.E. thermal profiler to the sensors. Press the “ON” button. Place the M.O.L.E. thermal profiler in the appropriate thermal barrier and press the “Record” button. Close the thermal barrier making sure ➋ ➌ the sensor wires do not get pinched and the latch is secure.
- Page 21 As the M.O.L.E. thermal profiler and test product emerge from the process, retrieve the sensors from the test product and lay the thermal barrier on a table or flat surface. Open the thermal barrier and if the Record button is still flashing this means the M.O.L.E. thermal profiler is still logging and it should be stopped.
-
Page 22: Step 3: View Data
OPeRATiOn VieW dATA STeP 3: VieW dATA Turn ON the M.O.L.E. thermal profiler by pressing the ON/OFF button. Home Screen From the , press the Main Menu button. Press the Select Profile button. Select the desired thermal profile from the list. View KPI Press the View Profile or 11_16_2023(23:08:40)6 min long... - Page 23 When viewing a thermal profile or KPI table, you can touch the screen to toggle between views. To view the thermal profile KPI data, a table must be uploaded using MAP software. Refer to the Help System in MAP. When viewing a KPI table, you can select the desired KPI table that has been uploaded from the selector at the bottom of the...
-
Page 24: Step 4: Download Data
OPeRATiOn dOWnLOAd dATA STeP 4: dOWnLOAd dATA Connect the M.O.L.E. thermal profiler to the computer and open MAP software. Select the Read Instrument command from the M.O.L.E. menu and the workflow wizard appears. ➋... - Page 25 Select the desired data run from the memory list and then click the Finish command button to complete the wizard and read the data run from the M.O.L.E. thermal profiler. ➌ If a data run (*.XMG) is saved in a different Environment folder other than the currently selected, the software...
- Page 26 OPeRATiOn dOWnLOAd dATA When the data run has been downloaded, the software will prompt the user to name and save the data run file (*.XMG). prevent data loss, recommended that data files (*.XMG) saved in the M.O.L.E. MAP Sample Environments. Your Environment Folders should be in locations such as Libraries>Documents.
- Page 27 nOTeS: OPeRATiOn...
- Page 28 E-Mail: sales@ecd.com Web: www.ecd.com ©2023 ECD. All Rights Reserved. Foreign and US Products of ECD are covered by US Patents and Patents Pending. The trapezoidal ECD logo is a registered trademarks of ECD .M.O.L.E.™ (Multi-Channel Occurrent Logger Evaluator) is a Trademark.
Need help?
Do you have a question about the M.OL.E. EV12 and is the answer not in the manual?
Questions and answers