Table of Contents
Advertisement
Quick Links
Advertisement
Table of Contents

Related Manuals for Accuris SMARTREADER MULTIMODE


Summary of Contents for Accuris SMARTREADER MULTIMODE
- Page 1 Operation Manual V1.0 This Product is for Research Use Only...
- Page 3 Please inspect the instrument as well as all included accessories when you first open the packaging. If you find anything damaged or missing, please contact Benchmark Scientific or your local distributor immediately. BENCHMARK SCIENTIFIC / ACCURIS INSTRUMENTS PO Box 709 Edison, NJ 08818 Phone: 908-769-5555 Website: www.benchmarkscientific.com / www.accuris-usa.com...
- Page 4 To prevent injury or voiding the warranty, the operator should not attempt to repair the instrument without explicit guidance from Accuris Instruments. If service is required, please contact Accuris Instruments or your local distributor for repair. Before powering on, confirm that the voltage used meets the electrical requirements of the instrument as stated on the rating plate.
- Page 5 Pull the connector plug from the electrical outlet immediately and contact the vendor in the event of: • Liquid entering the housing. • Abnormal operation: such as any abnormal sound or smell. • The instrument is dropped or there is any damage to the housing. •...
-
Page 6: Table Of Contents
Table of Contents Chapter 1 Introduction ....................1 Key Features ...................... 1 Chapter 2 Specifications ....................2 Required Installation Environment............... 2 Specifications ..................... 2 Chapter 3 Instrument Overview ..................4 Structure ......................4 Chapter 4 Instrument Setup ................... 6 Preparation Before Use ..................6 Chapter 5 Programming &... -
Page 7: Chapter 1 Introduction
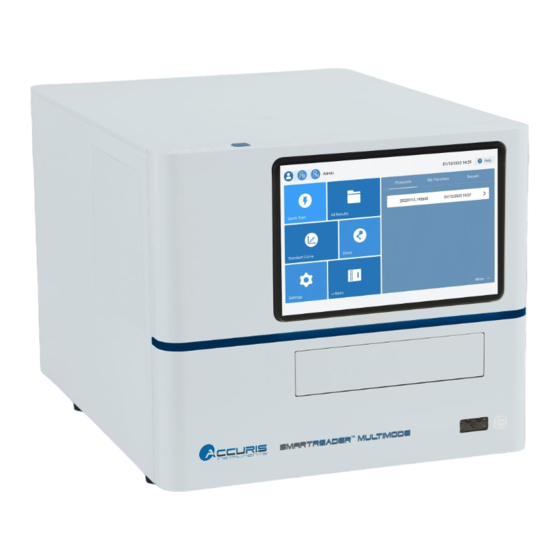
Chapter 1 Introduction The SmartReader™ Multimode is a multi-detection instrument capable of performing absorbance, fluorescence, and luminescence-based readings. Equipped with a 10-inch color touch screen, programming and operation is performed on-board. The built-in software allows for multiple algorithmic analyses of standard curves, qualitative &... -
Page 8: Chapter 2 Specifications
Chapter 2 Specifications 2.1 Required Installation Environment Environmental temperature: 10 - 40C Relative humidity: ≤ 80 % Input voltage: AC 100 – 240 V, 50 - 60 Hz, 2A 2.2 Specifications Name SmartReader™ Multi-Mode (MR9620) Measurement Absorbance, Fluorescence (FI, FRETF), Technologies Luminescence (Glow, Flash) Absorbance... - Page 9 Luminescence Plate Formats 6, 12, 24, 48, 96 & 384-well microplates Detector Detection Limit 100 amol / well Linear Dynamic Range 6 logs ≤ 0.005% Crosstalk Shaking & Incubation Linear (4.3 Hz, 7.0 Hz, & 13.5 Hz) Shaking Mode Orbital (180 RPM, 240 RPM, & 300 RPM) Double Orbital ( 90 RPM, 120 RPM, &...
-
Page 10: Chapter 3 Instrument Overview
Chapter 3 Instrument Overview 3.1 Structure Front AIM Outlet 10-inch touch screen Operational Keys Front door Side door Plate holder QR code scanning module Figure 3.1.01 Front View Side Door Filter (FL/LUM) Inlet AIM Inlet USB port Figure 3.1.02 Side Door View ─... - Page 11 Back Cooling fan outlet Internet port RS232 port USB port PC port Power socket Power switch Figure 3.1.03 Back View Figure 3.1.04; Prior to inserting the filter cartridge, the QR code (found on the filter cartridge) must be scanned by the QR code scanning module. The filter cartridge should enter smoothly if inserted in the correct orientation.
-
Page 12: Chapter 4 Instrument Setup
Chapter 4 Instrument Setup 4.1 Preparation Before Use IMPORTANT: This instrument weighs 33 kg (72.8 lbs.) and requires two persons to lift. Remove the instrument from the shipping box. Place the instrument on a flat surface. Open the side door; press the button on the head of the locking pin and pull up to release the pin. -
Page 13: Chapter 5 Programming & Operation
Chapter 5 Programming & Operation 5.1 Instrument Startup Power the instrument on. Upon start-up, the instrument will perform an automatic calibration and self-check (Fig. 5.1.01). Figure 5.1.01 Self Check Upon Startup After calibration/self-check, the login screen will be displayed (Fig. 5.1.02). Figure 5.1.02 Login Interface ─... - Page 14 User Can only perform operative functions. Note: Please store the set Admin password in a safe place. Contact Accuris Instruments if the admin password has been lost. Select “Account” to enter the Account-Admin interface (Fig. 5.1.03). To make user-specific password changes, enter the “Password” tab (Fig. 5.1.04).
-
Page 15: Quick Start Interface
Figure 5.1.05 Main Menu Interface Table 5 - 2 Main Menu Interface Operations Name Function Quick Start Select to create a new protocol. All results Select to view a list of all previously saved protocol results. Standard Select to view the standard curve library curve Select to view a list of executed protocols, standard curves, etc., Share... - Page 16 5.2 Quick Start Interface Select "Quick Start" on the main interface to enter the Quick Start interface. Users can select protocol parameters according to experimental requirements (Fig. 5.2.01). Figure 5.2.01 Quick Start Interface There are three read modes: ABS, FL, LUM. The ABS mode has three reading types: EndPoint, Kinetic, &...
- Page 17 The instrument can accept 6, 12, 24, 48, 96, & 384 well microplates. Table 5 - 4 lists the types of compatible 96 & 384-well microplates for use with the instrument. Table 5 – 4 Compatible 96/384-well Plate Types Well plate Name ANSI/SBS,clear,96-well ANSI/SBS,black,96-well...
- Page 18 5.2.01 Title Bar The title bar can be used to return to the previous page, perform protocol operations, name, and modify files (Fig 5.21.01). Figure 5.21.01 Title Bar Table 5 - 5 Legend: Title Bar Operations Name Functions Return to the main menu. Click and a prompt box will pop up asking the user to exit the current interface;...
- Page 19 5.2.02 Main Display Area The default plate layout is set to a 96-well microplate format, consisting of 8 rows (A-H) & 12 columns (1-12). Click A-H to select all the wells in the row; click 1-12 to select all the wells in this column. Select “All” above row label “A” to select all the wells of the plate.
- Page 20 Figure 5.22.02 Heat Diagram Interface (Endpoint) Fig. 5.22.03 shows the interface when a Kinetic protocol has finished. Figure 5.22.03 Kinetic Protocol Results ─...
- Page 21 5.2.03 Settings Bar In the Settings Bar, the “Step” tab can be used to view the selected wavelengths, detection methods, reading intervals, shaking levels, etc. To adjust these settings, see Chapter 5.3.1 . Figure 5.23.01 Settings Bar 5.2.04 Menu Bar The lower area of the display is the menu bar (Fig.
- Page 22 Incubation Settings: Select to enter the incubation parameters interface (Fig. 5.24.2). Incubation can be toggled on/off, and the temperature can be adjusted from a range of 15°C – 45°C. Once the incubation settings have been adjusted, select “OK” to save your adjusted setting, or select “Cancel”...
- Page 23 Figure 5.24.04 AIM Settings - Manual Mode Table 5 - 6 Legend: Automatic Injection Module Operations Name Function Wash Select the injector(s) to be used in the current protocol. Select the injector mode. The default setting is set to Prime. In Prime mode, the wash volume of is fixed.
- Page 24 Filter Settings: (Fluorescence/Luminescence Only): Select “ ” to enter the filter parameters interface. (Fig. 5.24.05) The interface will display the excitation / emission λ for the currently installed filter. To add a new filter, select “Replace”; the QR code scanner, found at the bottom right corner of the front of the instrument, will turn on.
-
Page 25: Step Settings Interface
5.3 Step Settings Interface 5.3.1 Step Settings Interface: Absorbance The step settings interface for both Endpoint and Kinetic modes for absorbance are identical (Fig 5.31.01). Users can select up to 4 wavelengths to utilize in the readings. To input any wavelength from 200-1000 nm, select the value of the current wavelength to adjust it. - Page 26 5.3.2 Step Settings Interface: Fluorescence The general step settings interface for both Endpoint and Kinetic modes for fluorescence are identical (Fig 5.32.01). Figure 5.32.01 Step Settings Interface (Endpoint / Kinetic): Fluorescence Table 5 - 8 Legend: Step Settings (Endpoint/Kinetic): Fluorescence Name Function Select to display the current excitation wavelength (EX) and...
- Page 27 5.3.3 Step Settings Interface: Luminescence The general step settings interface of Endpoint and Kinetic modes for luminescence are identical (Fig. 5.33.01). Figure 5.33.01 General Step Settings Interface (Endpoint / Kinetic LUM) Delay 1 / Delay 2: The period of time from after the AIM has performed reagent addition to when measurement begins.
- Page 28 Figure 5.33.03 Both AIM Reagents Selected 5.3.4 Kinetic Read Settings When a kinetic reading type is selected, enter the step settings interface, and select "Reading Times". The settings are divided into total time and number of readings, as shown in Fig. 5.34.01 and Fig. 5.34.02. Users can input the total time required for a kinetic assay and input the frequency of readings, or simply input the number of readings required and the frequency of readings.
- Page 29 Figure 5.34.02 Kinetic Mode - No. of readings Setting Table 5 - 9 Legend: Kinetic Read Settings Name Function Total Time/No. of The total time / intervals under which kinetic readings readings will be performed; The maximum time is 99:59:59 The number of readings to be performed;...
- Page 30 Table 5 - 10 Legend: Shake Settings Name Default settings Shake Toggle switch to enable shaking; The default value is off; “Low”, “Medium”, & “High” shaking speed can be selected; The default Speed value is set to “Low”. “Linear”, “Orbital”, & “Double Orbital” shaking type can be selected; Type The default value is set to linear.
- Page 31 5.3.7 Plate Layout Interface Select the "Layout" button found at the bottom of the Settings Bar on the main display area (Fig. 5.37.01). Main Display Area Settings Sample type Figure 5.37.01 Plate Layout Interface Sample types include blank, standard, quality control, unknown, negative, positive and clear.
-
Page 32: Analysis Interface
inputted as single samples, or in replicates, with an optional dilution factor setting. Negative control samples are used for the correlation Negative of unknown samples to the standard curve. Positive control samples are used for the correlation of Positive unknown samples to the standard curve. The Clear button allows the user to unassign any sample type on the plate layout. - Page 33 “Raw Data” is an item that cannot be deleted. The three modes of Endpoint, Kinetic and Spectrum have their own corresponding algorithm processes, and the algorithmic parameters cannot be deleted. Users can execute the existing calculation method in the data analysis area to view the corresponding data/content in the main display area and the settings bar.
- Page 34 4. Quadratic, Cubic, Quartic Polynomial Polynomial fitting calculation method, the core is the least square method. 5. Point to Point The data points are connected from point to point directly. 6. Cubic Spline Multiple linear system of equations. 7. Logit/log The core is the least square method.
- Page 35 each wavelength. Get average, SD, and CV. Integral to get the area of the curve Set reading range and take the kinetic read data of each wavelength. Calculate the area of line segments according to the calculation method of trapezoidal area (if it is multiple line segments, disassemble to calculate).
- Page 36 Select one of the operators +, -, *, / between A and B. Select data as B. Get the calculation result. 1. Spectral Maximum (select spectrum range) Select spectrum range. Select threshold. Find out the absorption peak with the maximum wavelength, which is greater than threshold.
- Page 37 Figure 5.44.01 Standard Curve Settings Table 5 - 18 Legend: Standard Curve Settings Name Function Fit type Select to designate a standard curve fitting (Fig. 5.7.01) Show Select to display values of unknown samples on the Unknowns standard curve. Through Select to view the generated standard curve as it passes origin through the point of origin.
- Page 38 Select to view the list of sample types in the current plate layout, along with values for measuring absorbance & concentrations for each wavelength measured. Select the wavelength used to perform the standard curve analysis 5.4.5 Kinetic Reading Analysis For Kinetic readings, the following calculation parameters can be set/adjusted: average, integral, baseline subtraction, select single reading, select reading range, maximum rate, maximum (peak), &...
- Page 39 Figure 5.46.01 Spectral Analysis: Data Source 5.4.7 Multi-Wavelength Analysis When basic calculation is selected, the following calculations can be set/adjusted: A+B, A-B, A*B, A/B (Fig. 5.47.01). Figure 5.47.01 Multi-Wavelength Calculation Types ─...
- Page 40 Fig. 5.47.02 shows the interface for selecting basic calculation data. The raw data and all calculated steps are displayed on the left, and all calculation options are displayed on the right. Figure 5.47.02 Multi-Wavelength Calculations: Select Data ─...
- Page 41 5.4.8 Quality Control Analysis After reading a plate, quality control calculations can be carried out in the “Analysis” tab found in the settings bar (Fig. 5.48.01). Figure 5.48.01 Quality Control Calculation Settings Table 5 - 20 Legend: Quality Control Calculation Settings Name Function Target Value;...
- Page 42 5.4.9 Classification Analysis Select “Classification” from the drop-down menu on the “Analysis” tab to view the “Classification Calculation Settings” (Fig. 5.49.01). Figure 5.49.01 Classification Calculation Settings Table 5 - 21 Legend: Classification Calculation Settings Name Function Data Type The value can be absorbance or concentration Click to enter K1 values, default 1, range 0-999999, Up to three decimal places.
-
Page 43: Smartdrop™ Accessory Plate
5.5 SmartDrop™ Accessory Plate The SmartDrop Plate is an optional accessory available for the SmartReader MultiMode. If the user has purchased the SmartDrop Accessory Plate, this function can be used for microvolume readings. Click the "SmartDrop Accessory Plate" button on the main menu interface to view the reading types available: users can select “Nucleic Acid”, “Protein”, or “UV-VIS”... - Page 44 Figure 5.51.02 Main Menu Interface: Nucleic Acids (Spectral) Table 5 - 22 Legend: Nucleic Acid Interface Operations Name Function Exit the Nucleic Acid Interface. A prompt will appear to ask if the current file should be saved prior to exiting. Select “Yes” to save the currently open file prior to exiting.
- Page 45 Table 5 - 23 Legend: Nucleic Acid Interface Settings Name Function Blank Assign a blank to a well for measurement. Assign an unknown sample to a well for Unknown measurement. Clear Clear/Erase the currently set well . Can set whether to perform a baseline-correction Baseline from a range of 220-350nm.
- Page 46 On the right of the nucleic acid interface is a list of all nucleic acid wells which include data for relevant wells. The executed icon is displayed next to the data, as shown in Fig. 5.51.04. Figure 5.51.04 SmartDrop Accessory Plate Files Interface Table 5 - 25 Legend: Files Settings Name Function...
- Page 47 Delete a protocol. A system confirmation will be required to ensure protocol deletion. Figure 5.51.05 Protocol Import via USB Figure 5.51.06 Protocol Export via USB ─...
- Page 48 5.5.2 Proteins Interface Select “Protein” and click “OK” to enter the Protein Interface. Users can select to read in multi-wavelength mode (260 & 280nm only; Fig. 5.52.01), or spectrum mode (220-350nm, 1nm step; Fig 5.52.02). Figure 5.52.01 Main Menu Interface : Proteins (Fixed Wavelengths) Figure 5.
- Page 49 Protein sample types include: A280, BSA, IgG, Lysozyme, & others. The coefficient of A280 is set to 10.0, BSA is 6.7, IgG is 13.7, Lysozyme is 26.4, and the default value of Others is 25.0. The coefficient can be manually adjusted from a range of 0.01-99.99. Figure 5.52.03 Protein Sample Types 5.5.3 UV-Vis Interface Select UV-Vis and click “OK”...
-
Page 50: Data & Report Exporting
5.5.6 Data & Report Exporting After the results have been processed, both the processed data and raw data can be exported in the Report interface. Click the "Protocol" button in the upper left corner, and then select "Report" to enter the “Data Export Interface” (Fig. 5.56.01). Figure. -
Page 51: Chapter 6 Troubleshooting
Troubleshooting Check the power plug .Check The Microplate Reader does Power supply the voltage not power on failure Contact Accuris Instruments Restart the instrument and try “Communication timeout” again; if the problem persists, Instrument Error during self-check please contact Accuris Instruments.
Need help?
Do you have a question about the SMARTREADER MULTIMODE and is the answer not in the manual?
Questions and answers