
Related Manuals for GW Instek GRF-1300


Summary of Contents for GW Instek GRF-1300
- Page 1 RF & Communication Trainer GRF-1300 TEACHER’S BOOK USER MANUAL and TEXT BOOK GW INSTEK PART NO. 82RF-13001M01 ISO-9001 CERTIFIED MANUFACTURER...
- Page 2 This manual contains proprietary information, which is protected by copyright. All rights are reserved. No part of this manual may be photocopied, reproduced or translated to another language without prior written consent of Good Will Corporation. The information in this manual was correct at the time of printing. However, Good Will continues to improve its products and therefore reserves the right to change the specifications, equipment, and maintenance procedures at any time without notice.
-
Page 3: Table Of Contents
GRF-1300 User Manual and Teaching Materials able of Contents SAFETY INSTRUCTIONS ............ 3 ABOUT THIS BOOK ............6 INTRODUCTION to the GRF-1300 ........7 Package Contents ................... 9 Product Specifications and Function .............. 9 Usage Instructions ..................10 ... - Page 4 TABLE OF CONTENTS The relationship between dB and dBc ............116 Resistor Values in π-type Resistance Attenuators ........117 Resistor Values in T-type Resistance Attenuators ........118 Modulation Index and Sideband Amplitude Comparison Table ....119 Declaration of Conformity ................120 ...
-
Page 5: Safety Instructions
WARNING Caution: Identifies conditions or practices that could result in CAUTION damage to the GRF-1300 or to other objects or property. DANGER High Voltage Attention: Refer to the Manual Protective Conductor Terminal Earth (Ground) Terminal Do not dispose electronic equipment as unsorted municipal waste. - Page 6 Disconnect the power cord before cleaning the device. Cleaning the GRF-1300 Use a soft cloth dampened in a solution of mild detergent and water. Do not spray any liquid into the device. Do not use chemicals containing harsh products such as ...
- Page 7 GRF-1300 User Manual and Teaching Materials Location: Indoor Storage environment Relative Humidity: < 70% Temperature: -10°C to 70°C Do not dispose this device as unsorted municipal waste. Please Disposal use a separate collection facility or contact the supplier from which this instrument was purchased.
-
Page 8: About This Book
ABOUT THIS BOOK BOUT THIS BOOK This textbook was developed in conjunction with the GRF- 1300 RF & Communication Trainer and the GSP-730 3GHz spectrum analyzer as an RF communications education system. It not only offers detailed examples, but also the practical knowledge necessary for RF measurements, such as spectrum analyzer principals, as well as AM and FM communication systems. -
Page 9: Introduction To The Grf-1300
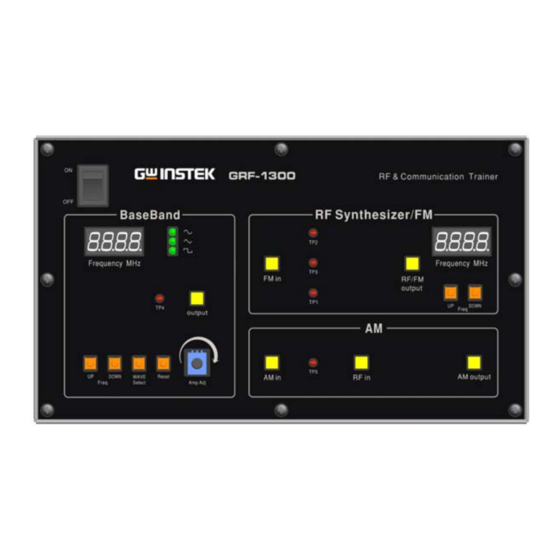
The GRF-1300 is a well designed training kit capable of producing a 3MHz baseband signal and a carrier signal up to 900MHz. The GRF-1300 is also able to perform AM and FM RF circuit experiments as well. The practical exercises in the training kit meet the needs of most general RF courses. - Page 10 INTRODUCTION to the GRF-1300 designed to modulate an audio signal with a carrier waveform. The system takes into account the difficulties arising from RF circuit theory and knowledge. It focuses on these theories and sets up experiments to understand the theoretical aspects of RF circuitry –...
-
Page 11: Package Contents
GRF-1300 User Manual and Teaching Materials Package Contents This package contains the GRF-1300 unit, RF cable – 2 * 10cm, RF cable 1* 80cm, a user manual CD, a student book, an antenna, a power cord and so on. Title... -
Page 12: Usage Instructions
When the waveform is selected, the corresponding LED light will be lit up. The Reset button is used to reset the GRF-1300. When reset, the GRF-1300 will output a 0.10MHz sine wave baseband signal and a carrier signal with a frequency 880MHz. - Page 13 GRF-1300 User Manual and Teaching Materials The four-digit display is used to display the frequency of the output baseband signal. TP4 (test point 4) is used to monitor the output signal from the output port. The potentiometer knob is used to adjust the voltage of the output baseband signal.
- Page 14 INTRODUCTION to the GRF-1300 Figure A-5. RF Synthesizer/FM module 6. The AM module is used for amplitude modulation. The AM in port and RF in port are used to input the modulating signal and the carrier signal respectively. The AM output port outputs the amplitude modulated waveform.
- Page 15 GRF-1300 User Manual and Teaching Materials 8. Install the GRF-1300 driver onto the PC. Connect the GRF-1300 to the PC. Below are the steps for installing the software. Add the install software to the install directory. Click next and a window as shown below appears.
- Page 16 INTRODUCTION to the GRF-1300 After the software installation is complete, users can perform a system error check by sending commands to the GRF-1300 using Hyper Terminal. Figure A-10. Operation interface for HyperTerminal...
- Page 17 GRF-1300 User Manual and Teaching Materials 9. Below is a table listing each instruction and a description of each function. Instruction Function *IDN? Returns the manufacturer, model name and serial number. Returns the value on the digital display of the FM/RF module.
-
Page 18: Overview Of The Time And Frequency Domain
OVERVIEW of the TIME and FREQUENCY DOMAIN VERVIEW of the TIME and FREQUENCY DOMAIN Observation from a different perspective When a signal is said to be in the time domain, it means that the signal is expressed as a function of time. For example, if we describe a sine wave signal that repeats once each microsecond (μsec, 10 ), it means that the period of the signal is... - Page 19 GRF-1300 User Manual and Teaching Materials analyzer. Voltage and power can be converted from one to the other, so both of them can be used to display the strength of a signal. Here we introduce a basic concept first. Each frequency point in the spectrum represents a sinusoidal wave (could be a sine or cosine) of a single frequency.
- Page 20 OVERVIEW of the TIME and FREQUENCY DOMAIN Time domain Frequency domain...
-
Page 21: Fourier Series
GRF-1300 User Manual and Teaching Materials Fourier Series* Most people may have heard of the Fourier series or Introduction Fourier transform. It doesn’t matter if you haven’t, it will not hinder you from reading this text. The Fourier series was... - Page 22 OVERVIEW of the TIME and FREQUENCY DOMAIN –π, and then divides by π. That is, it calculates the average over π, i.e., the DC component. In terms of a pure AC signal, the DC component or constant value is 0. Looking at the sine function, sin(x) we know that if we draw sin(3x) and sin(x), we can see the frequency of sin(3x) is three times that of sin(x), and that sin(nx) is naturally n times the...
- Page 23 GRF-1300 User Manual and Teaching Materials Low pass filter Signal with harmonic noise Signal after passing through the low pass filter Before ending the introduction to the Fourier series, we'll explain a few things. First is the formula for calculating the Fourier series coefficients.
- Page 24 OVERVIEW of the TIME and FREQUENCY DOMAIN Also keep in mind that the calculated value of the Fourier coefficients in each n represent the components of its multiplier (ie, harmonic). For example whether it is cos(3x) or sin(3x), they are all components of the third harmonic. If we use a spectrum analyzer to measure the third harmonic of the signals, a cos(3) &...
- Page 25 GRF-1300 User Manual and Teaching Materials sin( ) sin( ) sin( )+cos( ) sin( )+cos( ) cos( ) cos( ) Performing measurement of the phase difference in the frequency domain is the same as performing vector signal analysis.
-
Page 26: An Introduction To Spectrum Analyzers
AN INTRODUCTION to SPECTRUM ANALYZERS N INTRODUCTION to SPECTRUM ANALYZERS Spectrum analyzers are one of the most important instruments for RF microwave measurements. Being familiar with spectrum analyzers in general is very important for operating high frequency microwave equipment or for performing communication measurements. -
Page 27: Attenuator
GRF-1300 User Manual and Teaching Materials Figure B-1. The basic structure of a broadband Mixers Detection receiver RF Input & Display BPFs Unit Tunable LOs Next, we are going to introduce the other basic functional blocks that a spectrum analyzer is composed of. These blocks are often mentioned when instructed on how to use a spectrum analyzer. -
Page 28: Resolution Bandwidth Filter
AN INTRODUCTION to SPECTRUM ANALYZERS Resolution Bandwidth Filter When the input signal frequency is converted to an IF, a RBW (resolution bandwidth) filter is used to distinguish the signals that are close to each other in frequency. Figure B-3 shows this concept. Figure B-3. -
Page 29: Detector
GRF-1300 User Manual and Teaching Materials After passing the narrower RBW1 filter, the components of the two tone signal are clearly distinguished from each other as a result. But in the wider RBW2 filter, the result is not as clear as RBW1. -
Page 30: Video Bandwidth Filter
AN INTRODUCTION to SPECTRUM ANALYZERS Video Bandwidth Filter However, a filter is employed after the detector to filter out the noise generated by the detector. This is the function of the VBW (video bandwidth) filter as shown in Figure B-7. Figure B-7. -
Page 31: Superheterodyne Spectrum Analyzer
GRF-1300 User Manual and Teaching Materials Superheterodyne Spectrum Analyzer* For example, if the system needs to reduce the frequency of an input test signal from 2.4GHz (2400MHz, fRF) down to 20MHz, we need a local oscillator with a frequency of 2420MHz... - Page 32 AN INTRODUCTION to SPECTRUM ANALYZERS Those of you with sharp eyes may have noticed that in the example above that we still haven’t shifted the input signal to a lower frequency! We shifted the input signal (2400MHz) to a higher IF (3200MHz), but why didn’t we shift it to a lower frequency? As a spectrum analyzer is a broadband receiver, we must first shift the IF to a higher frequency and then shift the signal to a lower frequency in later stages.
-
Page 33: Rf Communication And Signals Experiments
In this chapter we will explain the basic operating principals of a spectrum analyzer and introduce the measurement experiments. Prior to this, we will briefly explain how to operate the GW Instek GSP-730 spectrum analyzer. For more detail about its operation, please refer to the GSP-730 user manual. -
Page 34: Experiment 1: Basic Operation Of A Spectrum Analyzer
RF COMMUNICATION and SIGNALS EXPERIMENTS Experiment 1: Basic Operation of a Spectrum Analyzer In addition to the sky, oceans and forests, there is an Relevant invisible, intangible, inaudible and complex electromagnetic information network in our living environment. This network is intertwined with wireless signals of various frequency bands. - Page 35 GRF-1300 User Manual and Teaching Materials The figure above is a screen shot from a typical spectrum analyzer display. The horizontal setting is frequency and the vertical axis is amplitude. Therefore a spectrum analyzer is basically used to perform frequency and amplitude-related measurements.
- Page 36 RF COMMUNICATION and SIGNALS EXPERIMENTS Step4 3. Now we should see some signals on the spectrum analyzer screen. Identify the three highest peaks and write down their frequency values. The reference level can be used to adjust the strength of the signal. 4.
- Page 37 GRF-1300 User Manual and Teaching Materials Experiment results Table 1-1. Frequency and amplitude of mobile phone’s transmitter signal. Frequency: 946.17MHz Amplitude: -68.1dBm Frequency: 936.4MHz Amplitude: -69.3dBm In addition to the mobile phone signal, what other wireless Question signals can be measured in the environment? Ans: There are various other wireless signals with different frequencies in the environment.
-
Page 38: Experiment 2: Measuring A Baseband Waveform
Adapter N-SMA 1. Measurement and analysis on a basic signal. Experiment goals 2. To understand how to use the GRF-1300 system to output a baseband signal. Set the GRF-1300 to output a 1MHz sine waveform and Experiment principles use the GSP-730 to measure its spectrum. - Page 39 GRF-1300 User Manual and Teaching Materials Step3 3. Connect the baseband signal from the output port of the GRF- 1300 to the input terminal of the GSP-730 using the RF wire. 4. Set the GSP-730 as follows: Center frequency: 2.5MHz ...
- Page 40 RF COMMUNICATION and SIGNALS EXPERIMENTS After step 6 is done, make sure the "Delta" marker is used for the next steps and not the "Normal" marker. Set the Delta Marker to the peak point of each harmonic and make a record by drawing a simple sketch of the spectrum in table 2-1.
- Page 41 GRF-1300 User Manual and Teaching Materials Experiment results Table 2-1. 1MHz sine wave spectrum test results The 2 harmonic ratio is: 34.0dB The 3 harmonic ratio is:44dB...
- Page 42 RF COMMUNICATION and SIGNALS EXPERIMENTS 1. What is the spectrum of a theoretical sine wave and why is it Question different with the actual measured one? Ans: Theoretically the spectrum of a sine wave should only have one frequency. However, because the circuit that generates the sine wave has harmonic distortion, harmonics creep into the sine wave.
-
Page 43: Experiment 3: Different Baseband Waveforms And Their Harmonic Measurement
GRF-1300 User Manual and Teaching Materials Experiment 3: Different Baseband Waveforms and their Harmonic Measurement You should already be familiar with electrical signals in Relevant information general. We have already said that an oscilloscope is used to observe the amplitude of a waveform. In other words, it is used to observe how an electrical signal, X(t), varies over time. - Page 44 3. We won’t repeat it again here. We will become familiar with using a spectrum analyzer Experiment and how to use the GRF-1300 by analyzing the spectrum of a contents simple triangle and square wave signal. 1. Turn on the GRF-1300 and the GSP-730.
- Page 45 3-1. Step6 Marker Step7 Marker 6. Select the square wave on the GRF-1300 Baseband module. Do the same spectrum measurements that were performed in the previous steps. Step8 Wave Select 7.
- Page 46 RF COMMUNICATION and SIGNALS EXPERIMENTS Step11 Marker In accordance to the method that is used above to measure the harmonic ratio, students can try to measure the harmonic ratio of the higher order harmonics. 8. After measuring the spectrum, connect the output port to the input port of the oscilloscope and measure the time domain waveform of the triangle wave and square wave, and record the results in Table 3-2 and Table 3-4.
- Page 47 GRF-1300 User Manual and Teaching Materials Table 3-2. Time domain waveform of the 1MHz triangle wave. Table 3-3. 1MHz square wave spectrum test results.
- Page 48 RF COMMUNICATION and SIGNALS EXPERIMENTS Table 3-4. Time domain waveform of the 1MHz square wave. 2. For the triangle waveform, measure the harmonic ratio of the and 5 harmonic. For the square waveform, measure the harmonic ratio of the 2 and 3 harmonic.
- Page 49 GRF-1300 User Manual and Teaching Materials Harmonic ratio of the 5th harmonic for triangle wave (30bB) Harmonic ratio of the 2 harmonic for square wave (36.0dB)
- Page 50 RF COMMUNICATION and SIGNALS EXPERIMENTS Harmonic ratio of the 3 harmonic for square wave (10dB) 1. Compare the measurement results from the frequency domain Question and the time domain, and consider the relationship to the Fourier series theory. Ans: According to the Fourier theory, any periodic signal can be decomposed into a number of sine waves that are composed of a number of different frequencies.
- Page 51 GRF-1300 User Manual and Teaching Materials ) cos n t t n t t 1,3,5... π 2, 4, 6...
-
Page 52: Experiment 4: Measurement Of The Rf Carrier
GRF-1300 Trainer RF wire 800mm Adapter N-SMA Measure an RF signal from the GRF-1300 RF & Experiment goals Communication Trainer. Also perform measurements on more important parameters such as phase noise and harmonic distortion. A Phase locked loop (PLL) is a phase error control system. - Page 53 GRF-1300 User Manual and Teaching Materials Figure 4-1. PLL circuit structure Above: PD is the phase-locked loop phase detector, LF is the loop filter and VCO stands for voltage-controlled oscillator. The purity of the output signal from the VCO is directly related to the phase noise.
- Page 54 RF COMMUNICATION and SIGNALS EXPERIMENTS Experiment steps 1. Turn on the GRF-1300 and GSP-730. Leave the GRF-1300 in its Measure the RF signal spectrum power-on state. and harmonic distortion. 2. Connect the RF/FM output port on the GRF-1300 to the input terminal on GSP-730 with the RF cable.
- Page 55 2. Set the GRF-1300 RF Synthesizer/FM as follows: Carrier frequency: 875MHz Step1 3. Connect the RF/FM output port on the GRF-1300 to the input terminal on GSP-730 with the RF cable. 4. Set the GSP-730 as follows: Center frequency: 875MHz ...
- Page 56 RF COMMUNICATION and SIGNALS EXPERIMENTS results in Table 4-3. 6. Adjust the PLL output frequency to 900MHz, and again measure the power and phase noise corresponding to the frequency. Step7 Step8 Peak Step9 Search Record the carrier power. Set the deviation carrier frequency of 100kHz.
- Page 57 GRF-1300 User Manual and Teaching Materials 1. Measurement of the RF signal spectrum. Experiment results Table 4-1. RF Signal Spectrum 2. RF Signal Harmonic measurements Table 4-2 2nd Harmonic measurement(14...
- Page 58 RF COMMUNICATION and SIGNALS EXPERIMENTS Table 4-2 3rd Harmonic measurement(24 .2dB) 3. Phase noise measurement results Table 4-3. Phase Carrier Experiment results Noise Frequency measurement results 875MHz Carrier frequency:875.09MHz Output power: -6.9dBm Phase noise: -30.9-10lg(1.2*50000)+2.5=- 76.18dBc/Hz(100KHz)...
- Page 59 GRF-1300 User Manual and Teaching Materials 900MHz Carrier frequency:900.09MHz Output power: -8.0dBm Phase noise: -32-10lg(1.2*50000)+2.5=-77.28 dBc/Hz(100KHz) 910MHz Carrier frequency:910.1MHz Output power: -9.0dBm Phase noise: -32-10lg(1.2*50000)+2.5=-77.28 dBc/Hz(100KHz)
- Page 60 RF COMMUNICATION and SIGNALS EXPERIMENTS 1. A PLL circuit is formed by which parts? Explain the function Questions of each part. Ans: A Phase-locked loop is mainly composed of the phase detector, loop filter and voltage controlled oscillator (VCO). The phase detector is primarily responsible for detecting a phase error between the input reference signal and the output signal from the VCO.
-
Page 61: Phase Locked Loop
GRF-1300 User Manual and Teaching Materials Phase Locked Loop * A Phase locked loop (PLL) is a phase error control system. Experiment It compares the phase between a reference signal and an output principles signal to generate a phase error voltage for adjusting the frequency of the VCO –... - Page 62 RF COMMUNICATION and SIGNALS EXPERIMENTS Figure 2. Practical application of a The frequency that is output from the reference signal frequency divider and the programmable divider are input into the phase detector. The phase detector contains two D flip-flops, two transistor switches, a charging circuit, an inverter and an AND gate.
- Page 63 GRF-1300 User Manual and Teaching Materials State Table 1. The UP, High impedance DN and output state relationship Reset Up and DN zero Based on the table above, we can see what the output state is of U when U and U have different phases.
- Page 64 RF COMMUNICATION and SIGNALS EXPERIMENTS 2. The voltage-controlled oscillator (VCO) The voltage-controlled oscillator (VCO) is an oscillator in which its output signal frequency varies with a change of the input voltage. It can also be used as a voltage frequency converter, a frequency sweep signal generator or even as a frequency modulator.
- Page 65 GRF-1300 User Manual and Teaching Materials system, you would need to reduce the bandwidth as much as possible in the PLL design so that its output voltage is as close to DC as possible. But if the bandwidth is too small, it will cause the locking time to be prolonged so much that the system can’t...
-
Page 66: Experiment 5: Am Signal Measurement
FM as well as AM principles and characteristics. Experiment Item Equipment Quantity Note equipment Spectrum analyzer GSP-730 RF & Communication GRF-1300 Trainer RF wire 100mm RF wire 800mm Adapter N-SMA 1. Learn the working principals of amplitude modulation. Experiment goals 2. - Page 67 GRF-1300 User Manual and Teaching Materials used: AM, FM and phase modulation. This experiment begins with AM to learn some modulation theory. AM uses the modulating signal to control the amplitude of the high-frequency carrier signal. The modulating signal is used to alter the amplitude of the carrier in proportion to the amplitude of the modulating signal.
- Page 68 RF COMMUNICATION and SIGNALS EXPERIMENTS Therefore, the information in a modulating signal is carried in the amplitude of an amplitude modulated wave. The following figure shows how a signal changes from a carrier signal (unmodulated state) to an AM wave (modulated state). Figure 5-1.
- Page 69 2. Measure the spectrum of the AM wave with different carrier frequencies and with modulating signals with different amplitudes. 1. Turn on the power to the GRF-1300 and GSP-730. Experiment steps 2. Set the GRF-1300 as follows: Set the GRF-1300 to the default power-on state.
- Page 70 RF COMMUNICATION and SIGNALS EXPERIMENTS Step3 Step4 5. Use the Marker function to measure the carrier component of the AM wave on the spectrum analyzer and the power of the upper and lower sidebands. Use the oscilloscope to measure the voltage at TP4 in relation to the position of the potentiometer (i.e., the modulating amplitude).
- Page 71 GRF-1300 User Manual and Teaching Materials After completing the experiment steps above, press the Reset button, and then use the UP button on the RF Synthesizer/ FM module to change the frequency of the carrier signal. Is there is any change in the AM wave...
- Page 72 RF COMMUNICATION and SIGNALS EXPERIMENTS 1. Changing modulating voltage Experiment results Table 5-4. Modulating Experiment results Experiment voltage results: Changing the modulating Vpp:2.4Vpp voltage Carrier power: -27.8dBm Modulation index: : -27.8-6.0=-33.8dBm Lower sideband power: : 1 Vpp: 1.8Vpp Carrier power: -27.8dBm Modulation index: : -27.8-10.0=-37.8dBm Lower sideband power: : 0.63...
- Page 73 GRF-1300 User Manual and Teaching Materials Vpp: 0.6Vpp Carrier power: -27.8dBm Modulation index: : -27.8-17.0=-44.8dBm Lower sideband power: : 0.28 Conclusion: From the experimental data it can be seen that by changing the amplitude of the modulating voltage, a proportional change will occur in the amplitude of the upper sideband and lower sideband frequencies in the modulated waveform.
- Page 74 RF COMMUNICATION and SIGNALS EXPERIMENTS 2. Changing the modulating signal frequency. Table 5-5. Modulating Experiment results Experiment frequency results: Changing the modulating 100kHz signal frequency. Carrier power: : -27.8dBm Lower sideband power: : -27.8-3.9=-31.7dBm 300Khz Carrier power: : -27.8dBm Lower sideband power: : -27.8-13=-40.8dBm...
- Page 75 GRF-1300 User Manual and Teaching Materials 600kHz Carrier power: : -27.8dBm Lower sideband power: : -27.8-19=-46.8dBm Conclusion: The distance from upper sideband and lower sideband to carrier in the AM wave changes in respect to the changes to the frequency of the modulating signal, and it is equal to the frequency in the modulated signal.
- Page 76 RF COMMUNICATION and SIGNALS EXPERIMENTS 3. Changing the carrier frequency. Table 5-6. Carrier Experiment results Experiment Frequency results: Changing the carrier 882MHz frequency. 880MHz...
- Page 77 GRF-1300 User Manual and Teaching Materials 878MHz Conclusion: Changing the carrier frequency does not affect the amplitude of the modulated signal. The frequency of the modulated signal sidebands on both sides of the carrier follow the change in frequency of the carrier.
-
Page 78: Experiment 6: Fm Signal Measurement
Experiment Item Equipment Quantity Note equipment Spectrum analyzer GSP-730 RF & Communication GRF-1300 Trainer RF wire 100mm RF wire 800mm Adapter N-SMA 1. Understand the working principals of frequency modulation. Experiment goals 2. - Page 79 GRF-1300 User Manual and Teaching Materials 1. Time domain analysis. Frequency modulation is a type of Experiment principles modulation in which the instantaneous frequency deviation of the modulated signal with respect to the frequency of the carrier signal is directly proportional to the instantaneous amplitude of the modulating signal.
- Page 80 RF COMMUNICATION and SIGNALS EXPERIMENTS In the positive half-period of the modulating signal, the frequency of the modulated signal is higher than the frequency of the carrier signal. At the peak of the positive half-period, the angular frequency of the modulated signal is at its peak. In the negative half-period of the modulating signal, the frequency of the modulated signal is lower than the frequency of the carrier signal, and its angular frequency is at its lowest.
- Page 81 GRF-1300 User Manual and Teaching Materials t m U Then we get, cos( cos( We can see when m <<1, the FM wave spectrum is composed of the carrier, ( ω...
- Page 82 0.5 The FM circuit in the GRF-1300 uses a phase-locked loop. Using a PLL circuit for FM modulation not only solves the center frequency stability problems in direct FM modulation but also the narrow FM range limitations when using a crystal oscillator.
- Page 83 GRF-1300 User Manual and Teaching Materials Under the default state (the state from power-up), turn the potentiometer to the minimum position. Connect the output port on the Baseband module to the FM in port on the RF Synthesizer/FM module with an RF cable.
- Page 84 RF COMMUNICATION and SIGNALS EXPERIMENTS modulating signal changes? Follow the steps below to measure the frequency deviation and record it in Table 6-2. Step7 7. Adjust the potentiometer to the maximum position. Repeat the above steps and record the results in Table 6-2. Step8 8.
- Page 85 GRF-1300 User Manual and Teaching Materials Step13 Adjust the carrier frequency again. See if there is any change on FM wave spectrum and record it to Table 6-4. Step14 1. Changing the amplitude of the modulating signal. Experiment results Table 6-2.
- Page 86 RF COMMUNICATION and SIGNALS EXPERIMENTS Vpp: 1.8Vpp Frequency deviation: 8.7MHz FM index: 87 Vpp:2.4Vpp Frequency deviation: 12.8MHz FM index: 128 Conclusion By keeping the modulating frequency unchanged, the frequency deviation of the modulated signal increases with the increase in amplitude of the modulating signal.
- Page 87 GRF-1300 User Manual and Teaching Materials 2. Changing the frequency of an FM signal. Table 6-3. Modulating Experimental result Experimental frequency results: Changing the 100kHz frequency of the FM signal 300Khz...
- Page 88 RF COMMUNICATION and SIGNALS EXPERIMENTS 600kHz 1MHz Conclusion The frequency of the modulating signal affects the rate at which the side-frequency changes. Increasing the frequency of the modulation signal on the condition of keeping the amplitude of modulating signal unchanged will decrease the modulation index (Mf).
- Page 89 GRF-1300 User Manual and Teaching Materials 3. Changing the carrier frequency Table 6-4. Carrier Experimental result Experimental frequency results: Changing the 875MHz carrier frequency 880MHz...
- Page 90 RF COMMUNICATION and SIGNALS EXPERIMENTS 890MHz Conclusion After the modulating signal is modulated onto the carrier signal, any changes to the carrier frequency have no effect on other modulation parameters. 4. Draw a table to record the time domain waveform of the AM wave that is measured by the oscilloscope.
-
Page 91: Experiment 7: Using A Spectrum Analyzer In Communication Systems
GRF-1300 User Manual and Teaching Materials Experiment 7: Using a Spectrum Analyzer in Communication Systems ACPR and OCBW are important parameters in the Relevant information measurement of RF modulated signals. It is very important to master using a spectrum analyzer to measure ACPR and OCBW. - Page 92 RF COMMUNICATION and SIGNALS EXPERIMENTS 1. ACPR Measurement Experiment principles ACPR (Adjacent Channel Power Ratio) is the ratio of the amount of power leaked to an adjacent channel from the main channel. It represents how much power from the transmitter leaks into the transmission band of other channels.
- Page 93 1300. 2. Measure the OCBW from the FM signal produced by the GRF- 1300. 1. Turn on the GRF-1300 and GSP-730. Experiment steps 2. Set up the GRF-1300 as follows: Set the GRF to the power-on default state.
- Page 94 RF COMMUNICATION and SIGNALS EXPERIMENTS 3. Set up the GSP-730 as follows: Center frequency:880MHz Span: 10MHz Reference level: -10dBm RBW: Auto Step1 Step2 Step3 Step4 4. Adjust the FM frequency deviation to 1MHz (2MHz in total) with the amplitude knob.
- Page 95 Step4 The OCBW% is default at 90%. Record the measurement data in Table 7-2 Step5 Adjust the frequency deviation of FM wave by adjusting the potentiometer of GRF-1300. Measure the OCBW% again and record the results to table 7-2. Record the measurement data in Table 7-2...
- Page 96 RF COMMUNICATION and SIGNALS EXPERIMENTS 1. ACPR measurement results Experiment results 1MHz frequency deviation results 2MHz frequency deviation results Item Table 7-1. ACPR measurement Test No. Lower ACPR1 Upper ACPR1 Lower ACPR2 Upper ACPR2 results -42.3 -43.0 -55.6 -55.9 -42.2 -42.9 -55.4 -57.0...
- Page 97 GRF-1300 User Manual and Teaching Materials 2. OCBW measurement results 1MHz frequency deviation results 2MHz frequency deviation results OCBW%:90% Table 7-2. OCBW measurement Test No. CH Power OCBW results 89.2 89.1 89.2 89.2...
- Page 98 RF COMMUNICATION and SIGNALS EXPERIMENTS Describe the definition for ACPR? Questions Ans: ACPR stands for adjacent channel power ratio. It is the average power ratio of the adjacent frequency to that of the transmission channel power. It represents how much energy from the transmitter falls within the transmission band of other channels.
-
Page 99: Experiment 8: Measurement Of Communication Products
GRF-1300 User Manual and Teaching Materials Experiment 8: Measurement of communication products The computer mouse has experienced nearly four decades Relevant of evolution and development since its inception in 1968. With information the popularity of consumer oriented computers over the past decade, the mouse has seen tremendous progress. - Page 100 RF COMMUNICATION and SIGNALS EXPERIMENTS In this experiment we will use a 2.4G wireless mouse. It Experiment principles uses the so-called 2.4G frequency band. The advantage of the 2.4G band over the 27MHz band is that the 27MHz band has a shorter transmission distance and is prone to interference from other devices.
- Page 101 GRF-1300 User Manual and Teaching Materials 4. A connection diagram is shown below. Antenna 5. A blue tooth device or wireless network card can also be used in the same way to create a signal to measure. Experiment results Transmitting frequency: 2.409GHz...
- Page 102 RF COMMUNICATION and SIGNALS EXPERIMENTS Use the Peak Hold function on the spectrum analyzer to capture the signal emitted from the wireless mouse. It is not easy to dynamically measure the signal.
-
Page 103: Experiment 9: Production Line Applications
This saves a lot of time and can improve the efficiency of a production line. In this experiment, we will imagine that the GRF-1300 is in a production line environment. We will use the limit line function to perform a simple test to see if a product has passed the test and return the test results using remote commands. - Page 104 RF COMMUNICATION and SIGNALS EXPERIMENTS Set the amplitude and frequency of each point. Use the arrow keys to move the cursor to each of the different points. Use the same method is used to edit both the upper and lower limit lines.
- Page 105 1. Turn on the GRF-1300 and GSP-730. Experiment steps 2. Set the GRF-1300 to the power-on default state. 3. Connect the RF wire from the output port on the baseband module to the FM in port on the RF Synthesizer/FM module.
- Page 106 6. According to the procedures above, students can set the limit lines. 7. Adjust the amplitude knob on the GRF-1300. Observe the Pass/Fail test results and record the results to table 9-1. 8. The same functionality can be achieved by sending remote...
- Page 107 GRF-1300 User Manual and Teaching Materials Experiment results Table 9-1. Results for adjusting the position of the amplitude knob. 5MHz frequency deviation test results. 10MHz frequency deviation test results.
-
Page 108: Test For Learning Outcomes
1: RF signal Fault Simulation The Instructor is to set the faults as follows on the GRF-1300 and let the students design a test project to analyze the cause of the malfunction(s). 1. Set the GRF-1300 to the default power-on state. - Page 109 GRF-1300 panel displays 880MHz, but the frequency measured description: by the spectrum analyzer deviates from 880MHz. The RF frequency can’t be adjusted up or down on the GRF-1300. Although there is a frequency output from the oscillator, it is not Hypothesis: locked on to a frequency.
- Page 110 The FM wave spectrum can be observed on the spectrum analyzer but the carrier frequency deviates from the displayed value on the GRF-1300. Turn the potentiometer right and left to see if FM wave deviation changes. FM modulation can be performed which means that both the Hypothesis: modulating signal and the carrier signal can be output normally.
- Page 111 GRF-1300 User Manual and Teaching Materials The frequency on the RF module can be adjusted up or down. Fault description: No modulated wave appears on the spectrum analyzer, but the carrier spectrum appears on the spectrum analyzer and with the same frequency as that displayed on the RF module.
- Page 112 TEST for LEARNING OUTCOMES 3: AM Fault Simulation 1. Set the GRF-1300 to the default power-on state. 2. Disconnect the original connection. Connect the output port to the AM in port with an RF cable. Connect the RF/FM output port to the RF in port with an RF cable.
- Page 113 GRF-1300 User Manual and Teaching Materials The frequency on the RF module can be adjusted up or down, Fault description and a spectrum with the same frequency as that displayed on the RF module appears on the spectrum analyzer. But no amplitude modulation appears.
-
Page 114: Additional Knowledge
TEST for LEARNING OUTCOMES Additional Knowledge* A phase looked loop is made from a phase detector (PD) Principles and a low pass filter (LF). The PLL is a negative phase feedback system. The PD is used to detect the phase error between ui(t)and uo(t) to then get the error voltage ud(t). - Page 115 GRF-1300 User Manual and Teaching Materials When ui(t) is a sine signal with a fixed frequency (θi(t) is a constant), under the interaction of the loop, the VCO output signal frequency can vary from the free-running frequency ωo(the frequency of the VCO when there is no input signal) to the input signal frequency ωi.
- Page 116 Relays are set in each major part of the phase-locked loop on the GRF-1300. The opening and closing of these relays are controlled by commands. By turning parts of the circuit on or off, we can observe the corresponding events to analyze how parts of the circuit interact.
-
Page 117: Appendix
GRF-1300 User Manual and Teaching Materials PPENDIX We have included some commonly-used conversion tables for use with the questions. dBm Conversion Table dBm, dBuV and dBmV are all absolute units. i.e., they represent a physical quantity. The corresponding conversion tables are... -
Page 118: The Relationship Between Db And Dbc
APPENDIX The relationship between dB and dBc The figures in the table above are based on a 50Ω load. As an example, as -30dBm is equal to 0.001mW or 10 W, therefore with a 50Ω load it is 7071.07 uV or 0.007071mV. The formulas and derivations from the above table are: ... -
Page 119: Resistor Values In Π-Type Resistance Attenuators
GRF-1300 User Manual and Teaching Materials Resistor Values in π-type Resistance Attenuators 50Ω 50Ω 869.55 5.77 869.55 436.21 11.61 436.21 292.40 17.61 292.40 220.97 23.85 220.97 178.49 30.40 178.49 150.48 37.35 150.48 130.73 44.80 130.73 116.14 52.84 116.14 104.99 ... -
Page 120: Resistor Values In T-Type Resistance Attenuators
APPENDIX Resistor Values in T-type Resistance Attenuators 50Ω 50Ω 1 2.88 433.34 2.88 2 5.73 215.24 5.73 3 8.55 141.93 8.55 4 11.31 104.83 11.31 5 14.01 82.24 14.01 6 16.61 66.93 16.61 7 19.12 55.80 19.12 8 21.53 47.31 21.53 ... -
Page 121: Modulation Index And Sideband Amplitude Comparison Table
GRF-1300 User Manual and Teaching Materials Modulation Index and Sideband Amplitude Comparison Table... -
Page 122: Declaration Of Conformity
No. 69 Lushan Road, Suzhou City(Xin Qu), Jiangsu Sheng, China. declare that the below mentioned product Type of Product: RF & Communication Trainer Model Number: GRF-1300 are herewith confirmed to comply with the requirements set out in the Council Directive on the Approximation of the Law of Member States relating to Electromagnetic Compatibility (2004/108/EEC) and Low Voltage Directive (2006/95/EEC).
Need help?
Do you have a question about the GRF-1300 and is the answer not in the manual?
Questions and answers