Sign In
Upload
Download
Table of Contents
Contents
Add to my manuals
Delete from my manuals
Share
URL of this page:
HTML Link:
Bookmark this page
Add
Manual will be automatically added to "My Manuals"
Print this page
×
Bookmark added
×
Added to my manuals
Manuals
Brands
Newport Manuals
Measuring Instruments
290 Series
User manual
Newport 290 Series User Manual
Quadcell photoreceivers
Hide thumbs
1
2
Table Of Contents
3
4
5
6
7
8
9
10
11
12
13
14
15
16
17
18
19
20
21
22
23
24
25
26
page
of
26
Go
/
26
Contents
Table of Contents
Bookmarks
Table of Contents
Table of Contents
Introduction
Overview
Tips for Best Operation
Operation
Setting up the Receiver
Checking and Replacing the Battery
Using an External Power Supply
General Features and Principles
Amplifier Circuitry
Gain and Bandwidth
Normalization of Outputs
Position Transfer Function
Selecting the Optimal Gain Setting
Frequency Response and Noise
Characteristics
Physical Specifications
Operating Specifications
Customer Service
Technical Support
Service
Advertisement
Quick Links
Download this manual
U S E R ' S G U I D E
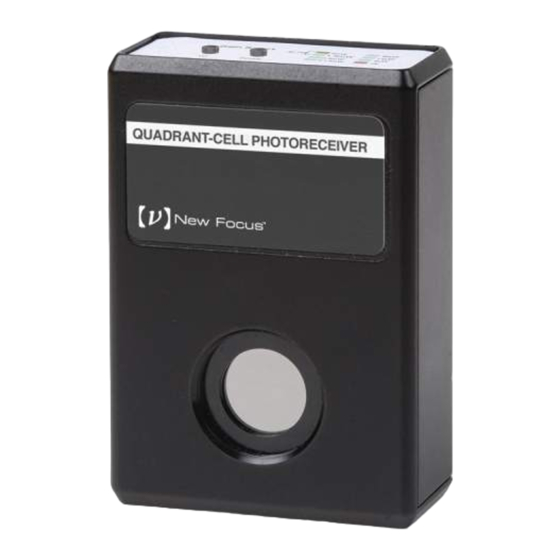
Quadcell Photoreceivers
Model 290X
phone: (877) 835-9620 e-mail: tech@newport.com www.newport.com
Table of
Contents
Previous
Page
Next
Page
1
2
3
4
5
Advertisement
Table of Contents
Need help?
Do you have a question about the 290 Series and is the answer not in the manual?
Ask a question
Questions and answers
Related Manuals for Newport 290 Series
Measuring Instruments Newport 1936-R series User Manual
Single and dual-channel optical meters (150 pages)
Measuring Instruments Newport 1936-R Series Startup Manual
Single and dual-channel optical meters (19 pages)
Measuring Instruments Newport 2832-C Instruction Manual
Dual-channel power meter (118 pages)
Measuring Instruments Newport 2835-C Manual
Multi-function optical meter (131 pages)
Measuring Instruments Newport Cornerstone 260B User Manual
1/4m monochromator family (77 pages)
Measuring Instruments Newport 2901 User Manual
Quadcell photoreceivers (26 pages)
Measuring Instruments Newport 2903 User Manual
Quadcell photoreceivers (26 pages)
Measuring Instruments Newport OPHIR Photonics Spiricon Pyrocam IV User Manual
(44 pages)
Measuring Instruments Newport IDP Quick Start
Process meter (2 pages)
Measuring Instruments Newport INFINITY INFCR Operator's Manual
C programmable digital rtd meter (52 pages)
Measuring Instruments Newport INF-B Operation Manual
Isolated analog output option (2 pages)
Measuring Instruments Newport 1815-C Operator's Manual
Optical power meter (34 pages)
Measuring Instruments Newport INFCP Quick Start
Infcp-***b series. process meter (2 pages)
Measuring Instruments Newport 1830-C Instruction Manual
Optical power meter (74 pages)
Measuring Instruments Newport INFINITY C Series Operator's Manual
Thermistor indicator/controller (56 pages)
Measuring Instruments Newport Cornerstone 130B User Manual
1/8m monochromator family (75 pages)
This manual is also suitable for:
2901
2903
Table of Contents
Print
Rename the bookmark
Delete bookmark?
Delete from my manuals?
Login
Sign In
OR
Sign in with Facebook
Sign in with Google
Upload manual
Upload from disk
Upload from URL


Need help?
Do you have a question about the 290 Series and is the answer not in the manual?
Questions and answers