Table of Contents
Advertisement
Quick Links
Advertisement
Table of Contents

Related Manuals for Chauvin Arnoux CA 8345


Summary of Contents for Chauvin Arnoux CA 8345
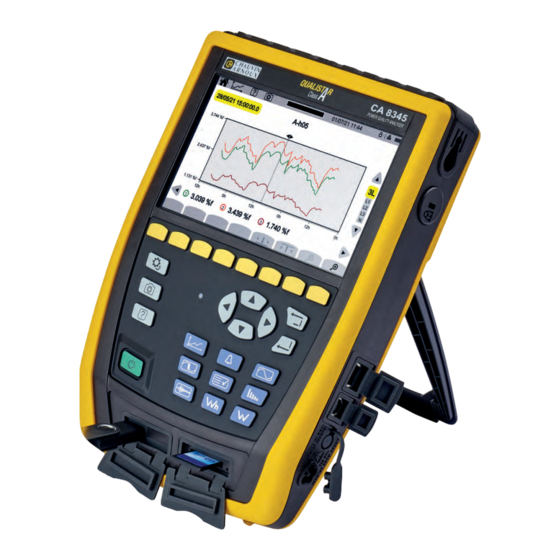
- Page 1 EN - User’s manual CA 8345 Three-phase electrical network analyser...
- Page 2 Useful information or tip. SD card. Chauvin Arnoux has designed this instrument in the context of a global Eco-Design approach. A life cycle analysis was carried out to master and optimize the impact of this product on the environment. More precisely, the product exceeds the requirements of regulations as regards recycling and valuation.
- Page 3 PRECAUTIONS FOR USE This instrument is compliant with safety standard IEC/EN 61010-2-030 or BS EN 61010-2-030, the leads are compliant with IEC/ EN 61010-031 or BS EN 61010-031, and the current sensors are compliant with IEC/EN 61010-2-032 or BS EN 61010-2-032, for voltages up to 600V in category IV.
-
Page 4: Table Of Contents
CONTENTS 1. COMMISSIONING ............5 11. INRUSH CURRENT MODE ........69 1.1. Delivery condition ..........5 11.1. Start of a capture ..........69 1.2. Accessories ............6 11.2. List of captures ..........70 1.3. Spare ..............6 11.3. Reading a capture ..........70 1.4. Charging the battery ..........7 12. -
Page 5: Commissioning
’ “ • Figure 1 One CA 8345 with its battery, one SD card, and a protective film on the display unit. 5 black straight-straight banana-banana safety leads attached with a Velcro tie. 5 black crocodile clips. 5 cable reels One hand strap. -
Page 6: Accessories
1.2. ACCESSORIES „ MN93 clamp „ Three-phase 5 A adapter „ MN93A clamp „ Essailec ® 5A three-phase adapter „ C193 clamp „ PAC93 clamp „ AmpFlex „ MiniFlex ® A193 450 mm ® MA194 250 mm „ AmpFlex „ MiniFlex ®... -
Page 7: Charging The Battery
1.4. CHARGING THE BATTERY Before the first use, start by fully charging the battery. „ Remove the plastic film that prevents connecting the battery to the instrument. For this, refer to § 18.3, which explains how to remove the battery from the instrument. „... -
Page 8: Description Of The Instrument
The instrument provides a large choice of current sensors, for measurements from a few milliamperes up to several kiloamperes. The instrument is compact and impact-resistant. The ergonomics and simplicity of its user interface make it a pleasure to use. The CA 8345 has a large colour touch screen graphic display unit. It can also manage 3 user profiles. - Page 9 „ Measurement of active, reactive (capacitive and inductive), non-active, distorting, and apparent energy, per phase and total (without neutral). „ Valuation of the energy directly in currency (€, $, £, etc.), with a basic rate and 8 special rates. „ Measurement of current and voltage harmonics (neutral included) up to order 63: RMS value, percentages referred to the fundamental (%f) (without neutral) or to the total RMS value (%r), minimum and maximum and harmonic sequence level.
-
Page 10: Overall View
2.2. OVERALL VIEW Measurement terminals QUALI ST R CA 8345 Class POWER & QUALITY ANALYSER Colour touch screen Function keys (yellow keys) Configuration key Screenshot key Return key Navigation keys Help key Validation key On/Off button Mode keys (violet keys) Connector for USB drive. -
Page 11: Connectors On Side
2.4. CONNECTORS ON SIDE Strap attachment point. Theft-proofing device, used to secure the instrument with a padlock. RJ45 connector for Ethernet connection. USB type B connector for connection to a PC. Special 4-point connector for the mains power supply. This is used to charge the battery or operate the instrument on mains power. -
Page 12: Display Unit
2.6. DISPLAY UNIT The CA 8345 has a large colour touch-screen display unit (WVGA). Below, a typical screen. The status bar at the top of the screen reports the status of the instrument. Screenshot. Frequency measured. Help. Date and time. -
Page 13: Keypad
2.8. KEYPAD 2.8.1. MODE KEYS (PURPLE KEYS) These 9 keys are used to access specific modes: Function § 5 Waveform mode § 6 Harmonic mode § 7 Power mode § 8 Energy mode § 9 Trend mode § 10 Transient mode §... -
Page 14: Installation Of The Colour Codes
2.9. INSTALLATION OF THE COLOUR CODES To identify the cords and the input terminals, you can mark them using the coloured markers provided with the instrument. „ Break off the sector and insert it in the two holes provided for this purpose near the terminal (the large one for the current terminal and the small one for the voltage terminal). -
Page 15: Memory Card
„ Press on the memory card to remove it from its slot. „ Slide the new SD card all the way home in its slot. The red indicator lights. „ Then close the elastomer cap. QUALI ST R CA 8345 Class POWER & QUALITY ANALYSER SD card present indicator. -
Page 16: Prop
2.11. PROP There is a retractable prop on the back of the instrument to hold it at an angle of 60°. Figure 10 2.12. MAGNETISED HOOK (OPTIONAL) The magnetised hook can be used to suspend the instrument from the top of a door or attach it to a metallic surface. Magnet. -
Page 17: Configuration
3. CONFIGURATION Before using it, you must configure your instrument. The CA 8345 has 2 configuration menus: „ the configuration of the instrument itself „ Configuration of the measurements Press the key. To configure the instrument. User. To configure the measurements. -
Page 18: Configuration Of The Instrument
3.3. CONFIGURATION OF THE INSTRUMENT Figure 13 Except for the display and the language, the configuration of the instrument cannot be changed if the instrument is record- ing, metering energy, recording transients or alarms, or capturing an inrush current. 3.3.1. LANGUAGE To choose the language of your instrument, select Choose your language, then validate using the key. - Page 19 3.3.2.1. GPS MODE The GPS mode is necessary to guarantee that your instrument is class A (per IEC 61000-4-30). The instrument must be exposed at least once to the GPS satellites, so that the receiver can recover the date and time. Correct synchronisation may take up to 15 minutes.
- Page 20 3.3.3. DISPLAY to open the display configuration menu. Select Figure 18 3.3.3.1. COLOURS OF THE VOLTAGE CURVES To choose the colours of the voltage curves, select Choose one colour for each of the 3 phases and for the neutral. You can choose from among about thirty colours. In night mode, the white background turns black and the colours are reversed.
- Page 21 The screen indicates the content of the SD card or of the USB drive To eject the SD card or the USB drive, press You must eject the SD card before removing it from the instrument, since otherwise you risk losing part or all of its content. When the SD card is removed, the red SD card present indicator goes off and the symbol is displayed in the status bar.
- Page 22 3.3.5.1. ETHERNET LINK. symbol indicates that the link is active. symbol indicates that the link is inactive and that it can be activated. To modify a link, deactivate it by pressing „ Check the DHCP (Dynamic Host Configuration Protocol) box and the instrument requests the IP address of a DHCP server. If no DHCP server replies, an IP address will be generated automatically.
- Page 23 3.3.5.4. IRD SERVER IRD (Internet Relay Device) is a protocol used for communication between two peripherals located in two distinct sub-networks (for example a PC and a measuring instrument). Each peripheral connects to an IRD server and this server links the two peripherals. To control an instrument from a PC, enter the identification of the instrument and a password.
-
Page 24: Configuration Of The Measurements
Select: „ to update from the Chauvin Arnoux web site via the Ethernet link. „ to update from the SD card. „ to update from the USB drive. to download the file (this may take several minutes), then Press to start the update. - Page 25 3.4.1. CALCULATION METHODS To choose the calculation methods, select Figure 29 to specify the nominal values. „ The nominal frequency (50 or 60 Hz) „ The nominal voltage, „ The nominal voltage between phases. The nominal voltage configured here is the Nominal System Voltage (U ).
- Page 26 to specify the waveform mode. Figure 31 „ The method of calculation of the flicker of the P (fixed or moving window), „ moving window: the P will be calculated every 10 minutes. The first value will be available 2 hours after the instrument is switched on, because 12 values of P are needed to calculate P „...
- Page 27 to specify the curve of maximum MSV voltages as a function of frequency. There are 5 preset points that you can modify. Figure 33...
- Page 28 3.4.2. THE DISTRIBUTION NETWORK AND THE TYPE OF CONNECTION, To choose the connection of the instrument according to the distribution network, select One or more types of network correspond to each distribution system. Distribution system Electrical diagram Network Single-phase, 2 wires (L1 and N) Single-phase, 2 wires with neutral, without earth Single-phase, 3 wires...
- Page 29 Distribution system Electrical diagram Network Two-phase, 4 wires with neutral and earth Three-phase, 4 wires in open star with neutral and earth Two-phase, 4 wires (L1, L2, N, and earth) Three-phase, 4 wires in "high leg" delta with neutral and earth Three-phase, 4 wires in open "high leg"...
- Page 30 Distribution system Electrical diagram Network Three-phase, 3 wires in star Three-phase, 3 wires (L1, L2, and L3) Three-phase, 3 wires in delta Three-phase, 3 wires in open delta For three-phase, 3 wires, indicate which current sensors will be connected: all 3 sensors (3A) or only 2 (A1 and A2, or A2 and A3, or A3 and A1).
- Page 31 Distribution system Electrical diagram Network Three-phase, 4 wires with neutral, without earth Three-phase, 4 wires (L1, L2, L3, and N) Three-phase, 4 wires in open "high leg" delta with neutral, without earth Indicate which voltages will be connected: all 3 voltages (3V) or only 2 (V1V2, V2V3 or V3V1).
- Page 32 3.4.3. SENSORS AND RATIOS To choose the voltage ratios, the current sensor ratios, and the range of the sensor, select Figure 34 3.4.3.1. VOLTAGE RATIO Voltage ratios are used when the voltages to be measured are too high for the instrument and voltage transformers are used to lower them.
- Page 33 Current ratios are used when the currents to be measured are too high for the instrument and current transformers are used to lower them. The ratio lets you display the true current and use it in the calculations. „ 4A: all channels have the same ratio, to be programmed. „...
- Page 34 is used to define, for repeated use (mode „ the duration of the recording, „ the configuration, from among the 4 possible, „ the recording period, between 200ms and 2h, „ the name of the records. Figure 37 3.4.5. TRANSIENT MODE is used to record voltage or current transients for a specified duration.
- Page 35 3.4.5.3. SHOCK WAVE THRESHOLDS To configure the voltage thresholds of shock waves with respect to earth, select „ 4VE all of the voltage inputs have the same threshold, to be programmed. : all of the voltage inputs have the same threshold; the neutral has a different threshold. „...
- Page 36 There are 40 possible alarms. For each of them you must specify: „ The quantity to be monitored from among the following quantities: „ Hz, „ Urms, Vrms, Arms, „ |Udc|, |Vdc|, |Adc|, „ |Upk+|, |Vpk+|, |Apk+|, |Upk-|, |Vpk-|, |Apk-|, „...
- Page 37 Select to specify the energy calculation parameters: „ the unit of energy: „ Wh: watt-hour „ Joule „ toe (nuclear): ton of nuclear oil equivalent „ toe (non-nuclear): ton of non-nuclear oil equivalent „ BTU: British Thermal Unit „ the currency ($, €, £, etc), Use the €$£...
- Page 38 3.4.10. FLAGGING Flagging is configured using the PAT3 application software (see § 16). Flagging concerns: „ voltage dips, „ temporary overvoltages at industrial frequency, „ and interruptions. All quantities that depend on the voltage are then reported because they have been calculated from a doubtful quantity. serves to prevent counting a single event several times in different forms.
-
Page 39: Users
4. USERS 4.1. STARTING UP To switch the instrument on, press the button. The home screen is displayed. Figure 44 Then the Waveform screen is displayed. Figure 45 4.2. NAVIGATION To navigate in the various menus of the instrument, you can use: „... - Page 40 4.2.2. TOUCH SCREEN opens the following screen: Figure 46 You can then access all functions of the instrument without using the keys. 4.2.3. REMOTE USER INTERFACE Remote navigation is possible from a PC, a tablet, or a smartphone. You can then control the instrument remotely. From a PC via an Ethernet link „...
- Page 41 Enter the IP address of your instrument in a browser. The remote browser (VNC) is activated. Figure 47 In the left-hand tab, „ click on Fullscreen to adjust the size of the display window on your screen. „ click on Settings then check Shared Mode to control the instrument, or View Only just to see the screen of the instrument. Figure 48 „...
-
Page 42: Configuration
4.3. CONFIGURATION Refer to the preceding paragraph to configure your instrument. Before making any measurement, remember to specify: „ the connection (§ 3.4.2), „ the current sensors used and the voltage and current ratios (§ 3.4.3), „ the calculation method, if necessary (§ 3.4.1). For the recording modes, remember to specify: „... - Page 43 4.4.3. THREE-PHASE NETWORK For three-phase, 3 wires, indicate which current sensors will be connected: all 3 sensors (3A) or only 2 (A1 and A2, or A2 and A3, or A3 and A1). Figure 54 Figure 55 Figure 56 For three-phase 4 and 5 wires, indicate which voltages will be connected: all 3 voltages (3V) or only 2 (V1 and V2, or V2 and V3, or V3 and V1).
-
Page 44: Functions Of The Instrument
4.5. FUNCTIONS OF THE INSTRUMENT 4.5.1. MEASUREMENTS Make sure that you have correctly configured the instrument for the measurements you want to make. You can then make one or more of the following measurements: „ View the waveforms of a signal „... -
Page 45: Safety Status Of The Instrument
4.7. SAFETY STATUS OF THE INSTRUMENT If there is an overload on the inputs, the instrument changes to safety status; a red line under the status bar reports this event. Figure 57 This line indicates that the sum of all voltage inputs exceeds 1450 Vcrest. This condition is not reached with signals ranging up to 1000 Vrms. -
Page 46: Form Of The Signal
5. FORM OF THE SIGNAL The waveform mode is used to display voltage and current curves, and values measured and calculated from the voltages and currents (except for harmonics, powers, and energies). This is the screen that appears when the instrument is powered up. Cursor. - Page 47 symbol near the channel number indicates that the voltage and all quantities that depend on it are doubtful. The associat- ed current channel and the associated combined voltages are also flagged. For example, if V1 is marked, then A1, U1 and U3 will be also marked.
-
Page 48: Thd Function
L3 display filter Displays the instantaneous voltage and current curves of phase 3 and their RMS values. There are 3 curves each time, often superimposed: the maximum curve, the nominal curve, and the minimum curve. Cursor. Maximum and minimum voltages and currents. Values at the position of the cursor: „... -
Page 49: Summary Function
4V display filter Displays the extreme values of the phase-to-neutral voltages. Figure 64 4A display filter Displays the extreme values of the currents. Figure 65 L1 display filter Displays the extreme values of the voltage and current of phase 1. Figure 66 The L2, L3 and N display filters are similar but concern phase 2, phase 3, and the neutral.The L1, L2, and N display filters are similar but concern phase 1, phase 2, and the neutral. - Page 50 „ for currents: „ the RMS value, „ the DC component, „ the total harmonic distortion referred to the RMS value of the fundamental (THD %f) , „ the total harmonic distortion referred to the RMS value without DC (THD %r) , „...
-
Page 51: Fresnel Function
L2 display filter Displays the voltage and current data of phase 2. Figure 69 The L1, L3 and N display filters are similar but concern phase 1, phase 3, and the neutral. 5.7. FRESNEL FUNCTION function displays: „ the Fresnel diagram of the signals, „... - Page 52 4A display filter Displays the Fresnel diagram of the currents and of the phase-to-neutral voltages. A1 is reference. The choice of current or voltage as reference can be changed in the configuration (see § 3.4.1)). Reverse unbalance. Zero sequence unbalance. Figure 72 L3 display filter Displays the Fresnel diagram of the voltage and of the current of phase 3.
-
Page 53: Harmonic
6. HARMONIC The voltages and currents can be analysed as sum of sine waves at the network frequency and multiples thereof. Each multiple is a harmonic of the signal. It is characterized by its frequency, its amplitude, and its phase difference with respect to the fundamental frequency (network frequency). -
Page 54: Display Filter
The calculation of the harmonics starts when the instrument is switched on. To reset the values, press the key. 6.1. DISPLAY FILTER The display filter depends on the connection chosen: Display filter for V Display filter for A Display filter for U Display filter for MSV Connection Single-phase, 2 wires L1 (no choice) - Page 55 U function with the L1 display filter Information about harmonic number 5 (pointed to by the cursor). Figure 77 function with the L2 display filter U and Information about inter-harmonics i04 (pointed to by the cursor) between harmonics 4 and 5. Figure 78 To exit from the function , press the...
- Page 56 MSV-U curve function with the L1 display filter Envelope of the curve. What is above the envelope is not correct. Refer to § 3.4.1 to parameterize this envelope. Value at the position of the cursor. Figure 80 To exit from the MSV function, press the MSV key again.
-
Page 57: Power
7. POWER The power mode displays power measurements W and power factor calculations PF. 7.1. DISPLAY FILTER The display filter depends on the connection chosen: Display filter Connection Single-phase, 2 wires Single-phase, 3 wires L1 (no choice) Two-phase, 2 wires Two-phase, 3 wires 2L, L1, L2, Σ... - Page 58 L1 display filter Figure 83 Σ display filter Sum of the powers in the 3 channels. Figure 84...
-
Page 59: Energy
8. ENERGY The energy mode is used to meter energy, both generated and consumed, over a period of time, and indicate the correspond- ing price. Display filter. Figure 85 : to access the energy configuration. For it to be possible to change the configuration, there must not be any metering in progress or suspended. It is first necessary to reset the zero. - Page 60 Wh function with the 3L display filter Indication that energy metering Starting date and time is in progress. of the metering and possibly ending date and time. Energy consumed. Figure 86 Wh function with the L1 display filter : active energy. Indication that energy metering : DC energy (if a DC current is suspended.
-
Page 61: Trend Mode
(see § 3.4.4) for a specified duration. The trend mode The CA 8345 can record a large number of trends, limited only by the capacity of the SD card. The home screen displays a list of the recordings already made. For the moment, there are none. -
Page 62: List Of Recordings
Recording is in progress. Progress of the recording. Figure 92 To ensure compliance with IEC 61000-4-30, it is essential that trend recordings are performed with : „ A measurement of the frequency over 10 seconds, „ Vrms, Urms and Arms selected. 9.2. - Page 63 Below are examples of screens for a three-phase, 5-wire connection. To change the display filter, use the ▲ ▼ keys. The cursor lets you view the values along the curves displayed. To move the cursor, use the ◄ ► keys. : to stretch or shrink the time scale.
- Page 64 Phase-to-neutral voltages (Vrms) for an L1 display filter and Position of the display window in the recording. Figure 97 Active power (P) for a display filter Σ The power, like the energy, is displayed in barchart form. The duration of a bar is 1 second, or one recording period if it is longer than 1s. To display the active energy (E Figure 98 Cumulative active energy (E...
-
Page 65: Transient Mode
(see § 3.4.5). It also serves to record shock waves: very high voltages for a very short time. The CA 8345 can record a large number of transients. This number is limited only by the capacity of the SD card. -
Page 66: List Of Recordings
Progress of the recording. Recording is in progress. Figure 104 10.2. LIST OF RECORDINGS Press to view the recordings made. Name, starting date and time, ending date and time of the recording. To erase the selected recording. To view the different pages. Figure 105 If the ending date is shown in red, it is because recording could not continue up to the planned ending date. - Page 67 Confirm by pressing the key again. Only the transients triggered by an event on the L1 phase are displayed. The display filter is active. Figure 107 To display a transient, select it and press the confirm key Below are examples of screens for a three-phase, 5-wire connection. The cursor lets you view the values along the curves displayed.
- Page 68 Shock wave in all of the voltage channels If you have recorded a shock wave, it will appear when the record is read. Only shock waves in phase L1 are displayed. The display filter is active. Figure 110 To display the recording of the shock wave, select it and press the confirm key This screen displays the whole of the captured signal for a duration of 1.024 s.
-
Page 69: Inrush Current Mode
(see § 3.4.6). The CA 8345 can record a large number of inrush current captures. This number is limited only by the capacity of the SD card. The home screen displays a list of the captures already made. For the moment, there are none. -
Page 70: List Of Captures
Progress of the capture. The capture is in progress. As soon as a current exceeds the programmed threshold, the recording of the capture starts. Figure 116 11.2. LIST OF CAPTURES Press to view the captures performed. Name, starting date and time, ending date and time of the capture. - Page 71 Press the confirm key again to display the information about the capture. To display the RMS curves. To display the instantaneous value curves according to the configuration. Figure 119 Below are examples of screens for a three-phase, 5-wire connection. 11.3.1. RMS VALUES Press the RMS key to view the RMS voltage and current values.
- Page 72 Capture of RMS inrush current on L2 , and keys are used to place the cursor on the minimum or maximum voltage or current. Figure 121 11.3.2. INSTANTANEOUS VALUES Press the WAVE key to view the instantaneous voltage and current values. This recording displays all of the samples.
- Page 73 Capture of instantaneous inrush current values on L3 Figure 123...
-
Page 74: Alarm Mode
The alarm mode duration. The CA 8345 can record a large number of alarm campaigns (limited only by the capacity of the SD card), each containing up to 20,000 alarms. You can choose this maximum number in the configuration. The home screen displays a list of the alarm campaigns already performed. For the moment, there are none. -
Page 75: List Of Alarm Campaigns
Press . The alarm campaign will start at the programmed time. indicates that the alarm campaign has been programmed but has not yet started. indicates that it is in progress. indicates that it is suspended. To suspend the alarm campaign in progress. -
Page 76: Start Of An Alarm Campaign
12.3. START OF AN ALARM CAMPAIGN Select the alarm campaign to be read in the list and press the confirm key to open it. Below is an example of a screen. Beginning of the alarm. Duration of the alarm. Display filter. Quantities that crossed the programmed alarm threshold(s). -
Page 77: Monitoring Mode
A monitoring campaign therefore triggers a trend recording, a search for transients, an alarm campaign, and a log of events. The CA 8345 can record a large number of monitoring campaigns. This number is limited only by the capacity of the SD card. - Page 78 The configuration window opens. Figure 132 It has 5 tabs: „ Monitoring „ Threshold of slow variations „ Rapid voltage changes and interruptions „ Voltage dips and overvoltages „ Transients In the Monitoring tab, indicate the nominal voltage, the frequency, and the name of the file that will contain the monitoring campaign. In the Threshold of slow variations tab, the maximum variations of the frequency and of the voltages are already specified, as per the standard, for a duration of one week and for the duration of the monitoring campaign.
-
Page 79: List Of Monitoring Campaigns
Press . The monitoring will start at the programmed time if there is enough space on the SD card. indicates that recording has been programmed but not yet started. indicates that it is in progress. indicates that it is suspended. To suspend the recording in progress. -
Page 80: Reading A Monitoring Campaigns
13.3. READING A MONITORING CAMPAIGNS Select the analysis to be read in the list and press the confirm key to open it. Below is an example of a screen. To view the recording of a trend. Name, starting and ending dates of the analysis. -
Page 81: Screenshot
14. SCREENSHOT key is used to make screenshots and to view the recorded screenshots. Screenshots are recorded on the SD card in directory 8345\Photograph. They can also be read on the PC using the PAT3 software or using an SD card reader (not provided). 14.1. - Page 82 14.2.1. DISPLAY OF A SCREENSHOT To display a screenshot, select it and press the confirm key . The instrument displays the available photograph(s). Figure 139 Select a screenshot and confirm The mode icon blinks in alternation with To view the different screenshots that make up the photograph.
-
Page 83: Help
15. HELP key gives you access to information about the functions of the keys and the symbols used for the display mode in pro- gress. Here's an example of a help screen in the power mode: Reminder of the mode. There are 3 help pages. -
Page 84: Application Software
16. APPLICATION SOFTWARE The PAT3 (Power Analyser Transfer 3) application software is used to: „ configure the instrument and the measurements, „ start the measurements, „ transfer the data recorded in the instrument to a PC. PAT3 can also be used to export the configuration to a file and to import a configuration file. 16.1. -
Page 85: Technical Characteristics
17. TECHNICAL CHARACTERISTICS The device CA 8345 is compliant with standard IEC 61000-4-30 class A. 17.1. REFERENCE CONDITIONS Quantity of influence Reference conditions Ambient temperature 23 ± 3°C Relative humidity 40 to 75% RH Atmospheric pressure 860 to 1060 hPa Environmental <... -
Page 86: Electrical Characteristics
Nominal current A depending on the sensor Nominal RMS current Full-scale commercial Full-scale technical RMS Current sensor per class A (A) (2) RMS per class A (A) (3) 14.14 to 16.97 30 A ® ® AmpFlex A193 and MiniFlex MA194 1000 141.42 to 169.71 300 A... - Page 87 17.2.3. PASS BAND AND SAMPLE S/s: sample per second Spc: sample per cycle The pass band and the sample (S = sample) are: „ 88 kHz and 400 kS/s for the voltage channels „ 20 kHz and 200 kS/s for the current channels „...
- Page 88 17.2.4. CHARACTERISTICS OF THE INSTRUMENT ALONE (WITHOUT CURRENT SENSOR) 17.2.4.1. CURRENTS AND VOLTAGES Measurement range without ratio Maximum intrinsic Display resolution Measurement (with unity ratio) (with unity ratio) error Minimum Maximum Frequency 42.50 Hz 69.00 Hz 10 mHz ±10 mHz 5.000 V 9,999 V 4 digits...
- Page 89 Measurement range without ratio Maximum intrinsic Display resolution Measurement (with unity ratio) (with unity ratio) error Minimum Maximum 3.000 A 164.9 A 4 digits ±(0.5% + 200 mA) J93 clamp 165.0 A 1980 A 4 digits ±0.5 % 1981 A 3500 A 4 digits ±(0.5% + 1 A)
- Page 90 Measurement range without ratio Maximum intrinsic Display resolution Measurement (with unity ratio) (with unity ratio) error Minimum Maximum J93 clamp 1.000 A 3500 A 4 digits ±(1% + 1 A) C193 clamp 1.000 A 1000 A 4 digits ±(1% + 1 A) PAC93 clamp MN93 clamp 200.0 mA...
- Page 91 17.2.4.2. POWER AND ENERGY Measurement range without ratio Maximum intrinsic Display resolution Measurement (with unity ratio) (11) error (with unity ratio) Minimum Maximum ±(1% + 10 pt) |cos φ| ≥ 0,8 ® Without Flex 1.000 W 10.00 MW 4 digits ±(1.5% + 10 pt) 0,2 ≤...
- Page 92 17.2.4.3. QUANTITIES ASSOCIATED WITH POWER VALUES Measurement range Maximum intrinsic Measurement Display resolution Minimum Maximum error Fundamental phase differences -179° 180° 0.1° ±2° cos φ (DPF, PF 4 digits ±5 pt tan φ -32.77 32.77 4 digits ±1° if THD < 50% ≤...
- Page 93 17.2.4.4. HARMONICS Measurement range Maximum intrinsic Measurement Display resolution Minimum Maximum error 0.1% τ < 1000 % 1500%f (τ Harmonic level of voltage ±(2.5% + 5 pt) 100%r τ ≥ 1000 % 0.1% ±(2 % + (n × 0.2 %) + 10 pt) τ...
- Page 94 Measurement range Maximum intrinsic Display resolution Measurement (with unity ratio) (with unity ratio) error Minimum Maximum 4 digits phase-to-neutral 1000 V ±(2.5% + 1 V) 4 digits voltage of harmonic 4 digits (order n ≥ 2) phase-to-phase 2000 V ±(2.5% + 1 V) 4 digits 4 digits phase-to-neutral (Vd)
- Page 95 1: Provided that the voltages between the individual terminals and earth do not exceed 1000 Vrms. 2: RMS value of the fundamental. 3: n is the highest order of which the harmonic level is not zero. 17.2.4.5. CURRENT AND VOLTAGE RATIOS Minimum Maximum Ratio...
- Page 96 17.2.5. CHARACTERISTICS OF THE CURRENT SENSORS The measurement error on the RMS current and the phase error must be added to the errors of the instrument in the case of measurements that use the current measurements: powers, energies, power factors, tangents, etc. Maximum error on φ...
-
Page 97: Memory Card
The uncertainty of the real-time clock is at most 80 ppm (instrument 3 years old used at an ambient temperature of 50°C). With a new instrument used at 25°C, this uncertainty is no more than 30 ppm. 17.3. MEMORY CARD The CA 8345 is delivered with a 16GB CD card. Depending on their capacities, SD cards can store: 2 GB... -
Page 98: Power Supply
If the instrument will be left unused for an extended period, remove the battery (see § 18.3). 17.4.2. EXTERNAL POWER SUPPLY: The CA 8345 can be connected to an external supply to save or recharge the battery. It can operate while being charged. There are two chargers. -
Page 99: Display Unit
17.4.3. BATTERY LIFE The typical consumption of the instrument is 750 mA. This includes the display, the SD card, GPS, the Ethernet link, wifi, and supplying the current sensors when necessary. Battery life between charges is approximately 6 hours when the battery is fully charged and the screen is on. If the screen is off, battery life between charges is approximately 10 hours. -
Page 100: Compliance With International Standards
All of the measurement methods, the measurement uncertainties, the measurement ranges, the aggregations of measurements, the flagging, and the markings are compliant with the requirements of IEC 61000-4-30, edition 3.0, for instruments of class A. The CA 8345 therefore performs the following measurements: „ Measurement of industrial frequency over 10 s, „... - Page 101 17.8.3. MEASUREMENT UNCERTAINTIES AND RANGES Range of quantity Parameter Measurement range Uncertainty of influence ∈[100 V; 400 V] (V) 50 Hz network 42.5 to 57.5 Hz Industrial frequency ± 10 mHz ∈[200 V; 1000 V] (U) 60 Hz network 51 to 69 Hz ∈[100 V;...
-
Page 102: Electromagnetic Compatibility (Emc)
17.9. ELECTROMAGNETIC COMPATIBILITY (EMC) The instrument is in compliance with the requirements of standard IEC/ EN 61326-1 or BS EN 61326-1. „ The instrument is intended for use in an industrial environment. „ The instrument is a class A product. „... -
Page 103: Maintenance
18. MAINTENANCE Except for the batteries, the instrument contains no parts that can be replaced by personnel who have not been specially trained and accredited. Any unapproved work or replacement of any part by equivalents may gravely compromise safety. The servicing and maintenance instructions must be provided to the responsible authority. 18.1. - Page 104 Prop. Battery. Battery release recess. Notches. Figure 148 1. Disconnect anything connected to the instrument. 2. Turn the instrument over and insert a flat-head screwdriver in the battery release recess. 3. Push down on the screwdriver to release the battery. Figure 149...
-
Page 105: Memory Card
Figure 150 4. Use the notches to extract the battery from its compartment. Old batteries must not be treated as household wastes. Take them to the appropriate collection point for recycling. In the absence of a battery, the internal clock of the instrument continues to operate for at least 17 hours. 5. -
Page 106: Updating The Firmware
18.5. UPDATING THE FIRMWARE With a view to providing the best possible service in terms of performance and technical upgrades, Chauvin Arnoux enables you to update the software incorporated in this instrument by a free download of the new version, available on our web site. - Page 107 You can perform the update in several ways: „ Connect the instrument to your PC to an Ethernet network having access to Internet using an Ethernet cord. „ Copy the update file to a USB drive, then insert the drive in its port in the instrument. „...
-
Page 108: Warranty
19. WARRANTY Except as otherwise stated, our warranty is valid for 36 months starting from the date on which the equipment was sold. The extract from our General Conditions of Sale is available on our website. www.group.chauvin-arnoux.com/en/general-terms-of-sale The warranty does not apply in the following cases: „... -
Page 109: Appendices
20. APPENDICES This section presents the formulas used for the calculation of the different parameters. The formulas are compliant with standard IEC 61000-4-30, edition 3.0, for class A instruments and with IEEE 1459, 2010 edition, for the power formulas. 20.1. NOTATION Notation Description Represents V, U or I. - Page 110 20.2.4. LEVELS OF HARMONICS AND INTERHARMONICS The quantities are calculated in accordance with standard IEC 61000-4-7, edition 2.0 A1, § 5.6. Level of harmonics referred to the RMS value of the fundamental (%f): Level of harmonics referred to the RMS value without DC (%r): Level of interharmonics referred to the RMS value of the fundamental (%f): Level of interharmonics referred to the RMS value without DC (%r): 20.2.5.
- Page 111 20.2.7. LEVEL OF HARMONIC GROUP DISTORTION The quantities are calculated in accordance with standard IEC 61000-4-7 A1, edition 2.0, § 3.3.2. 20.2.8. DISTORTION 20.2.9. K FACTOR AND HARMONIC LOSS FACTOR These quantities concern only the current and are calculated in accordance with standard IEEE C57.110, 2004 edition, § B.1 and §...
- Page 112 20.2.12. ACTIVE POWER (P) Quantity calculated in accordance with standard IEEE 1459, 2010 edition, § 3.1.2.3. Active power, per phase: With V (n) and I (n) = instantaneous values of the V or I sample having index n in channel L. Total active power: 20.2.13.
- Page 113 20.2.17. APPARENT POWER (S) Quantity calculated in accordance with standard IEEE 1459, 2010 edition, § 3.1.2.7. Apparent power, per phase: With V and I : RMS voltage and current of channel L. Total apparent power: 20.2.18. NON-ACTIVE POWER (N) Quantity calculated in accordance with standard IEEE 1459, 2010 edition, § 3.1.2.14. Non-active power, per phase: Total non-active power: 20.2.19.
-
Page 114: Flicker
To accurately reflect the effects on vision, the measurement must be made over a long enough time (10 minutes or 2 hours). That said, flicker can vary considerably in a short time, since it depends on connections and disconnections to the network. The CA 8345 therefore measures: „ instantaneous flicker Pinst, The value displayed is max(Pinst) on a 150/180-cycle aggregation. -
Page 115: Minimum Scale Values Of Waveforms And Minimum Rms Values
20.5.2. DETECTION OF DIP OR OF INTERRUPTION For a hysteresis of 2% for example, the reset point in the context of dip detection will be (100% + 2%), or 102% of the threshold voltage. Duration Reset point Threshold Minimum Figure 154 20.6. -
Page 116: Four-Quadrant Diagram
20.7. FOUR-QUADRANT DIAGRAM This diagram is used for power and energy measurements (see § 7 and 8). Generated Consumed Figure 155 20.8. TRANSIENT CAPTURE TRIGGERING MECHANISM When a search for transients is started, each sample is compared to the sample from the previous cycle. In standard IEC 61000-4- 30, this monitoring method is called the "moving window method". -
Page 117: Conditions Of Capture In Inrush Current Mode
20.9. CONDITIONS OF CAPTURE IN INRUSH CURRENT MODE The capture is determined by a triggering event and a stop event. A capture stops automatically in one of the following cases: „ the stop event occurs, „ the recording memory is full, „... -
Page 118: Glossary
20.10. GLOSSARY AC and DC components. AC component only. DC component only. Inductive phase shift. Capacitive phase shift. ° Degree. Expert mode. Absolute values. φ Phase difference of the phase-to-earth voltage (phase voltage) with respect to the phase-to-earth current (line cur- rent). - Page 119 Active energy. Non-active energy. Apparent energy. K factor calculated per IEEE C57.110. Downgrading of the transformer as a function of harmonics.. Harmonic loss factor (FHL) This is used to quantify losses due to harmonics in transformers. visual effect produced by voltage variations. Flicker Frequency number of complete voltage or current cycles produced in one second.
- Page 120 Inverse phase-to-earth voltage unbalance if the neutral is connected, otherwise phase-to-phase voltage. Phase-to-phase voltage between phases 1 and 2. U2 = U Phase-to-phase voltage between phases 2 and 3. Phase-to-phase voltage between phases 3 and 1. Harmonics in phase-to-phase voltage. Declared supply voltage, normally Uc = Un.
-
Page 121: Abbreviations
Phase-to-earth voltage on the neutral. Channel and phase: a measurement channel corresponds to a difference of potential between two conductors. A phase corre- sponds to a single conductor. In polyphase systems, a measurement channel can be between two phases, between a phase and the neutral, between a phase and the earth, or between the neutral and the earth. - Page 122 FRANCE INTERNATIONAL Chauvin Arnoux Chauvin Arnoux 12-16 rue Sarah Bernhardt Tél : +33 1 44 85 44 38 92600 Asnières-sur-Seine Fax : +33 1 46 27 95 69 Tél : +33 1 44 85 44 85 Fax : +33 1 46 27 73 89 Our international contacts info@chauvin-arnoux.com...
Need help?
Do you have a question about the CA 8345 and is the answer not in the manual?
Questions and answers