
Subscribe to Our Youtube Channel
Related Manuals for Chauvin Arnoux C.A 8335


Summary of Contents for Chauvin Arnoux C.A 8335
- Page 1 c . A 8 3 3 5 QUALI THREE-PHASE ELEcTRIcAL STAR N E T w o R k S A N A LY S E R User’s manual E N G L I S H...
- Page 2 Thank you for purchasing a c.A 8335 three-phase electrical networks analyser (Qualistar+). To obtain the best service from your unit: „ read these operating instructions carefully, „ comply with the precautions for use. WARNING, risk of DANGER! The operator must refer to these instructions whenever this danger symbol appears.
-
Page 3: Table Of Contents
6.2. Current ..............45 18. wARRANTY ..............114 6.3. Apparent power ...........46 19. To oRDER ..............115 6.4. Phase-to-phase voltage ........47 19.1. C.A 8335 three-phase electrical networks 6.5. Expert mode ............48 analyser ............115 7. wAvEfoRm..............50 19.2. Accessories .............115 7.1. Measurement of true RMS value ......50 19.3. -
Page 4: Getting Started
1. GETTING STARTED 1.1. UNPAckING Œ Ž FICHE DE SÉCURITÉ DU C.A 6116 (FR) Vous venez d’acquérir un contrôleur d’installation C.A 6116 et nous vous remercions de votre confiance. Pour obtenir le meilleur service de votre appareil : lisez attentivement cette notice de fonctionnement, ... -
Page 5: Charging The Battery
1.2. cHARGING THE bATTERY Before the first use, start by fully charging the battery. 120 V ± 10 %, 60 Hz 230 V ± 10 %, 50 Hz Remove the cover from the receptacle and connect the plug of the specific power supply unit to the device. Connect the mains cord to the power supply unit and to mains. -
Page 6: Description Of The Device
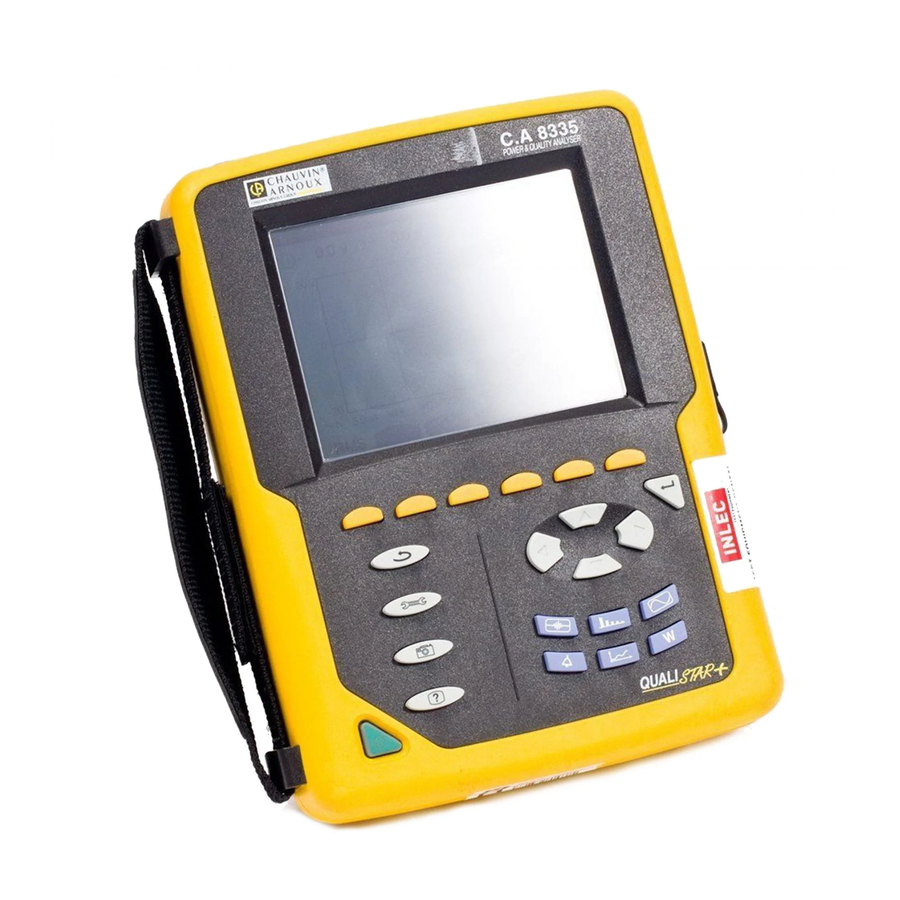
The device is compact and impact resistant. The ergonomics and simplicity of its interface make using it pleasant. The C.A 8335 is intended for the technicians and engineers of electrical installation and network inspection and maintenance teams. 2.1.1. mEASUREmENT fUNcTIoNS The principal measurements made are: „... - Page 7 2.1.2. DISPLAY fUNcTIoNS „ Display of waveforms (voltages and currents). „ Inrush Current function: displays parameters useful for study of the starting of a motor. Instantaneous current and voltage at the instant designated by the cursor. „ Maximum instantaneous absolute value of the current and of the voltage (over the entire starting time). „...
-
Page 8: Overall View
2.2. ovERALL vIEw Measurement connection terminals (see §2.6.1) Display (see §2.4) USB socket (see §2.6.2) Function keys (yellow keys) (see §2.5.1) C o n n e c t o r f o r t h e mains power unit/bat- Return /previous key tery charger (see §2.5.2) (see §2.6.2) -
Page 9: Display
2.4. DISPLAY 2.4.1. PRESENTATIoN The backlit 320x240 (1/4 VGA) pixel graphic liquid crystal screen displays all measurements with their curves, the parameters of the unit, the curves selected, the instantaneous values of the signals, and the type of measurement selected. When the device is powered up, it automatically displays the Waveform screen. -
Page 10: Keypad Keys
Icons Designation Icons Designation Display of mean values and extrema. Select all items. Move the cursor to the first occurrence of the Unselect all items. maximum phase-to-neutral voltage. Transient mode. Move the cursor to the first occurrence of the minimum phase-to-neutral voltage. Inrush current mode. - Page 11 2.5.3. moDE kEYS (vIoLET kEYS) These give access to specific modes: Item function Waveform acquisition mode, with two sub-modes: transients mode (blackouts, interference, § 5 etc.) and inrush current mode (starting of motor). Harmonic curves display mode: representation of voltage, current, and power harmonics, order §...
-
Page 12: Connectors
2.6. coNNEcToRS 2.6.1. coNNEcTIoN TERmINALS Located on the top of the device, these connectors are distributed as follows: 4 current input terminals for current sensors (MN clamp, C 5 voltage input terminals. clamp, AmpFLEX™, PAC clamp, E3N clamp, etc.). Figure 3: the connection terminals 2.6.2. -
Page 13: The Stand
2.8. THE STAND A retractable stand on the back of the Qualistar+ can be used to hold the device in a tilted position. Metal ring. It is used to secure the device with padlock. Retractable stand. Battery. Figure 5: stand and battery compartment cover 2.9. - Page 14 Meanings of the symbols and abbreviations used: Symbol Designation Symbol Designation AC and DC components. True RMS value (current or voltage). AC component only. Relative date of time cursor. DC component only. tan Φ Tangent of the phase shift of voltage with respect to current.
-
Page 15: Use
3. USE 3.1. START-UP To switch the device on, press the button. It lights when pressed, then goes off if the mains power unit is not connected to the device. After the software check, the home page is displayed and indicates the software version of the device and its serial number. Figure 6: Home page at start-up Then the Waveform screen is displayed. -
Page 16: Installation Of Leads
The following points must be checked or adapted for each measurement: „ Define the parameters of the calculation methods (see §4.5). „ Select the distribution system (single-phase to five-wire three-phase) and the connection method (2 wattmeters, 2 ½ elements, standard) (see §4.6). „... - Page 17 To make a measurement, you must program at least: „ the calculation method (see §4.5), „ the connection (see §4.6) „ and the ratios of the sensors (see §4.7). The measuring leads must be connected to the circuit to be measured as shown by the following diagrams. 3.3.1.
-
Page 18: Functions Of The Device
3.3.4. coNNEcTIoN PRocEDURE „ Switch the instrument on. „ Configure the device for the measurement to be made and the type of network concerned (see §4), „ Connect the leads and current sensors to the unit. „ Connect the earth and/or neutral lead to the network earth and/or neutral (when it is distributed) and connect the correspond- ing current sensor, „... -
Page 19: Configuration
4. coNfIGURATIoN The Configuration key is used to configure the device. This must be done before each new type of measurement. The con- figuration remains in memory, even after the device is switched off. 4.1. coNfIGURATIoN mENU The arrow keys (,, , ) are used to navigate in the Configuration menu and to parameterize the device. A value that can be modified is flanked by arrows. -
Page 20: Display
4.4. DISPLAY 4.4.1. coNTRAST/bRIGHTNESS menu is used to define the contrast and brightness of the display unit. The display is as follows: Figure 18: the Contrast/Brightness menu Use the arrow keys (,, , ) to change the contrast and brightness. To return to the Configuration menu, press 4.4.2. -
Page 21: Calculation Methods
The Automatic mode is used to save the battery. The display screen is switched off automatically after five minutes without action on the keys if the device is powered only by its battery and if recording is in progress. The On/Off button blinks to indicate that the device is still in operation. - Page 22 4.5.2. cHoIcE of UNIT of ENERGY The wh menu defines the unit of display of energies. Figure 21: the Choice of Unit of Energy menu Use the arrow keys (,) to select the unit: „ Wh: Watt-hour. „ Joule. „ nuclear toe: nuclear tonne oil equivalent. „...
- Page 23 4.5.4. cHoIcE of REfERENcE of THE LEvEL of HARmoNIcS of THE PHASES The %f-%r menu defines the reference for the level of harmonics of the phases. Figure 23: the Choice of Reference for the Level of Harmonics menu Use the arrow keys (,) to fix the reference for the level of harmonics: „...
-
Page 24: Connection
4.6. coNNEcTIoN menu is used to define how the device is connected, according to distribution system. Figure 16: the Connection menu Several electrical diagrams can be selected: Use the arrow keys (,, , ) to choose a connection. One or more types of network correspond to each distribution system. Distribution system Source Single-phase 2-wire (L1 and N) - Page 25 Distribution system Source Split-phase 3-wire non-earthed neutral 3-phase open star 3-wire non-earthed neutral Split-phase 3-wire (L1, L2 and 3-phase high leg delta 3-wire non-earthed neutral 3-phase open high leg delta 3-wire non-earthed neutral Split-phase 4-wire earthed neutral 3-phase open star 4-wire earthed neutral Split-phase 4-wire (L1, L2, N and earth) 3-phase high leg delta 4-wire earthed neutral...
- Page 26 Distribution system Source 3-phase star 3-wire 3-phase delta 3-wire 3-phase open delta 3-wire 3-phase 3-wire (L1, L2 and L3) 3-phase open delta 3-wire earthed junction of phases Indicate which 2 current sen- sors will be connected: A1 and A2, or A2 and A3, or A3 and A1. 3-phase open delta 3-wire earthed corner of phase 3-phase high leg delta 3-wire 3-phase open high leg delta 3-wire...
- Page 27 Distribution system Source 3-phase star 4-wire non-earthed neutral 3-phase 4-wire (L1, L2, L3 and N) 3-phase open high leg delta 4-wire non-earthed neutral Indicate which voltages will be connected: all 3 (3V) or only 2 (V1 and V2, or V2 and V3, or V3 and V1).
-
Page 28: Sensors And Ratios
4.7. SENSoRS AND RATIoS Note: The ratios cannot be changed if the device is recording, metering energy, or searching for transients, alarms, and/or inrush current acquisitions. 4.7.1. cURRENT SENSoRS AND RATIoS A first screen A is used to define the current sensors and ratios. It automatically displays the current sensor models detected by the device. -
Page 29: Capture Mode
Figure 26: the Voltage Ratios screen in the Sensors and Figure 27: the Voltage Ratios screen in the Sensors and ratios menu in the case of a set-up without neutral ratios menu in the case of a set-up with neutral Use the arrow keys (,) to choose the configuration of the ratios. - Page 30 „ 4V or 3U: all channels have the same threshold. Press the key, then use the , keys to highlight the value of the threshold in yellow. „ Press the key, then use the ,, and keys to change the threshold. The unit can be the V or the kV. „...
-
Page 31: Trend Mode
4.8.3. cURRENT THRESHoLDS of THE INRUSH cURRENT moDE A third screen, displayed by pressing the icon, is used to define the inrush current thresholds. This involves programming the triggering threshold and the inrush current capture stopping threshold (the stopping threshold being the triggering threshold less the hysteresis). - Page 32 To change configuration pages, press the key. The recordable values are: Unit Designation Urms RMS phase-to-phase voltage. RMS phase-to-neutral voltage. Upk+ Maximum peak value of phase-to-phase voltage. Upk- Minimum peak value of phase-to-phase voltage. Crest (peak) factor of phase-to-phase voltage. Uthdf Harmonic distortion of the phase-to-phase voltage with the RMS value of the fundamental as reference.
-
Page 33: Mode Alarm Mode
The four last lines involve the recording of the harmonics of U, V, A and VA. You can select a range of orders of the harmonics to be recorded (between 0 and 50) for each of these quantities, and within this range, if desired, only odd harmonics. Note: The level of harmonics of order 01 will be displayed only if they concern values expressed in % r. -
Page 34: Erase Memory
„ The type of alarm. „ The order of the harmonic (between 0 and 50), for |VA-h|, A-h, U-h and V-h only. „ The target of the alarm: 3L: 3 phases monitored individually, „ N: monitoring of neutral, „ 4L: 3 phases and neutral monitored individually, „... -
Page 35: About
4.12. AboUT About screen displays information concerning the device. Figure 36: the About menu To return to the Configuration menu, press... -
Page 36: Waveform Capture
5. wAvEfoRm cAPTURE Waveform capture mode is used to display and to capture transients and inrush currents. It contains two sub-modes: „ The transient mode (see §5.1) „ The inrush current mode (see §5.2) Figure 37: the screen of the Waveform capture mode To select a sub-mode, move the yellow cursor to it using the ... - Page 37 5.1.1. PRoGRAmmING AND STARTING A SEARcH To program a search for a transient, enter the start date and time, the stop date and time, the number of transients to search for, then the name of the search. To change an item, move the yellow cursor to it using the and keys, then validate with the key. Change the value using the ,,...
- Page 38 To select a search for transients, move the cursor to it using the and keys. The selected search is bolded. Then validate with the key. The device then displays a list of transients. Transients display filter: Triggering channel of the transient. ∀: all transients are displayed.
-
Page 39: Inrush Current Mode
5.2. INRUSH cURRENT moDE Still in the mode, the sub-mode is used to capture (record) inrush currents (voltage and current waveforms, network frequency, half-cycle RMS voltages and currents except for the neutral) and to view and delete the recordings. When the Inrush current mode is invoked: „... - Page 40 5.2.2. DISPLAYING THE cHARAcTERISTIcS of THE cAPTURE To display the characteristics of the capture, press . The Capture parameters screen is displayed. Display in PEAK mode (see §5.2.4). Display in RMS mode (see §5.2.3). Figure 43: The Capture parameters screen If a capture duration is displayed in red, it means that it has been cut short: „...
- Page 41 5.2.3.2. The 3A RmS display screen for a three-phase connection without neutral Figure 45: The 3A RMS display screen for a three-phase connection without neutral 5.2.3.3. The L1 RmS display screen for a three-phase connection with neutral mAx: maximum half-cycle RMS Time cursor of the curve.
- Page 42 5.2.4. INSTANTANEoUS INRUSH cURRENT The PEAk mode is used to display the envelopes and waveforms of the inrush current capture. The PEAK display of an inrush current capture provides two possible representations: „ envelope „ waveform. The change from one of these representations to the other is automatic, as a function of the zoom level. If the zoom in is high enough, the representation is of the “waveform”...
- Page 43 5.2.4.3. The A1 PEAk display screen for a three-phase connection without neutral In the case shown, there is enough zoom out to force the envelope type of representation. Time cursor of the curve. Use the mAx |PEAk|: maximum instanta- or ...
-
Page 44: Harmonic
6. HARmoNIc The Harmonic mode displays a representation of the harmonic levels of the voltage, current, and apparent power, order by order. It can be used to determine the harmonic currents produced by nonlinear loads and analyze problems caused by harmon- ics according to their order (overheating of neutrals, conductors, motors, etc.). -
Page 45: Current
6.1.2. THE L1 PHASE voLTAGE HARmoNIcS DISPLAY ScREEN This information concerns the har- Display of the 3 phases 3L, of L1, L2, monic pointed to by the cursor. L3, N, or of the expert mode (three- v-h03: harmonic number. phase connection only - see §6.5). %: level of harmonics with the fun- To select the display press ... -
Page 46: Apparent Power
6.2.2. THE L1 cURRENT HARmoNIcS DISPLAY ScREEN Display of the 3 phases 3L, of L1, L2, This information concerns the har- L3, N, or of the expert mode (three- monic pointed to by the cursor. phase connection only - see §6.5). A-h05: harmonic number. -
Page 47: Phase-To-Phase Voltage
6.3.2. THE L1 APPARENT PowER HARmoNIcS DISPLAY ScREEN This information concerns the har- monic pointed to by the cursor. Display of the 3 phases 3L, of L1, vA-h03: harmonic number. L2 or L3. To select the display press %: level of harmonics with the the ... -
Page 48: Expert Mode
6.4.2. THE L1 PHASE-To-PHASE voLTAGE HARmoNIcS DISPLAY ScREEN This information concerns the har- monic pointed to by the cursor. Uh 03: harmonic number. Display of the 3 phases 3L, of L1, %: level of harmonics with the fun- L2 or L3. To select the display press damental RMS value as reference ... - Page 49 6.5.2. THE cURRENT ExPERT moDE DISPLAY ScREEN The A sub-menu displays the influence of the harmonics of the current on the heating of the neutral and on rotating machines. Harmonics inducing a negative Harmonics inducing a positive se- sequence. quence. Harmonics inducing a zero se- quence.
-
Page 50: Waveform
7. wAvEfoRm Waveform key is used to display the current and voltage curves, along with the values measured and those calculated from the voltages and currents (except for power, energy, and harmonics). This is the screen that appears when the device is powered up. Display of the maximum and mini- Selection of the display filters. - Page 51 7.1.1. THE 3U RmS DISPLAY ScREEN This screen displays the three phase-to-neutral voltages of a three-phase system. Instantaneous values of the signals RMS phase-to-phase voltages. at the position of the cursor. t: time relative to the start of the period. Voltage axis with automatic scaling.
-
Page 52: Measurement Of Total Harmonic Distortion
7.1.4. THE RmS DISPLAY ScREEN foR THE NEUTRAL This screen displays the neutral voltage with respect to earth and the neutral current. RMS voltage and current. Instantaneous values of the signals at the position of the cursor. Current and voltage axis with auto- t: time relative to the start of the matic scaling. -
Page 53: Measurement Of The Peak Factor
7.2.3. THE 4A THD DISPLAY ScREEN This screen displays the phase current waveforms for one period and the total harmonic distortion values. Instantaneous values of the signals Harmonic distortion for each curve. at the position of the cursor. t: time relative to the start of the period. -
Page 54: Measurement Of Extreme And Mean Voltage And Current
7.3.3. THE 4A cf DISPLAY ScREEN This screen displays the current waveforms of one period and the peak factors. Instantaneous values of the signals Peak factor for each curve. at the position of the cursor. t: time relative to the start of the period. - Page 55 7.4.2. THE 4v mAx.-mIN. DISPLAY ScREEN This screen displays the one-second mean and half-cycle maximum and minimum RMS values and the positive and negative peaks of the phase-to-neutral voltages and of the neutral. Column of values for the neutral: RMS, PEAK+ and PEAK- parameters. Columns of values for each voltage curve (1, 2 and 3).
-
Page 56: Simultaneous Display
7.4.5. THE NEUTRAL mAx.-mIN. DISPLAY ScREEN This screen displays the RMS values and the positive and negative peaks of the neutral relative to earth. The same information as for the volt- Column of voltage values. age, but for the current. RmS: true RMS voltage. - Page 57 7.5.3. 4A SImULTANEoUS DISPLAY ScREEN This screen displays the RMS, DC (only if at least one of the current sensors can measure direct current), THD, CF, FHL and FK values of the phase and neutral currents. Columns of current values (phases 1, 2 and 3). RmS: true RMS value calculated over 1 second.
-
Page 58: Display Of Fresnel Diagram
7.6. DISPLAY of fRESNEL DIAGRAm sub-menu displays a vector representation of the fundamentals of the voltages and currents. It indicates their associ- ated quantities (modulus and phase of the vectors) and the unbalances of the voltages and currents. Note: To allow the display of all vectors, those of which the modulus is too small to be pictured are shown even so, but their name is followed by an asterisk (*). - Page 59 7.6.4. THE L1 fRESNEL DIAGRAm DISPLAY ScREEN In the presence of the neutral, this screen displays a vector representation of the fundamentals of the phase-to-neutral voltages and the currents of one phase. It indicates their associated quantities (modulus and phase of the current and phase-to-neutral voltage vectors).
-
Page 60: Alarm Mode
8. ALARm moDE Alarm mode detects overshoots of thresholds on each of the following parameters: Hz, Urms, Vrms, Arms, |Udc|, |Vdc|, |Adc|, |Upk+|, |Vpk+|, |Apk+|, |Upk-|, |Vpk-|, |Apk-|, Ucf, Vcf, Acf, Uthdf, Vthdf, Athdf, Uthdr, Vthdr, Athdr, |W|, |Wdc|, |VAR|, VAD, VA, |PF|, |cos Φ|, |tan Φ|, PST, PLT, FHL, FK, Vunb, Uunb (for a three-phase source without neutral) Aunb, U-h, V-h, A-h and |VA-h| (see the table of abbreviations in §2.9). -
Page 61: Display Of The List Of Campaigns
The Campaign on standby message is displayed until the start time is reached. It is then replaced by the message Campaign running . When the stop time is reached, the Programming a Campaign screen returns with the key. You can then program another campaign. -
Page 62: Deleting An Alarm Campaign
8.5. DELETING AN ALARm cAmPAIGN When the list of campaigns performed is displayed (see figure 86), select the campaign to be erased. This is done by moving the cursor to it using the and keys. The selected campaign is bolded. Then press the key. -
Page 63: Trend Mode
9. TREND moDE Trend mode records changes to parameters previously specified in the Configuration / Trend mode screen (see §4.9). Memory card usage. List of records (see §9.3). Rapid programming and starting of Programming a recording (see §9.1). recording (see §9.1). Access to Trend mode configuration (see §4.9). -
Page 64: Viewing The Recording List
9.3. vIEwING THE REcoRDING LIST submenu displays the recording list already made. Recording list memory usage. The black part of the bar corresponds to the fraction of memory used. Recording name. Recording stop time. Recording start time. Figure 89: Recording list display screen If the stop date is in red, it means that it does not match the stop date initially programmed, because of a power supply problem (battery low or disconnection of the device supplied by mains only). - Page 65 9.5.2. TREND cURvES Date of the cursor. Position of the viewing window in the record. This screen is a partial view of the trend curve. There are other screens before and after the visible part. To select the display filter, press the ...
- Page 66 Curve of the maxima. Values of the cursor (minimum, Curve of the mean. mean, and maximum). Curve of the minima. Figure 94: Vrms (N) with MIN-AVG-MAX The display period of this curve is one minute. Each point of the mean curve represents the arithmetic mean of 60 values recorded every second.
- Page 67 Note: For the quantities (W, Wdc, VAR, VA, VAD, PF, cos Φ and tan Φ) and for a three-phase source without neutral, only the total quantities are represented. Figure 97: tan Φ (L1) without MIN-AVG-MAX for a three-phase connection with neutral Figure 98: tan Φ...
- Page 68 Starting date of the selection. Date of the cursor (ending date of the selection). Use the or keys to move the cursor. Energy calculation mode. Pressing this key lets you define the start of the selection. Figure 101: Wh (Σ) without MIN-AVG-MAX The display period of this bar chart is one minute.
- Page 69 This curve differs considerably from the previous one, because the MIN-AVG-MAX mode is activated. Each point of the mean curve represents the arithmetic mean of 7,200 values recorded every second. Each point of the curve of the maxima represents the maximum of the 7,200 values recorded every second. Each point of the curve of the minima corresponds to the minimum of the 7,200 values recorded every second.
- Page 70 The following table indicates the time needed to display the curve on screen as a function of the width of the display window for a recording period of one second: Typical waiting time for Typical waiting time for width of display window display with the display with the Grid increment...
-
Page 71: Power And Energy Mode
10. PowER AND ENERGY moDE key displays power- and energy-related measurements. The sub-menus available depend on the filter. „ For 2- and 3-wire single-phase connections and for the 2-wire two-phase connection, only selection L1 is available. The filter is therefore not displayed, but the display is the same as for L1. „... -
Page 72: Filters L1, L2 And L3
10.1.3. THE ENERGIES coNSUmED DISPLAY ScREEN sub-menu displays the meters of energy consumed by the load. Active energy. Inductive reactive effect . DC energy (only if a DC current sen- sor is connected). Reactive energy. Capacitive reactive effect Distortion energy. Apparent energy. -
Page 73: Filter Σ
Notes: This screen corresponds to the choice “non-active quantities broken down” in the VAR tab of the Calculation Methods menu of the Configuration mode. If the choice had been “non-active quantities not broken down”, then the VAD label (distortion power) would have disappeared and the VAR label would have corresponded to the non-active power (N). This non-active power has no inductive or capacitive effect. -
Page 74: Starting Energy Metering
10.3.2. THE ENERGY mETERS DISPLAY ScREEN The wh... sub-menu displays the energy meters. Meters of energy consumed by the Meters of the energy generated by load. the load. Active energy. DC energy (only if a DC current sen- Inductive reactive effect . sor is connected). -
Page 75: Disconnection Of Energy Metering
10.5. DIScoNNEcTIoN of ENERGY mETERING To suspend energy metering, press The stop date and time of the meter- ing are displayed alongside the start date and time. Figure 119: the Energy Metering screen in toe A disconnection of the metering is not definitive. It can be resumed by pressing the key again. -
Page 76: Screen Snapshot Mode
11. ScREEN SNAPSHoT moDE key can be used to take up to 50 screen snapshots and display the recorded snapshots. Saved screens may then be transferred to a PC using the PAT application (Power Analyser Transfer). 11.1. ScREEN SNAPSHoTS Press the key for approx. 3 seconds to shoot any screen . When a screen snapshot is taken, the icon of the active mode ( ) in the top strip of the display unit is replaced by the... -
Page 77: Help Key
12. HELP kEY key provides information about the key functions and symbols used in the current display mode. The following information is displayed: Reminder of the mode used. Reminder of the current sub-mode. List of information concerning the keys. Help page 2. Help page 1. -
Page 78: Data Export Software
13. DATA ExPoRT SofTwARE There are two data export software programs: „ PAT (Power Analyser Transfer), supplied with the device, used to transfer the data recorded in the device to a PC. „ Dataview, optional, also used to transfer the data, which are then presented in the form of a report compliant with your coun- try’s standards. -
Page 79: General Specifications
14. GENERAL SPEcIfIcATIoNS 14.1. ENvIRoNmENTAL coNDITIoNS The following chart shows conditions relating to ambient temperature and humidity: 1 = Reference range. 2 = Range for use. 3 = Range for storage with batteries. 4 = Range for storage without batteries. °C 42,5 caution: at temperatures above 40°C, the device must be powered by the battery alone oR by the mains power unit alone;... -
Page 80: Electromagnetic Compatibility
14.4. ELEcTRomAGNETIc comPATIbILITY Emissions and immunity in an industrial setting compliant with IEC 61326-1. 14.5. PowER SUPPLY 14.5.1. mAINS PowER SUPPLY This is a specific 600 V , category IV – 1000 V , category III external mains power supply unit. Range of use: 230 V ±... -
Page 81: Functional Characteristics
15. fUNcTIoNAL cHARAcTERISTIcS 15.1. REfERENcE coNDITIoNS This table indicates the reference conditions of the quantities to be used by default in the characteristics indicated in § 15.3.4. Parameter Reference conditions Ambient temperature 23 ± 3 °C Humidity (relative humidity) [45 %; 75 %] Atmospheric pressure [860 hPa ;... - Page 82 15.3.2. cURRENT INPUT cHARAcTERISTIcS Operating range: [0 V ; 1 V] Input impedance: 1 MW. Admissible overload: 1.7 V constant. FLEX type current sensors (AmpFLEX™ and MiniFLEX) switch the current input to an integrator assembly (‘Rogowski’ channel) capable of interpreting the signals from Rogowski sensors. The input impedance is reduced to 12.4 kW in this case. 15.3.3.
- Page 83 Quantities concerning currents and voltages measurement range without ratio Display resolution maximum intrinsic (with unity ratio) measurement (with unity ratio) error minimum maximum Frequency 40 Hz 70 Hz 0.01 Hz ±(0.01 Hz) 0.1 V ±(0.5 % + 0.2 V) V < 1000 V simple 1,200 V ±(0.5 % + 1 V)
- Page 84 measurement range without ratio Display resolution (with unity ratio) measurement maximum intrinsic error (with unity ratio) minimum maximum 0.1 V V < 1,000 V simple 1,200 V ±(0.8 % + 1 V) V ≥ 1,000 V RMS ½ voltage 0.1 V U <...
- Page 85 Quantities concerning powers and energies measurement range without ratio Display resolution (with unity ratio) measurement maximum intrinsic error (with unity ratio) minimum maximum ±(1 %) cos Φ ≥ 0.8 Excluding FLEX ±(1.5 % + 10 ct) 0.2 ≤ cos Φ < 0.8 Active 5 mW 7,800 kW...
- Page 86 Quantities associated with power measurement range measurement Display resolution maximum intrinsic error minimum maximum Phase differences of funda- -179° 180° 1° ±(2°) mentals ±(1°) for Φ cos Φ (DPF) 0.001 ±(5 ct) for DPF 0.001 tan Φ < 10 tan Φ ±(1°) for Φ...
- Page 87 Quantities concerning the spectral composition of the signals measurement range measurement Display resolution maximum intrinsic error minimum maximum 0.1 % τ < 1000 % 1500 %f Voltage harmonic ratio (τ ±(2.5 % + 5 ct) 100 %r τ ≥ 1000 % 0.1 % ±(2 % + (n ×...
- Page 88 measurement range Display resolution (with unity ratio) measurement maximum intrinsic error (with unity ratio) minimum maximum 0.1 V V < 1000 V simple 1200 V ±(2.5 % + 1 V) V ≥ 1000 V harmonic voltage 0.1 V (order n ≥ 2) U <...
- Page 89 Severity of short-term flicker maximum intrinsic error of the short-term flicker severity measurement (PST) Rectangular variations 120 v lamp 230 v lamp per minute 60 Hz network 50 Hz network (50% duty cycle) PST ∈ [0.5 ; 4] PST ∈ [0.5 ; 4] ±...
- Page 90 15.3.5. cURRENT SENSoR cHARAcTERISTIcS (AfTER LINEARIzATIoN) Sensor errors are offset by a typical correction inside the device. This typical correction, applied to the phase and amplitude, depends on the type of sensor connected (detected automatically) and the gain in the current acquisition channel used. The RMS current measurement error and phase error are additional errors (which must therefore be added to the device errors), indicated as influences on the calculations carried out by the analyser (powers, energies, power factors, tangents, etc.).
-
Page 91: Appendices
16. APPENDIcES This section presents the mathematical formulae used in calculating various parameters. 16.1. mATHEmATIcAL foRmULAE 16.1.1. NETwoRk fREQUENcY AND SAmPLING Sampling is controlled by (locked to) the network frequency so as to deliver 256 samples per cycle from 40 Hz to 70 Hz. This locking is essential for many calculations, including reactive power, distorting power, fundamental power factor, unbalance, and harmonic factors and angles. - Page 92 16.1.2.3. Severity of Short-term flicker – 10 minutes (excluding neutral) Method based on the IEC61000-4-15 standard. The input values are half-period RMS voltages (phase-to-neutral for distribution systems with neutral, phase-to-phase for distribu- tion systems without neutral). Blocks 3 and 4 are generated digitally. The classifier of block 5 has 128 levels. The value of PST[i] is updated every 10 minutes (phase (i+1) with i ∈...
- Page 93 16.1.2.7. Rms values (neutral included except Urms – over one second) RMS phase-to-neutral voltage of phase (i+1) with i ∈ [0; 3] (i = 3 ⇔ neutral). NechSec − ∑ [ ][ ] Vrms ⋅ NechSec RMS phase-to-phase voltage of phase (i+1) with i ∈ [0 ; 2]. NechSec −...
- Page 94 Current unbalance (vector) Arms − Aunb Arms 16.1.2.9. fundamental rms values (excluding neutral – over one second) These are calculated from the filtered vector (instantaneous) values. A digital filter made up of 6 low-pass order 2 infinite pulse response Butterworth filters and one high-pass order 2 infinite pulse response Butterworth filter is used to extract the fundamental components.
- Page 95 is the DC component. is the index of the spectral spike (the order of the harmonic component is Note: The power harmonic factors are calculated by multiplying the phase-to-neutral voltage harmonic factors by the current harmonic factors. The power harmonic angles (VAharm[i][j] and VAph[i][j]) are calculated by differentiating the phase-to- neutral voltage harmonic angles with the current harmonic angles.
- Page 96 Three-phase systems with neutral ∑ [ ][ Vharm ∑ Vharm [ ][ ] − Vharm Three-phase systems without neutral ∑ [ ][ Uharm ∑ Uharm [ ][ ] − Uharm Zero-sequence harmonics ∑ [ ][ Aharm ∑ Aharm [ ][ ] Aharm Three-phase systems with neutral ∑...
- Page 97 DC power of phase (i+1) with i ∈ [0 ; 2]. ⋅ Apparent power of phase (i+1) with i ∈ [0; 2]. Reactive power of phase (i+1) with i ∈ [0; 2] (Non-active quantities broken down). NechSec − NechPer ∑ [ ][ ] VARF ⋅...
- Page 98 Reactive power, Wattmeter 2 NechSec − NechPer ∑ [ ][ ] VARF ⋅ − ] [ 0 − ⋅ NechSec DC power, Wattmeter 1 ⋅ DC power, Wattmeter 2 − ⋅ b) Reference in L2 Active power, Wattmeter 1 NechSec −...
- Page 99 DC power, Wattmeter 1 − ⋅ DC power, Wattmeter 2 Udc ⋅ d) calculation of the total quantities Total active power Total DC power Total apparent power ] 1 [ ] 1 [ Note: This is the total apparent RMS power as defined in IEEE 1459-2010 for distribution systems without neutral. Total reactive power (Non-active quantities broken down –...
- Page 100 16.1.5. PowER RATIoS (ExcLUDING NEUTRAL – ovER oNE SEcoND) a) Distribution system with neutral Power Factor of phase (i+1) with i ∈ [0; 2]. Fundamental power factor of phase (i+1) or cosine of the angle of the phase-to-neutral voltage fundamental of phase (i+1) with respect to the current fundamental of phase (i+1) with i ∈...
- Page 101 With : If reference on L1 NechSec NechSec − − ∑ ∑ [ ][ ] [ ][ ] [ ][ ] [ ][ ] ⋅ ⋅ ⋅ − ⋅ NechSec NechSec If reference on L2 NechSec NechSec − − ∑ ∑...
- Page 102 16.1.6. ENERGIES Energies excluding neutral – over Tint with refresh every second 16.1.6.1. Distribution system with neutral Note: Tint is the power integration time in energy calculations; the beginning and end of this period are user-controlled. Consumed DC energy of phase (i+1) with i ∈ [0; 2] [ ][ ] ∑...
- Page 103 Total consumed capacitive reactive energy (Non-active quantities broken down – Configuration >Calculation methods >VAR) VARhC[0][3] = VARhC[0][0] + VARhC[0][1] + VARhC[0][2] Total consumed distortion energy (Non-active quantities broken down – Configuration >Calculation methods >VAR) VADh[0][3] = VADh[0][0] + VADh[0][1] + VADh[0][2] Total consumed non-active energy (Non-active quantities not broken down –...
- Page 104 Total generated inductive reactive energy (Non-active quantities broken down – Configuration >Calculation methods >VAR) VARhL[1][3] = VARhL[1][0] + VARhL[1][1] + VARhL[1][2] Total generated capacitive reactive energy (Non-active quantities broken down – Configuration >Calculation methods >VAR) VARhC[1][3] = VARhC[1][0] + VARhC[1][1] + VARhC[1][2] Total generated distortion energy (Non-active quantities broken down –...
- Page 105 Total consumed non-active energy (Non-active quantities not broken down – Configuration >Calculation methods >VAR) [ ][ ] ∑ [ ][ ] VARh 3600 b) Total generated Dc energy [ ][ ] − ∑ [ ][ ] Wdch with Wdc[i][n] < 0 3600 c) Total energies generated other than Dc (w[i][n] <...
-
Page 106: Distribution Sources Supported By The Device
16.2. DISTRIbUTIoN SoURcES SUPPoRTED bY THE DEvIcE See connections in §4.6. 16.3. HYSTERESIS Hysteresis is a screening principle that is often used after detection of a threshold stage in Alarm mode (see §4.10) and in Inrush current mode (see §5.2). A correct hysteresis setting avoids repeated changes of state when the measurement oscillates about the threshold. -
Page 107: Four-Quadrant Diagram
16.5. foUR-QUADRANT DIAGRAm This diagram is used for power and energy measurements (see §9). Figure 123: Four-quadrant diagram Here VAR is the fundamental reactive power (and not the non-active power). 16.6. mEcHANISm foR TRIGGERING TRANSIENT cAPTURES The sampling rate is a constant 256 samples per cycle. When a transient capture is started, each sample is compared to the sample from the preceding cycle. -
Page 108: Glossary
Here are the conditions for triggering and stopping captures: Triggering and stop conditions Triggering filter Triggering condition ⇔ [A1 half-cycle RMS value] > [Triggering threshold] Stop condition ⇔ [A1 half-cycle RMS value] < [Stop threshold] Triggering condition ⇔ [A2 half-cycle RMS value] > [Triggering threshold] Stop condition ⇔... - Page 109 K factor. Used to quantify the effect of a load on a transformer. Harmonic loss factor. flicker a visual effect of voltage variations. frequency number of full voltage or current cycles in one second. fundamental component: component at the fundamental frequency. Giga (10 Harmonics in electrical systems, voltages and currents at frequencies that are multiples of the fundamental frequency.
- Page 110 vADh Distortion energy. Apparent energy. Reactive or non-active power. vARh Reactive or non-active energy. Peak factor of the voltage. Phase-to-neutral RMS distortion voltage. Phase-to-neutral DC voltage. vpk+ Maximum peak value of the phase-to-neutral voltage. vpk- Minimum peak value of the phase-to-neutral voltage. Harmonic of the phase-to-neutral voltage.
-
Page 111: Maintenance
17. mAINTENANcE Except for the battery and the memory card, the instrument contains no parts that can be replaced by personnel who have not been specially trained and accredited. Any unauthorized repair or replacement of a part by an “equivalent” may gravely impair safety. -
Page 112: Replacing The Screen Film
„ Turn the device over and hold the battery as it slides out of its compartment. „ Disconnect the battery connector without pulling on the wires. Note: The Qualistar+ preserves the date-time function for approximately 24 hours without the battery. Spent batteries must not be treated as ordinary household waste. -
Page 113: Memory Card
17.8. UPDATING of THE INTERNAL SofTwARE With a view to providing, at all times, the best possible service in terms of performance and technical upgrades, Chauvin Arnoux invites you to update the embedded software of the device by downloading the new version, available free of charge on our web site. -
Page 114: Warranty
18. wARRANTY Except as otherwise stated, our warranty is valid for three years starting from the date on which the equipment was sold. Extract from our General Conditions of Sale provided on request. The warranty does not apply in the following cases: „... -
Page 115: To Order
19. To oRDER 19.1. c.A 8335 THREE-PHASE ELEcTRIcAL NETwoRkS ANALYSER c.A 8335 without clamp ............................P01160577 c.A 8335 mN ................................P01160571 c.A 8335 mN93A ............................... P01160572 c.A 8335 AmP450 ..............................P01160573 c.A 8335 AmP800 ..............................P01160574 c.A 8335 PAc ................................P01160575 c.A 8335 c193 ................................ - Page 116 Tel: +86 21 65 21 51 96 - Fax: +86 21 65 21 61 07 ScANDINAvIA - cA mätsystem Ab USA - chauvin Arnoux Inc - d.b.a AEmc Instruments Box 4501 - SE 18304 TÄBY 200 Foxborough Blvd. - Foxborough - MA 02035...
Need help?
Do you have a question about the C.A 8335 and is the answer not in the manual?
Questions and answers