
Related Manuals for GE CSE Uniserve CB Watch 3


Summary of Contents for GE CSE Uniserve CB Watch 3
- Page 1 Grid Solutions CB Watch 3 Circuit Breaker Monitoring System Operating Manual MA-037 - CBW3 Operating Manual v7.0 May 2020...
-
Page 2: Table Of Contents
Contents Topic Page INTRODUCTION .................. 9 Product Overview ................... 9 Document Scope ..................... 9 Abbreviations & Definitions ................9 SYSTEM DESCRIPTION ..............10 Modules ......................10 Sensors ......................10 Time Stamps ....................11 HUMAN MACHINE INTERFACE (HMI) ..........12 Introduction ....................12 TCP/IP configuration .................. - Page 3 Coil Continuity ....................76 Setting Alarms ....................76 STORED ENERGY SYSTEM MONITORING ........... 79 General Description ..................79 Spring Mechanism ..................80 Setting Spring Alarms ..................84 Pneumatic/hydraulic Pump ................85 Setting Pump Alarms..................91 CB OPERATION GRAPHS ..............92 HMI Graphs ....................
- Page 4 Illustrations Figure 1 – CBW3 Modules ........................10 Figure 2 – examples of sensors used ....................... 10 Figure 3 – Network card configuration step 1 ..................12 Figure 4 – Network card configuration step 2 ..................12 Figure 5 – Network card configuration step 3 ..................13 Figure 6 –...
- Page 5 Figure 46 – Example of historical chart – reaction and operating time ..........33 Figure 47 – Entry of travel distances ......................34 Figure 48 – Operation graphs for opening ....................35 Figure 49 – Operation graph for closing ....................35 Figure 50 –...
- Page 6 Figure 94 – zero current level ........................64 Figure 95 – Arcing time ..........................64 Figure 96 – Max arcing time threshold ....................64 Figure 97 – Max arcing time alarm ......................64 Figure 98 – Arcing time historical chart ....................65 Figure 99 –...
- Page 7 Figure 142 – Last pump run time ......................85 Figure 143 – Pump run time alarm thresholds ..................85 Figure 144 – Pump run time alarm ......................85 Figure 145 – Pump run time initial value ....................86 Figure 146 – Pump run data in last 24hr ....................86 Figure 147 –...
- Page 8 Figure 190 – uploading a product or system file ................... 113 MA-037 - CB Watch 3 Operating Manual v7.0 - May 2020 Page 8 of 118...
-
Page 9: Introduction
INTRODUCTION Product Overview The CB Watch 3 system (often abbreviated as CBW3 in this manual) is a monitoring system for high voltage circuit breakers. It monitors the following aspects: ▪ Operation timing ▪ SF6 gas leakage ▪ Arcing contact wear ▪... -
Page 10: System Description
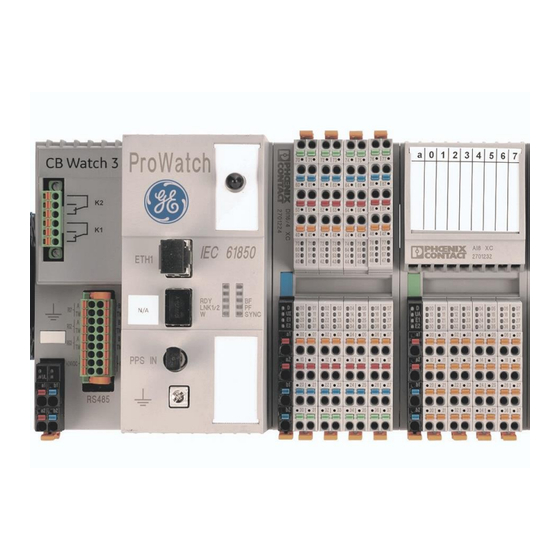
SYSTEM DESCRIPTION Modules The CBW3 system is comprised of both modules and sensors. The modules include the main processor module and the various I/O modules. They receive and process the signals obtained from all the sensors. For more detailed information, please refer to the CBW3 Installation Manual. Figure 1 –... -
Page 11: Time Stamps
Time Stamps Accurate time is being maintained by the CBW3 using a Real Time Clock (RTC). This RTC requires system power to run and is backed up by a supercapacitor in case of power loss. Normally the CBW3 is powered by the same substation DC power that powers the circuit breaker. -
Page 12: Human Machine Interface (Hmi)
HUMAN MACHINE INTERFACE (HMI) Introduction The CB Watch 3 does not require the user to load a special software to connect to it and access the information it captures. The CBW3 has a built-in web server and an integrated Human Machine Interface (HMI) which is accessible from any web browser (Firefox, Chrome, etc…). -
Page 13: Figure 5 - Network Card Configuration Step 3
In the window, select IPv4 IP address settings and click properties. A new window (as shown below) will appear: By default, the IP address of the CBW3 is set in the factory to: 192.168.5.22 But your particular IP address will have been set during the installation process. We will use the default IP address here, purely as an example. -
Page 14: Connecting To The Cbw3
(see picture below). Warning: Most standard 1Gbs RJ45 SFP modules will not work! Only certain 100Mbs SFP module actually work. Please contact GE to acquire a correct and tested SFP module. Figure 7 – Connection to the CBW3 Alternatively connect onto (or VPN into) the same network as the one the CBW3 is on. -
Page 15: Figure 9 - Connection Advanced Page
Disregard and press the “Advanced” button which will reveal a “Proceed anyway” option. Figure 9 – Connection advanced page Please disregard the “unsafe” warning and proceed anyway to the IP address that you know is the one you gave the CBW3. Note 1: Depending on the browser used, it may be possible to save the IP address into your browser and tell it that it is trusted so that the message will not appear next time. -
Page 16: Access Levels
Access Levels Access to the HMI and the data is restricted according to several username login levels, each protected by passwords. The various increasing levels of access are listed below. Each next level has the rights of the preceding level plus those listed: Username: “user”... -
Page 17: Languages
Warning: Please take good note of any new password after your change ! New passwords will need to be a minimum of 8 characters long. You will get an error message if you do not adhere to this rule. Once you have changed them, you will not be able to get back to the default passwords that are too short. -
Page 18: Navigation
Navigation Navigation through the menus is done by: (1) Selecting one the menu section in the toolbar: • Measurements • Settings • System • Language • Overview • Logout Selecting one of the tabs in the secondary menu/toolbar Figure 14 – HMI secondary toolbar for System section From now on, in this Operating Manual, the steps needed to reach any screen shown will be highlighted in black above the screen as per the example below: As an example, if you wanted to visualise the firmware versions being used, you would... -
Page 19: Figure 16 - Set Button Example
Also in this Operating Manual, we will often (as in the example above) mask part of the page displayed with a blue screen in order to focus attention on the relevant part of the page. When changing any setting in the HMI, please note that before the adjustment of a parameter can take effect, it first needs to be validated and stored by pressing the "Set"... -
Page 20: Cb Status Overview
CB STATUS OVERVIEW General Description The first page you will encounter when you log into the CBW3 HMI is the Overview summary page. It provides a dashboard for a quick overview of the CBWatch3, the circuit breaker and all its functions that are being monitored. HMI: Overview / Summary Figure 17 –... -
Page 21: Risk Indexes
HMI: Overview / Summary Figure 18 – CBW3 and CB details The aim is to provide an easy to understand interpretation of the status of each key function of the circuit breaker that is being monitored by the CBWatch3. This is particularly useful for a non-expert of circuit breaker experts, for that person to be able to judge the relative importance of any warning received. -
Page 22: Figure 20 - Risk Index Display
If the function is not monitored. this is indicated by a “No” in the “Active” column and the “N/A” value is associated with that RI. The RI is first calculated per pole and then then the Total RI for that function is calculated as the worst of the 3 poles. -
Page 23: Risk Index Alarms
Risk Index Alarms Alarms can be set for each of the 6 functional RI and for the overall CBRI by setting thresholds. If the threshold is left at zero, then no alarm will be set. HMI: Settings / Risk Index Thresholds Figure 22 –... -
Page 24: Recommendations
And is displayed here: HMI: Overview / Recommendations Figure 24 – Log of Risk Index changes pt1 Recommendations In addition to the short message explaining the issue that caused the functional RI to change, other messages are also displayed with: Suggestion on what to do next (if applicable) Indication if maintenance is required to be performed on the breaker HMI: Overview / Recommendations... -
Page 25: Operation Timing Monitoring
OPERATION TIMING MONITORING Introduction The monitoring of the dynamic parameters during the operations of a circuit breaker (operating time, speed etc.) allows for a diagnostic to be made of any mechanical issue or significant drift in its speed of operation. •... -
Page 26: Figure 28 - Initial Setting Of Number Of Operations
HMI: Settings/Opening and Settings/Closing Figure 28 – Initial setting of number of operations An alarm can be set against both the number of opening and closing operations if they exceed a set threshold. The threshold is set here. HMI: Settings/Opening and Settings/Closing Figure 29 –... -
Page 27: Figure 32 - Pole Discrepancy Alarm
For an IPO CB, if the 52a or 52b contacts do not show the same value for all 3 poles for longer than the “Pole discrepancy timeout” (by default: 1 second), then the “pole discrepancy” alarm is also raised. This alarm can serve as a reminder of a temporary phase imbalance in an IPO CB (e.g. one phase is open while the others are not) and that the situation should not be maintained for a long time. -
Page 28: Figure 34 - Previous Operation Type
Figure 34 – Previous operation type 52a/52b contacts switching time All timing starts from the detection of the open or close command (rising edge of the current detected on the open or close coil circuit). The auxiliary contact switching time is measured for each operation: HMI: Measurements/Last opening results or Last closing results Figure 35 –... -
Page 29: Figure 38 - Operating Time Measurement
Operating times For each opening operation and for each of the poles, a recording is made of: - The date/time of the open command (appearance of current on the control circuit), - The “Reaction time” (t1) between the open command and the moment where the CB leaves the “closed”... -
Page 30: Figure 40 - Last Operation Measurements
HMI: Measurements/Last opening and closing results Figure 40 – Last operation measurements Note that, in opening operations, the “Opening reaction time (t1)” and the “52a contact switching time” are the same value because t1 uses the 52a time. This would not be the case if a travel sensor was present, hence why there are 2x separate lines. -
Page 31: Figure 42 - Entry Of Key Distances
Note that even though the maximum discordance value is shown under pole A, it does not indicate that the maximum of the three discordance values is associated with pole A. The discordance table does not appear in the HMI if the CB is a ganged breaker (only one drive motor) and not an IPO breaker. -
Page 32: Figure 44 - Operation Timing Alarms Thresholds
Timing alarms Alarm thresholds can be set for the following measured items: Opening - (all CB) • Minimum and maximum Reaction time (t1), per pole • Minimum and maximum Operation time (t2), per pole • Minimum and maximum Travel time (t2-t1), per pole •... -
Page 33: Figure 45 - Alarms Related To Operation Timing
HMI: Measurements/Alarms Figure 45 – Alarms related to operation timing Historical graphs Graphs are used to display the history of the values recorded and to provide an easy visual method of spotting variations and trends in the recorded values over time. The following historical graphs are available, with a point for each opening or closing operation: •... -
Page 34: Additional Functionalities With Travel Sensor
Additional Functionalities With Travel Sensor* *The presence of a travel sensor fitted to the circuit breaker by the manufacturer is required for all the following additional functionalities. Travel Distances Additional physical distances associated with the CB contact movement need to be entered into the system (in mm) to understand the exact position of the contacts and to enable more precise timing and speed measurements. -
Page 35: Figure 48 - Operation Graphs For Opening
Operation Graphs A distance /vs/ time graph is recorded during each operation and stored: HMI: Measurements/Operations charts/Opening Figure 48 – Operation graphs for opening HMI: Measurements/Operations charts/Closing Figure 49 – Operation graph for closing MA-037 - CB Watch 3 Operating Manual v7.0 - May 2020 Page 35 of 118... -
Page 36: Figure 50 - Monitoring The Auxiliary Contacts
Auxiliary contact supervision Because we have a travel sensor, when we get the signal from the 52a and 52b auxiliary contacts that the CB has opened or closed, we can check the corresponding position of the travel sensor (which should be within the pre-defined min and max positions) to confirm that the CB has physically moved to the correct position. -
Page 37: Figure 52 - Monitoring The Overtravel
Overtravel The overtravel is also monitored for each operation. This is defined as the difference (in mm) between these two measured values: The maximum travel point reached during the operation The final resting position at the end of the operation as measured by the travel sensor and shown on the travel curve Figure 52 –... -
Page 38: Figure 55 - Overtravel Alarm
An alarm is raised if, during an opening or closing operation, the overtravel value measured exceeds the “Max overtravel” threshold entered. HMI: Measurements/Alarms Figure 55 – Overtravel alarm MA-037 - CB Watch 3 Operating Manual v7.0 - May 2020 Page 38 of 118... -
Page 39: Timing Compensation
Timing Compensation Introduction The operating time of a circuit breaker can be affected by: the ambient temperature (greater friction in the mechanical movement at low temperature). This affects travel time. the voltage made available to the coil (lower DC voltage will mean that the coil takes longer to energise to the required level). -
Page 40: Figure 57 - Two Examples Of Operating Time Temperature Compensation Values
Effect of ambient temperature The temperature compensation uses the ambient temperature value and the compensation table entered in the previous section. It requires the presence of an outside ambient temperature value, either from a dedicated temperature sensor or from the gas sensor(s). The temperature compensation is computed by shifting the timing alarm thresholds based on the change induced by the recorded ambient temperature when the operation took place compared to nominal 20... -
Page 41: Setting Alarms
Setting Alarms Notice: It is the customer’s responsibility to decide whether to set alarms or not and to decide what thresholds to set alarms at, as this will depend on the customer’s operational priorities and risk philosophy. However, here are some guidelines that may prove helpful in deciding what threshold values to use: Alarm Summary This table summarises all the alarms that can be set in terms of operation timing... - Page 42 Required data (without travel sensor present) As seen in Section 5.2.5, the following distances (in mm) are required by the system to calculate the contact separation speed: End of open position ~ location of 52b sensor (ON when CB is OPEN) End of close position ~ location of 52a sensor (ON when CB is CLOSED) Look at the FAT timing test charts (or more recent tests) to ascertain how far they are located (travel distance when 52b contact changes state).
- Page 43 Threshold values Maximum number of operations Related to a requirement for a maintenance or inspection operation. Pole discrepancy It is set by default to 1s but can be customised. This means an alarm is generated if one pole remains in a different state for more than 1 second. Opening/Closing Reaction time (t1), per pole Opening/Closing Operation time (t2), per pole Opening/Closing Travel time (t2-t1), per pole...
-
Page 44: Sf6 Gas Level Monitoring
SF6 GAS LEVEL MONITORING General Description If the circuit breaker being monitored uses SF gas (or a gas mixture) to extinguish the arc, then the CBW3 can monitor the gas tanks for leaks. During commissioning, a circuit breaker is filled with gas to its nominal filling pressure. The performance and even operation of a circuit breaker can be severely affected if the pressure of the gas contained in the circuit breaker falls too low. -
Page 45: Figure 60 - Equivalent Density Lines And Liquefaction Curve
Figure 60 – Equivalent density lines and liquefaction curve Gas sensors used Two types of gas sensors are used depending on the options selected. Both output a digital signal (rather than an analogue signal) and measure the following parameters: • Gas pressure + gas temperature •... -
Page 46: Figure 62 - Gas Sensor Alarms
HMI: Measurements/Alarms Figure 62 – Gas sensor alarms Data stacks Gas data values are stored in “stacks” with the number of data values stored by the system corresponding to 2.5x times the short-term or long-term time horizon set by the user. This is to enable the calculation of an accurate long-term extrapolation: •... -
Page 47: Gas Measurements
Gas Measurements Gas pressure/temperature/density It is possible to visualise the following gas information in the HMI either for one of three separate tanks depending on the number of sensors installed: HMI: Measurements/Gas Figure 64 – Gas measurements The following information is available: •... -
Page 48: Figure 65 - Gas Thresholds Min/Max
The imperial unit output is different than for metric units. It is in psig (psi gauge) and it is a “relative” value as it is most often used in that way in non-metric regions. So, this is the same value as will be displayed by a gauge and there is no issue comparing them here. Gas pressure alarms Since all the nameplate values are usually given as gas pressures at 20 C, it is against this... -
Page 49: Figure 66 - Gas Pressure Thresholds
HMI: Settings/Gas monitoring Figure 66 – Gas pressure thresholds A comparison is constantly made between the current gas pressure value normalised at C and the various thresholds (1, 2, 3) values set. If any is reached, then a threshold alarm is raised. -
Page 50: Figure 69 - Gas Liquefaction Risk Alarm
HMI: Measurements/Alarms Figure 69 – Gas liquefaction risk alarm Gas moisture level The presence of a high level of moisture in the SF6 gas affects the dielectric withstand strength of the gas. Therefore, it is always desirable to test the moisture content of any gas being added to the CB before doing so. -
Page 51: Figure 72 - Excessive Moisture Alarm
HMI: Measurements/Alarms Figure 72 – Excessive moisture alarm Extrapolated gas pressure values As seen before in section Data stacks6.1.4, the gas pressure values are stored in two different stacks: • values in the “short-term” stack recorded every 10 minutes • values in the “long-term” stack recorded every day These values are used to calculate a linear extrapolation/forecast of the pressure in the future at the end of either the “short-term”... -
Page 52: Figure 74 - Forecasted Gas Pressure Values
HMI: Measurements/Gas Figure 74 – Forecasted gas pressure values Note: when there are not enough data points recorded to date to calculate the short or long-term trend, then the corresponding “stack not enough” alarm flag is set. The value is not displayed in the HMI and is replaced by a “-“... -
Page 53: Figure 76 - Extrapolated Gas Pressure Alarms
• The “short-term” alarm is raised if the short-term extrapolated gas pressure at 20 is calculated to drop below the gas threshold 2 (too low, lock-out) that has been set ➢ This means that the gas pressure/level will be below threshold 2 within the short-term horizon that has been set HMI: Measurements/Alarms Figure 76 –... -
Page 54: Figure 78 - Typical Cb Nameplate With Gas Info
• The long-term gas mass leak rate = change in gas mass calculated using the long- term pressure leak rate and the nominal gas mass in each tank, scaled to a year (in mass unit per year) • The long-term gas percentage leak rate = change in gas percentage calculated using the long-term pressure leak rate and the nominal gas mass in each tank and the gas density, scaled to a year (in mass unit per year) Two values need to be entered during setup for:... -
Page 55: Figure 80 - Gas % Leak Rate Thresholds
Alarms can be set on the long-term gas % leak rate (the most used metric because government and corporate targets are set in terms of % SF lost to the atmosphere). Two thresholds are required to be entered by the user during setup: •... -
Page 56: Figure 83 - Short-Term Gas Graphs - Gas Density
The “long term” selection displays the history of: • Gas density • Gas pressure at 20 • Gas temperature • Gas moisture level HMI: Measurements/Gas/Short term Figure 83 – Short-term gas graphs – gas density You can adjust the time span on all the graph’s X axis (narrow down the time-span to focus on a period) by selecting/highlighting it with your mouse. -
Page 57: Setting Alarms
Setting Alarms Notice: It is the customer’s responsibility to decide whether to set alarms or not and to decide what thresholds to set alarms at, as this will depend on the customer’s operational priorities and risk philosophy. However, here are some guidelines that may prove helpful in deciding what threshold values to use: Alarm Summary This table summarises all the alarms that can be set in terms of SF6 gas monitoring. - Page 58 The key bits of data required are: - Nominal SF6 gas fill pressure at 20 75 psig in this example - Minimum (T2 - lock-out) SF6 gas pressure at 20 62 psig in this example - What level the low gas warning (T1) is set as 69 psig in this example - Total weight of SF6 gas 690 lb in this example...
-
Page 59: Figure 86 - Example Name Plate
Gas extrapolated pressures The same thresholds (1 and 2) are used as for the gas pressures. If want earlier warning, then need to extend both the short term and the long-term horizon during setup. One suggestion would be to set the: •... -
Page 60: Figure 87 - Example Settings
Figure 87 – Example settings MA-037 - CB Watch 3 Operating Manual v7.0 - May 2020 Page 60 of 118... -
Page 61: Contact Wear Monitoring
CONTACT WEAR MONITORING General Description Most circuit breakers use special arcing contacts specifically designed to withstand the high energy that occurs during arcing when opening a circuit breaker. These have a finite service life and therefore need to be replaced when it has been reached. With the appropriate sensors installed, the interrupted current during each CB opening operation can be monitored by enabling “Primary current measurement”... -
Page 62: Figure 89 - Stored Interrupted Current Curve
HMI: Measurements / Operations charts / Opening Figure 89 – Stored interrupted current curve During the first 20 milliseconds following the command to the coil, the minimum and maximum peak current values (Imin and Imax) are determined. The value of the interrupted current is calculated using the equation: Irms=(Imax-Imin)/22. -
Page 63: Arcing Time
Arcing Time Arcing time measurement During an open operation, we are particularly interested in the “Arcing time”. To calculate that, we need to know when the arcing starts (as we know when it finishes when the interrupted current goes to zero). When there is a travel sensor present, we can determine exactly when the arcing contacts have physically separated (ts). -
Page 64: Figure 94 - Zero Current Level
The “zero current level” is by default set to 10%, but this value can be increased to 20% or even 25% when the normal interrupted currents are quite low and we run the risk of 10% being too close to the noise level. If “ta” is not detected correctly, Z can be increased here: HMI: Settings / Opening Figure 94 –... -
Page 65: Arcing Contact Wear
Arcing time historical graph A graph displaying the history of the arcing times recorded is available. With a point for each opening operation, it provides an easy visual method of spotting variations and trends in the recorded values over time. The graphs can be found in the Operations Charts section: HMI: Measurements/Operations charts/Opening Figure 98 –... -
Page 66: Figure 99 - Contact Electrical Wear Cumulative Value
HMI: Measurements / last opening results Figure 99 – Contact electrical wear cumulative value When the arcing contacts are replaced with new ones, the cumulative arcing contact wear needs to be reset to zero here: HMI: Settings / Opening Figure 100 – Initial electrical wear setting Contact wear alarm To receive a warning when we are approaching the time when the arcing contacts need to be replaced due to wear, a comparison is made between the cumulative electrical wear and... -
Page 67: Figure 103 - Cumulative Arcing Contact Wear Graph
Arcing contact wear graph A graph displaying the cumulative wear of the three arcing contacts over time is available. With a point for each opening operation, it provides an easy visual method of spotting variations between poles. The graphs can be found in the Operations Charts section: HMI: Measurements/Operations charts/Opening Figure 103 –... -
Page 68: Setting Alarms
Setting Alarms Notice: It is the customer’s responsibility to decide whether to set alarms or not and to decide what thresholds to set alarms at, as this will depend on the customer’s operational priorities and risk philosophy. However, here are some guidelines that may prove helpful in deciding what threshold values to use: Alarm summary This table summarises all the alarms that can be set in terms of contact wear monitoring. -
Page 69: Figure 106 - Contact Wear Alarm Thresholds
HMI: Settings / Opening Figure 106 – Contact wear alarm thresholds MA-037 - CB Watch 3 Operating Manual v7.0 - May 2020 Page 69 of 118... -
Page 70: Control Circuit Monitoring
CONTROL CIRCUIT MONITORING General description This section covers monitoring the various CB command circuits and ensuring that any open or close command, sent manually or by a protection relay, can be executed. DC Supply DC supply level While a circuit breaker will fail to receive any command if there is no DC voltage present or if it is extremely low, the time taken for the operation may be affected by the presence of a lower than nominal DC voltage (as has been explained earlier in this manual). -
Page 71: Coil Integrity
DC supply during operation In addition, the voltage value at each opening or closing operation is stored with the operation data and is displayed with the other last operation values: HMI: Measurements/Last opening and closing results Figure 110 – DC voltage in last operation measurements A graph of the DC voltage drop during each operation (opening and closing) is also displayed The graphs can be found in the Operations Charts section: HMI: Measurements/Operations charts/Opening or Closing... -
Page 72: Figure 112 - Coil Currents And Coil Charges
A small degradation of the coil can therefore be detected before it becomes problematic and the coil becomes open circuit, preventing the open/trip or close command from the protection relay being executed. The following information is displayed in the HMI: HMI: Measurement / Last opening results or last closing results Figure 112 –... -
Page 73: Figure 114 - Graph Of Coil Current During Opening Or Closing Operation
being triggered by different relays and so displaying a mixture of current values against both open1 and open2. Data is recorded for 300ms (acquisition time) and a “coil current /vs/ time” curve is displayed in the HMI and stored: HMI: Measurement / Operations charts / opening or closing Figure 114 –... -
Page 74: Figure 115 - Drop-Down List Of Previous Archives
Figure 115 – Drop-down list of previous archives An alarm can be set on a maximum threshold for the mean current used to actuate each coil (both during opening and during closing, if the coils are different): HMI: Settings / Analog channels Figure 116 –... -
Page 75: Figure 119 - Coil Charge Alarms
The resulting alarms are displayed in the HMI: HMI: Measurements / Alarms Figure 119 – Coil charge alarms Coil resistance If we have the DC source voltage monitored and we measure the coil current, we can then calculate the value of the coil resistance. This is a visual indicator only but this the value that we are trying to keep an eye on and which should not change. -
Page 76: Coil Continuity
Coil Continuity This is about continuously monitoring the continuity of the open/trip and close coil outside of when an operation is occurring. This is because there is no current flowing through the coil when no operation is taking place and therefore the coil current cannot be measured continuously. -
Page 77: Figure 123 - Control Circuit Monitoring Alarms
Thresholds Alarms available Data obtained from CBW3 Min Alarm Max Alarm Digital Relay Coil circuit DC voltage source 1 Coil circuit DC voltage source 2 Mean coil current - Open 1, per pole Mean coil current - Open 2, per pole Mean coil current - Close, per pole Coil actuation charge - Open 1, per pole Coil actuation charge - Open 2, per pole... -
Page 78: Figure 126 - Coil Current And Charge Default Settings
Where a percentage “p” margin is added to avoid spurious alarms. If this function is not being monitored and no sensor is present, then the values should be set as such to avoid any erroneous alarm: HMI: Settings / Analogue channels Figure 126 –... -
Page 79: Stored Energy System Monitoring
STORED ENERGY SYSTEM MONITORING General Description A circuit breaker uses stored energy to open and close the contacts at speed. This stored energy is often supplied by a spring which is rewound/rearmed by an electric motor. But it can also take the form of pneumatic/hydraulic pressure which is built-up by an electric compressor/pump motor. -
Page 80: Spring Mechanism
Spring Mechanism Spring rewind time The spring rewinding motors are usually DC powered. With the motor on/off contacts connected to the system, we can acquire the time at which these contacts are activated and therefore measure the duration of the spring rewinding phase (which is the operating time of the rewinding motor). -
Page 81: Figure 134 - Spring Motor Run Time Alarms
The alarms can be seen in the HMI: HMI: Measurements / Alarms Figure 134 – Spring motor run time alarms Rewind motor current The CBW3 can measure the current used by the spring rewinding motor (usually a DC motor) in order to notice any change over time, possibly highlighting additional friction in the spring mechanism requiring more torque or a problem with the motor itself. -
Page 82: Figure 138 - Spring Rewind Motor Current Graph
Motor current graph The motor current data is recorded for up to 12 seconds and a curve of current over time is graphed, displayed on the HMI and stored for future comparison: HMI: Measurement / Operations charts / Spring Figure 138 – Spring rewind motor current graph Via the HMI, the user is also able to display the previous curves saved in the CBW3: Figure 139 –... -
Page 83: Figure 140 - Operation Charts For Spring Rewind
HMI: Measurements / Operations charts / Spring Figure 140 – Operation charts for spring rewind MA-037 - CB Watch 3 Operating Manual v7.0 - May 2020 Page 83 of 118... -
Page 84: Setting Spring Alarms
Setting Spring Alarms Notice: It is the customer’s responsibility to decide whether to set alarms or not and to decide what thresholds to set alarms at, as this will depend on the customer’s operational priorities and risk philosophy. However, here are some guidelines that may prove helpful in deciding what threshold values to use: Alarm summary This table summarises all the alarms that can be set for monitoring the spring energy... -
Page 85: Pneumatic/Hydraulic Pump
Pneumatic/hydraulic Pump Pump operation time As seen in Section 9.1, the compressor motor is controlled by a pressure sensor, but by connecting a relay in parallel to the motor AC supply, we can generate motor on/off signals to acquire the date/time at which these contacts are activated. We can therefore timestamp when the compressor pump operates and measure the duration of its operation. -
Page 86: Figure 145 - Pump Run Time Initial Value
HMI: Settings / Pump Figure 145 – Pump run time initial value Pump starts per 24h Because the pump motor only starts whenever the pressure in the storage tank falls below a certain level and this depends on the number and types of operations previously performed, it is difficult to predict when the pump will operate. -
Page 87: Figure 148 - Pump Operation Alarms
HMI: Measurements / Alarms Figure 148 – Pump operation alarms Historical per 24h graphs In addition, the following graphs are shown to aid the comparison and graphically detect anomalies: - History of the number of pump starts per 24 hours - History of the number of CB operations per 24 hours - History of the total pump run time per 24 hours HMI: Measurements / Pump... -
Page 88: Figure 150 - Maximum Inrush Current
Pump motor current Using the appropriate CT (for AC or DC current), the CBW3 is able to measure the current used by the compressor/pump motor(s) in order to notice any changes. The key maximum pump motor current (peak inrush current) is displayed in the HMI: HMI: Measurements / Pump Figure 150 –... -
Page 89: Figure 154 - Drop-Down List Of Previous Archives
The curves are stored and previous curves can be retrieved and displayed via the HMI: Figure 154 – Drop-down list of previous archives Historical graphs In addition, the following graphs are available to aid the comparison and graphically detect any change in value over time for: - Maximum inrush pump/compressor motor current - Pump run time to bring pressure back to level HMI: Measurement / Operations charts / Pump... -
Page 90: Figure 156 - Display Of Generic Channels
Related additional sensors Additional information specific to pneumatic/hydraulic stored energy systems are often requested, for example: - AC supply voltage to the pump - Pressure in pneumatic/hydraulic storage tank This information can be monitored using sensors connected to the generic analogue channel inputs. -
Page 91: Setting Pump Alarms
Setting Pump Alarms Notice: It is the customer’s responsibility to decide whether to set alarms or not and to decide what thresholds to set alarms at, as this will depend on the customer’s operational priorities and risk philosophy. However, here are some guidelines that may prove helpful in deciding what threshold values to use: Alarm summary This table summarises all the alarms that can be set for monitoring the hydraulic/pneumatic... -
Page 92: Cb Operation Graphs
CB OPERATION GRAPHS HMI Graphs Operation Graphs We have already seen that you can view various operation graphs in the web HMI: 10.1.1.1 Opening Operation Graphs HMI: Measurements / Operations charts / Opening Figure 159 – Operation graphs for opening MA-037 - CB Watch 3 Operating Manual v7.0 - May 2020 Page 92 of 118... -
Page 93: Figure 160 - Operation Charts For Closing
10.1.1.2 Closing Operation Graphs HMI: Measurements / Operations charts / Closing Figure 160 – Operation charts for closing Note that the content will depend on the presence of the related sensors. MA-037 - CB Watch 3 Operating Manual v7.0 - May 2020 Page 93 of 118... -
Page 94: Figure 161 - Operation Charts For Spring Rewind
10.1.1.3 Spring Rewind Graphs HMI: Measurements / Operations charts / Spring Figure 161 – Operation charts for spring rewind MA-037 - CB Watch 3 Operating Manual v7.0 - May 2020 Page 94 of 118... -
Page 95: Figure 162 - Operation Charts For Pump Motor
10.1.1.4 Pump Motor Graphs HMI: Measurements / Operations charts / Pump Figure 162 – Operation charts for pump motor MA-037 - CB Watch 3 Operating Manual v7.0 - May 2020 Page 95 of 118... -
Page 96: Figure 163 - Drop-Down List Of Previous Archives
Graph history The graphs associated with the last operations are stored and the user is able to review and compare any previously saved graph by selecting the date/time in the drop-down menu: Figure 163 – Drop-down list of previous archives Graphs is stored in memory and the oldest is replaced by the most recent when the buffer memory is full. -
Page 97: Comtrade Graphs
COMTRADE Graphs Downloading COMTRADE Files A lot of the key data recorded during each circuit breaker operation (and available in the Modbus or DNP3 registers) is available in the COMTRADE files (format also used by relays), but the real use of the COMTRADE files is to contain all the data to generate the graphs. There are 4 different types of files: - “_open”... -
Page 98: Figure 166 - Visualising A Comtrade File
Visualising COMTRADE Files To visualise the file content, you will need to: - Download both the corresponding files (.cfg and .dat) into the same location - Use a COMTRADE file reader software (for example: WaveWind) - Point the reader to the location where the 2 files have been stored - You will then be able to see the data and the graphs: The example below shows the content of an opening operation file where all 6 coils (open 1 and open 2) have fired to open the CB:... -
Page 99: Heater Monitoring
HEATER MONITORING General Description Using the RTD8 module, the CBW3 can accommodate up to 8x PT100 temperature sensors. The number of sensors must be declared during setup. The first channel is always reserved for the outside ambient temperature, but the other 7 channels can be assigned to measure any temperature. -
Page 100: Ambient Temperature
Ambient Temperature The outside ambient temperature is usually measured using a PT100 temperature sensor connected as the first input of the RTD8 module (which is always reserved for it). If the RTD8 module is not present in the configuration but SF6 gas sensors are present, then because they are usually mounted away from direct sunlight an underneath the breaker, the temperature sensor built into the gas sensor is used as the ambient temperature reference. -
Page 101: Heater Temperature
Heater Temperature Winter heating monitoring When CB must operate in harsh winter conditions, making sure that the various drive cabinets and control cabinets are adequately heated and maintained at the proper temperature becomes key. In the old days, heaters were permanently on and older monitoring systems relied on monitoring the heater current to verify that the heating resistance was not open circuit and that the heater was working. -
Page 102: Setting Temperature Alarms
HMI: Settings / Aux. temperatures Figure 173 – Thresholds for relative delta temperatures Depending on the thresholds set (absolute and/or relative) for each temperature measured, any alarm raised is displayed in the HMI, under the “Alarm related to continuous measurements” section: HMI: Measurement / Alarms Figure 174 –... - Page 103 Alarm thresholds Ambient temperature Warning alarms could be set if the outside ambient temperature falls very low (-45 C) or very high (+45 C) so that any appropriate actions (e.g. heating blankets on the CB) can be taken in these extreme conditions. Absolute cabinet temperature Alarms should be set to check that the heaters are working correctly.
-
Page 104: Generic Analogue Channel Monitoring
GENERIC ANALOGUE CHANNEL MONITORING General Description Depending on the configuration, there may be up to 4 spare generic analogue channels that can be assigned to connect other sensors in order to measure and monitor other values on the circuit breaker. The CBW3 can accept sensors with a wide range of outputs: - Voltage outputs: 0-10V, +/-10V, 0-5V, +/-5V, - Curent outputs: 0-20mA, +/-20mA, 4-20mA,... -
Page 105: Alarms
Alarms Both minimum and maximum thresholds can be set on these generic channel values in order to trigger an alarm: HMI: Settings / Analog channels Figure 178 – Spare analogue channels alarm thresholds Any alarm triggered can be seen in the HMI: HMI: Measurements / Alarms Figure 179 –... -
Page 106: Dry Contact Relay Alarms
DRY CONTACT RELAY ALARMS General Description As seen throughout this manual, alarms can be set on a long list of parameters. These alarms are available in three different ways: - Through the HMI using colour coded notifications flags Alarms will appear in red and warnings in yellow, otherwise all will be green: HMI: Measurements / Alarms Figure 180 –... -
Page 107: Alarm Relay Assignment
Alarm Relay Assignment Virtually all alarms can be assigned to a relay, either the K relay or any of the additional 16 relays. This is done by ticking the appropriate box in the relay/alarm matrix pages. The alarms available have already been defined in each of the relevant previous sections. Each monitored function has its own alarms that can be assigned in a similar manner to one of the 16 relays or K1 by selecting them in the appropriate table in the alarm setup section. -
Page 108: Clearing Alarms
Each function has its own relay/alarm matrix pages: HMI: Settings / Alarms Figure 182 – Relay/alarm matrix pages There are over 74 available alarms spread over 7 relay/alarm matrix pages, enough to overcome the number of available relays, hence why most alarms are transferred using digital protocols nowadays. -
Page 109: Figure 184 - Clearing Operations Related Alarms
One for all the Operations related alarms HMI: Settings / Relays / Operations Figure 184 – Clearing operations related alarms MA-037 - CB Watch 3 Operating Manual v7.0 - May 2020 Page 109 of 118... -
Page 110: Digital Communication
DIGITAL COMMUNICATION Communication Protocols Depending on the configuration of your system, one or several digital communication protocols may be available from: • Modbus • DNP3 • IEC 61850 Ed2 The protocols enabled in the configuration are displayed with a tick in: HMI: System / Network Figure 185 –... -
Page 111: Integration With Perception Fleet Software
Integration with Perception Fleet software Perception Fleet can regularly poll each CBWatch3 in your fleet and gather all the Risk Index information from each circuit breaker in order to provide an overall view of your circuit breaker fleet. Perception will display the Risk Index information for each CB in your fleet and, if you want to delve into more details, it will let you seamlessly open the individual CBWatch3 web HMI. -
Page 112: Remote Assistance
In certain circumstances, you may be asked to generate, download and send data about the configuration of your system so that GE can help you understand and remotely fix any issue encountered. The “Assistance file” can be accesses as follows: Login as “Specialist”... -
Page 113: Product/System Files
Figure 189 – Remote assistance file The “.tar” file is time and date stamped and can be downloaded by double clicking on it. This is the file you need to send to GE if you are asked for the “Assistance file”. Product/System Files We may also ask you to download and send us “product.ini”... - Page 114 Choose the file by browsing to the location on your laptop Upload the file by pressing the “Send” button Repeat for the other file if required MA-037 - CB Watch 3 Operating Manual v7.0 - May 2020 Page 114 of 118...
-
Page 115: Technical Specification
TECHNICAL SPECIFICATION Measurements Continuous measurements Feature Value Refresh frequency Approx. every 1 second Pressure accuracy ±20mBar over most of range measurements Temperature accuracy ±2 ±32mBar below 0 C, ±10mBar Pressure accuracy above 0 measurement with moisture Temperature accuracy ±1 Accuracy 0.1% of measuring range Analogue measurements... - Page 116 Processor Feature Value CPU frequency 100 MHz Memory 512Mbit SDRAM + 256Mbit Flash Battery No battery used Date/time Saved by super capacitor for ~15days MA-037 - CB Watch 3 Operating Manual v7.0 - May 2020 Page 116 of 118...
- Page 117 Page left blank MA-037 - CB Watch 3 Operating Manual v7.0 - May 2020 Page 117 of 118...
-
Page 118: Contact & Copyright Details
GE, the GE monogram, CBWatch are trademarks of the General Electric Company. GE reserves the right to make changes to specifications of products described at any time without notice and without obligation to notify any person of such changes.
Need help?
Do you have a question about the CSE Uniserve CB Watch 3 and is the answer not in the manual?
Questions and answers