Table of Contents
Advertisement
Quick Links
Advertisement
Table of Contents

Related Manuals for Rhopoint Instruments Optimap PSD 3


Summary of Contents for Rhopoint Instruments Optimap PSD 3
- Page 2 The technology and components used in the device are based on state-of-the-art optic and electronics. As part of Rhopoint Instruments commitment to continually improving the technologies used in their products, they reserve the right to change information included in this document without prior notice.
-
Page 3: Table Of Contents
Contents Storage and Handling ....................3 Instrument cleaning ......................3 About the Optimap™ PSD ..................... 4 Accessories ........................4 Functional overview ....................... 5 Power ..........................6 Switching on the unit ...................... 6 Operation ........................7 Main Screen......................7 Profile Screen ......................9 Analysis Screen .................... -
Page 4: Storage And Handling
1 Storage and Handling • This instrument contains precision optics and electronics. You should therefore avoid knocking or dropping the device as the resulting impact could cause serious damage. • In some circumstances the optical components in the instrument could become misted because of temperature change. -
Page 5: About The Optimap™ Psd
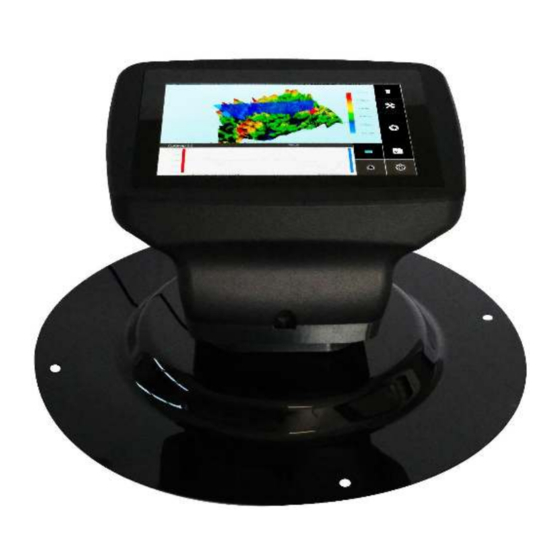
3 About the Optimap™ PSD Optimap™ PSD – The technology Optimap™ PSD is an advanced portable handheld instrument capable of performing fast, full field 3D surface measurements. Using an optical measurement technique known as Phase Stepped Deflectometry (PSD) it objectively measures and characterises many aspects of surface quality including texture, waviness and local defects including orange peel, inclusions, dents, and scratches. -
Page 6: Functional Overview
5 Functional overview Label No. Function Power button Touch screen display Harness attachments SD card slot Ethernet Battery charger connector USB connector Carry handle Measurement port... -
Page 7: Power
6 Power The Optimap™ PSD is powered by an integrated high-capacity lithium ion battery. Fully charged the instrument will operate for approx. 3 hours depending on usage. A mains powered battery charger is provided with the unit allowing it to be fully charged, when connected to the unit’s charger input (4), in under 5 hours. -
Page 8: Operation
Operation 8.1 Main Screen Zoom level Profile screen Analysis screen Measurement button Delete last Zoom slider measurement Project menu Measurement results Settings menu Instrument Project label Series Measurement Battery level status message number number indicator The touch sensitive icon-based measurement screen provides operation and setup of the device. - Page 9 • delete last measurement button or cancel button • project menu • settings menu. These features are described below. Results are also displayed in numerical format in the results window at the bottom left of the screen. At the bottom of the screen below the map image, Project Name, Series or batch number, and Measurement or count number indicators allow the storage and management of measurement results.
-
Page 10: Profile Screen
8.2 Profile Screen The profile screen can be accessed by pressing the button on the top right of the main screen. Return to main screen Blue pin Red pin Toggle free pin and rigid pin modes Swap pin positions Local min/max Profile length The profile has two modes;... -
Page 11: Analysis Screen
8.3 Analysis Screen The analysis screen is accessed by pressing the button. Zoom level Zoom slider Crop button Reset button Back button Amplification Amplification slider level The analysis screen is used to interact with the map in more ways than the main screen allows. These include a larger window, moving and rotating the map, changing the zoom level, changing the amplification level, changing crop values, and resetting to default settings. -
Page 12: Measurement Screen
8.4 Measurement Screen The measurement screen shows the steps that the main screen goes through while taking a measurement. A measurement is started by pressing the button. Status bar Cancel button Acquisition warning Status message window Delete button Numerical results 1. - Page 13 measurement, analyse the current measurement, change settings or any of the other features described in this manual.
-
Page 14: Project Screen
8.5 Project Screen Measurements are organised into projects, batches, and counts. This organisation is done in the project screen, which can be accessed with the button. If no initial project has been created or the current project has been closed the project label will display “NO PROJECT”. -
Page 15: Project Menu
8.5.3 Project Menu Project name Close batch View batches in project Close project Export project to SD card Delete entire project Delete last measurement The options within the project menu are: • Close Batch: Once the project holds measurements, associated measurements can be isolated in a batch. -
Page 16: View Batches
Back button Batch label Save button The desired name is entered using the on-screen keyboard, removing the default name of the batch number if not wanted using the “bksp” key and entering the desired name and completed by pressing the save button. Each batch within a project must have a unique name. - Page 17 Back button Batch name Algorithm Scroll used for buttons batch Counts in batch A batch can be further inspected by pressing on the entry. Batch name Count id Counts in batch Algorithm used for count Individual counts can be viewed by pressing on the entry.
- Page 18 Count id Available maps The available maps will depend on the algorithm and saving options. As count 0 is the average of the calculated parameters it contains no maps. Maps can be reviewed by pressing the entry. The rendering process can take some time, with no indication to show progress.
-
Page 19: Exporting Measurements
8.5.6 Exporting Measurements The Optimap3 is capable of transferring results onto a SD card. In this way user can analyse results on a PC and do some data post analysis. There are two ways to export measurements from the instrument. Either from within the current project or the no opened project menu. - Page 20 Chosen projects are marked with a tick and unselected projects are marked with a cross. The numerical results can either be exported in csv or SQLite database format. This transfer mode is quicker than a full transfer because no maps are copied. On the SD card, a main export folder will be created whose name is: YYYY-MM-DD_hh-mm-ss_OPTxxxxxxx_QUICK YYYY-MM-DD_hh-mm-ss_OPTxxxxxxx_QUICK_ALL...
- Page 21 • ALGO This is the algorithm used for this measurement. • Project This is the name of the project that the measurement is part of. • Batch This is the Batch name as set by the user. • Count This is the measurement index inside the current batch. •...
- Page 22 • B2_Sa This is the Sa result for the second band. • B2_RaX This is the RaX result for the second band. • B2_RaY This is the RaY result for the second band. • B2_RsM This is the RsM result for the second band. Last part of the CSV structure result file for Altitude_Results: •...
- Page 23 This is the standard deviation value from band B. • Kc This is the standard deviation value from band C. • Kd This is the standard deviation value from band D. • Ke This is the standard deviation value from band E. •...
- Page 24 This is the scaled texture value for band LW. • Tsw This is the scaled texture value for band SW. Last part of the CSV structure result file for TAMS-STD: • Contrast This is the contrast result. • Sharpness This is the Sharpness result. •...
- Page 25 Full transfer to SD card Using this option, the user will get the same output than with quick export, plus the full folder structure with BATCH and COUNT that may contain some images in case user has saved some images, or some data. Images will be *.bmp files type, and data will be *.txt type.
-
Page 26: Settings Screen
8.6 Settings Screen The settings menu is accessed by pressing the button. Chosen Selected surface algorithm Optional surface Further settings Enable full “About” button saving Manufacturer’s use only To allow the measurement of a wide range of surface finishes the Optimap has two optical configurations (models) available for selection –... - Page 27 changed the algorithm resets to the default which should be changed to the required algorithm before taking a measurement. The calibrate button functions is described in section 8.6.1. The default saving behaviour depends on the algorithm selected but usually includes the unfiltered altitude map, any filtered map (as determined by the algorithm selection), curvature maps and slope maps.
- Page 28 Band 1 filter type button Band 2 filter type button More information about the different algorithms can be found further in this manual. To change the time displayed on the instrument, and used to timestamp measurements, press the further settings button. Then press the button to open the time zone settings.
-
Page 30: Calibration
8.6.1 Calibration Before measuring with Optimap3, you must calibrate the instrument. The calibration procedure will adjust camera focus position and get results of the reference surface (a top coated glass silver mirror). To calibrate the Optimap3, you need the calibration plate provided with the instrument in the box. -
Page 31: Measurement Principle
Measurement Principle Phase Stepped Deflectometry (PSD), a white light optical technique, uses a periodic pattern with a sinusoidal waveform to measure the profile or curvature (K) of a surface. The waveform is presented to the surface using a high-resolution display and the reflected pattern captured by a high-resolution camera. -
Page 32: Measurement Algorithms
10 Measurement Algorithms All measurement algorithms use the same process to compute the altitude maps which are displayed on the main screen at the end of a measurement. The choice of algorithm depends on which numerical parameters best characterise your application and what filtering is applied to the altitude map. -
Page 33: Curvature
10.3 Curvature By filtering the curvature data, in accordance with standardised wavelength ranges as shown in the table below, curvature bands Ka…Ke, Ksw - Klw are then used to represent the SD (sigma) of surface curvatures for each wavelength range. As an overall rating, Total curvature (K), is used to represent the SD (sigma) of curvatures falling within the range 0.1 –... -
Page 34: Tams_Std
10.5 TAMS_STD The Rhopoint Total Appearance Measurement System (TAMS) is an extremely portable surface measurement device designed to give inspectors at the production line an audit tool which predicts how a customer will judge an automotive body finish in a showroom – will it yield a good or bad impression? Two new metrics are used to define the overall visual surface appearance, Quality and Harmony, replacing traditional multi-dimensional scaling’s that have caused confusion amongst automotive manufacturers in the interpretation of results for many years. - Page 35 perfectly flat, reflection without local distortion) up to 30 (very wavy surface, high distortion level). ▪ Dimension represents the main structure size perceived at 1.5m. The value is given in millimetres ranging from 0.5 to 8mm. Remark: Optimap3 has capability for others analysis methods. Rhopoint can supply custom computation algorithm for special application.
-
Page 36: How To Read *.Res File Format On Pc
11 How to read *.res file format on PC The Optimap3 can create altitude, slope, and curvature map. See above to know how to activate such saving option. To get files exported on SD card, user must perform a full export to the SD card. Then, user will find altitude (alt.res), slopeX (slox.res), slopeY (sloy.res), curvatureX (curx.res), curvatureY (cury.res). -
Page 37: Instrument Specifications
12 Instrument Specifications Display • 10-inch Colour VGA TFT Touch Screen Camera • 3.2 Megapixels, image resolution 2048 x 1536 Measurement Area • 65 x 54 mm Lateral Resolution • 37 µm Data storage • 20GB SSD • 200 readings Data Transfer •... -
Page 38: Environmental Information
Rhopoint Instruments Ltd have arranged a means for our customers to have products that have reached the end of their useful life safely recycled. We encourage all end users to us at the end of the product's life to return their purchase to as for recycling as per Article 9 of the WEEE Directive.
Need help?
Do you have a question about the Optimap PSD 3 and is the answer not in the manual?
Questions and answers