Table of Contents
Advertisement
Quick Links
Advertisement
Table of Contents

Related Manuals for Rhopoint Instruments IDTX


Summary of Contents for Rhopoint Instruments IDTX
- Page 1 Imaging Transmission Appearance Meter IDTX Operating Instructions Thank you for purchasing this Rhopoint product. Please read these instructions carefully before operating this product and retain them for future reference. The images shown in this manual are for illustrative purposes only.
- Page 2 © Copyright 2020 Rhopoint Instruments Ltd. All Rights Reserved. Rhopoint is a registered trademark or trademark of Rhopoint Instruments Ltd in the UK and other countries. Other product and company names mentioned herein may be trademarks of their respective owner.
-
Page 3: Table Of Contents
Warming Up the Unit........................ 12 Keeping the Instrument Clean ....................12 Taring the Unit ......................... 13 Measuring ASTM Haze, Sharpness, Clarity and Waviness with the Rhopoint IDTX ..... 15 Measuring the Checking Standard ..................17 Taking an In-Contact Measurement ..................18 Assessing Distance Dependency or Matching End Use Applications ........ -
Page 4: Storage And Handling
Only use approved accessories and spare parts. All spare parts are available from Rhopoint Instruments Ltd and approved distributors. Do not attempt to open the instrument. There are no user serviceable parts inside. Please contact Rhopoint Instrument or an approved distributor for your... -
Page 5: About The Rhopoint Id Imaging Transmission Appearance Meter
45mm. The instrument is supplied in 2 formats- IDTX-E: a stand-alone, low cost instrument designed for the QA environments. IDTX-L: a laboratory instrument with additional software for R&D environments. Measurements made with the IDTX-E & IDTX-L are identical. -
Page 6: Measurement Parameters
Samples with low haze have better transmission contrast and are much less visually intrusive, the viewed object has high contrast. The Rhopoint IDTX measures Haze at any distance, however at 8mm distance using the supplied haze spacer the results conform to specifications written for traditional sphere instrument which comply to ASTMD1003. - Page 7 (vertical waviness) using Rhopoint ID software. Note: Sharpness and Clarity scales are only displayed on the instrument screen when the ASTM Haze spacer is in place, to measure at varying distances the IDTX PC software (provided with IDTX-L) must be used.
- Page 8 Thin films and plastic materials often demonstrate a reduction in sharpness and increase in haze which peak with a separation distance of 2-4mm between the sample and material. Rhopoint instruments offer bespoke adaptor plates or 3D CAD models for local manufacture of 3-D printed plates.
-
Page 9: Accessories
The instrument is supplied as a standard package complete with all accessories required to power and operate the unit. IDTX-E & IDTX-L • RHOPOINT IDTX Imaging Transmission Appearance Meter • Calibration certificate • 1 x checking standards • IDTX Haze 8mm spacer •... -
Page 10: Functional Overview
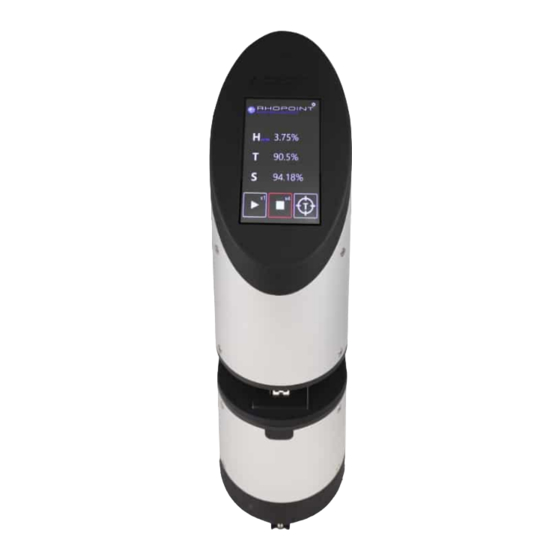
Functional Overview Display and touch-screen Camera optics Illuminated graticule Levelling feet Power socket USB socket Power button... -
Page 11: Icons Used
Icons Used S-Sharpness the blurriness of a viewed object (%). T-Visible Transmission the intensity of light from a viewed object. H-Haze the contrast of a viewed object, cloudiness, milkiness. H-Haze c Is measured with the ASTM 8mm adaptor plate in place- measurements ASTM are verified to comply to ASTM D1003. - Page 12 Adjust volume...
-
Page 13: Power
Power The Rhopoint IDTX is powered by a low voltage DC power supply connected to the instrument’s power input connector. Switching the Unit On/Off The Rhopoint IDTX has a built in CPU which takes approximately 30 seconds from power up to boot into measurement mode. -
Page 14: Taring The Unit
Taring the Unit After power up it is necessary to tare (zero) the unit. Before the unit is tared the measurement buttons are unavailable (greyed out). To tare the unit press and hold the tare symbol (3 sec) on the touch screen. - Page 15 Once taring is complete measurement buttons are available and the instrument is ready for use. Tolerance on tared values- After tare the instrument will measure the graticule as follows- (average of 5 readings after 4 min warm up period) H- 0.0% (+/- 0.1%) T- 100% (+/- 0.3%) S- 100% (+/- 0.2%)
-
Page 16: Measuring Astm Haze, Sharpness, Clarity And Waviness With The Rhopoint Idtx
Measuring ASTM Haze, Sharpness, Clarity and Waviness with the Rhopoint IDTX Place the 8mm Haze spacer on the instrument. The spacer is held in place by magnets and automatically detected by the unit. Once in place ASTM Haze measurement and Sharpness will become available on the... - Page 17 Touch the S or to toggle between sharpness and Clarity modes. The ID-L instrument also has the ability to measure waviness- press the T button* to toggle between transmission and waviness. function only available in the Rhopoint ID-L Transmission Appearance Analysis Software...
-
Page 18: Measuring The Checking Standard
Measuring the Checking Standard It is recommended that the checking standard is measured weekly or after moving or transporting the unit. Visually inspect the standard before measurement- it should be free of dust and contamination Place the standard on the instrument. The standard is held in place by magnets;... -
Page 19: Taking An In-Contact Measurement
Taking an In-Contact Measurement In-contact measurement is used to measure the optical impact on a viewed object when the sample is in direct contact. To perform a measurement, place the sample directly on to the measurement graticule. For fast easy manipulation high clarity samples with low distance dependency can be manually held and moved. -
Page 20: Assessing Distance Dependency Or Matching End Use Applications
Assessing Distance Dependency or Matching End Use Applications To measure distance dependency the sample should be spaced away from the platen. It is recommended that the optional Rhopoint IDTX spacers are used. Multiple spacers can be stacked to achieve the required distances. -
Page 21: Measuring Astm Haze & Sharpness
Measuring ASTM Haze & Sharpness To measure ASTM Haze & sharpness the ASTM Haze spacer should be placed in position and the sample placed on top. Measuring with the ASTM haze spacer in place is often the default method for many applications. -
Page 22: Starting A Measurement - Single Reading
Starting a Measurement – Single Reading To initiate a single measurement- press the single read button on the touch screen. The instrument will initiate a reading and report the result. - Page 23 To view the waviness* and Clarity results for the same sample, press the T* or S icons to toggle the viewed values. function only available in the Rhopoint ID-L Transmission Appearance Analysis Software...
-
Page 24: Starting A Measurement - Multipoint Average
Starting a Measurement – Multipoint Average The Rhopoint ID can calculate statistics for a measured batch of readings. To select the batch size click on the X3 number in the top corner of the middle button. The unit has preset batch sizes of 3,4,5,10 or ∞. To initiate a multipoint measurement- press the middle button on the touch screen. - Page 25 The instrument will initiate a reading and report the result. The instrument introduces a delay before starting the first measurement and between readings- this allows the user time to manipulate the sample. To finish an ∞ batch press the stop button, the instrument will report the statistical analysis for the measured samples.
-
Page 26: Settings Menu
Settings Menu To access the settings menu press the settings menu icon. To power off the instrument press & hold the power icon. To adjust the volume of the audible signal, use the volume slider. To return to measurement screen press home icon. “Unlock Keys”... -
Page 27: Rhopoint Id-L Transmission Appearance Analysis Software
Double click on the setup.exe located in the IDTX folder to install. PLEASE NOTE THAT DURING INSTALLATION YOUR PC MAY RESTART WITH NO WARNING, ENSURE ALL WORK IS SAVED BEFORE PROCEDING Setup Once installed the software will automatically run and the IDTX folder can be deleted from the desktop. -
Page 28: Connecting The Instrument To The Pc
Connecting the Instrument to the PC Direct connection: use the provided USB 2.0 (or similar) adaptor to connect the Rhopoint ID to the PC using the provided ethernet cable. USB 2.0 to Ethernet Connector... - Page 29 LAN Connection: the software can operate multiple instruments which are connected to a local network. Connect the instrument directly to the required network using the provided ethernet cable (or similar). Local Area Network...
-
Page 30: Using The Idtx Sofware On Multiple Screens
Using the IDTX Software on Multiple Screens Rhopoint IDTX Software supports the use of multiple screens for operation, viewing and manipulating data, comparing images and viewing graphs. For effective data analysis it is preferable to run the software on a PC with multiple... -
Page 31: Setting Up The Connection
PLEASE NOTE THAT DURING INSTALLATION YOUR PC MAY RESTART WITH NO WARNING, ENSURE ALL WORK IS SAVED BEFORE PROCEDING Setup Once installed the software will automatically run and the IDTX folder can be deleted from the desktop. Setting Up the Connection 1. - Page 32 2. Now expand the settings tab on the PC software. 3. Type the identifier from the instrument set up screen into the ident box on the PC software- then press “connect” 2.PRESS CONNECT Instrument settings screen ID Software settings screen NOTE: If the instrument is connected via a LAN the text .local may need to be added directly after the instrument serial number (no space) The instrument and software will connect- the TARE button on the instrument and software...
-
Page 33: Navigating The Id Software
Navigating the ID Software ID Instrument View The left panel in the instrument software replicates the touch screen of the instrument and has similar functionality. Interacting with software instrument view screen will change the on screen display and vice-versa, the information remains synchronizedsyncronised during operation. -
Page 34: Id Results Table
ID Results Table The center Panel of the software contains the results for all measurements taken in the current batch. The bottom section contains statistics for all the results listed in the table. View a Measurement Clicking a previously taken measurement in the table will update the ID Instrument View and the ID Setting and Live View with the results and image for the selected measurement. - Page 35 Display Graph Select the parameters for graphing by clicking the header in the results table. Click on the Graph tab A graph of the selected parameters is displayed. Customise the Results Table Parameters The Results Table can be customized to any selected results or comments from the Full Data Table.
- Page 36 Clicking on the tick box in the top corner of any parameter will include/exclude it from the ID Results Table.
- Page 37 Full Data Table- all measurement Parameters Sharpness, Clarity & Haze parameters are calculated from image analysis of 7 areas of the target graticule. Haze Symbol Parameter Calculation Haze Average of H & H Horizontal Average of Haze Vertical Average of Haze Horizontal Calculated using Michelson...
- Page 38 Horizontal Calculated using edge Sharpness spread function of vertical H1,H2,H3,H4 graticule edges Vertical Calculated using edge Sharpness spread function of horizontal V1,V2,V3 graticule edges Waviness Average of W & W Horizontal Average of Waviness Vertical Average of Waviness Horizontal Calculated using edge Waviness deformation analysis H1,H2,H3,H4...
- Page 39 Transmission Transmission values are calculated using the following zones Symbol Parameter Calculation Transmission Pixel intensity full graticule area/ Pixel intensity tare image Transmission zone 1 Pixel intensity area T / Pixel intensity T tare image Transmission zone 2 Pixel intensity area T / Pixel intensity T tare image...
- Page 40 User Defined Columns The Rhopoint ID software has 6 fields where customers can input their own process data to improve traceability during data analysis. The first column has a fixed name “Comments” all other fields can be named by the user- these names will be transferred to the data output .csv.
- Page 41 Add measurement distance- To add a measurement distance to the measurement data the distance text box should be used. Add a comment- To add a comment to the measurement data the comments text box should be used. As each new measurement is taken it is added to the bottom of the table.
- Page 42 Save/Export Data- To save the readings and all associated images, click the SAVE Project button (PRJ) or to save the data only press the SAVE CSV button Delimiter- The data will be saved with the selected delimiter- this can be changed using the drop down menu to suit regional PC settings.
- Page 43 When saving a CSV it will be a single file containing all of the data. Load measurements- To load additional data into the table, press the LOAD Project or CSV button, this data is added to the bottom of the data table, use this feature to combine and compare batches.
-
Page 44: Idtx Software - Live-View And Captured Images
The live-view is useful for positioning samples before measurement. Note- With live view switched on it is not possible to view images of saved measurements. IDTX Software – Visual Analysis of Results: Sharpness Click in the data table to select images of previous measurements. -
Page 45: Idtx Software - Visual Analysis Of Results: Haze
The images recorded by the IDTX meter are correlated to the viewing sensation when observing an object through the test material. Sharpness - The graticule has a visual scale for comparison and visualisation of Sharpness. High Sharpness - Sharp view of object (S-95%) In the (above) captured image the lines in frequency pattern 6 are visible and undistorted.-... -
Page 46: Idtx Software - Visual Analysis Of Results: Waviness
High Haze (28.35%)- The material has a white or milky appearance; the viewed object has low contrast. The black and white graticule squares have less contrast and appear greyer. IDTX Software – Visual Analysis of Results: Waviness Plastic materials can exhibit local surface effects such as orange peel which can be seen as small waves when a pattern or object is viewed through the material. -
Page 48: Idtx Software - Expanding The Viewing Window
IDTX Software – Expanding the Viewing Window Click on the + icon to expand the image window. The image for the measurement selected in the data table is expanded Sharpness is calculated from average of 7 individual zones. It is possible to view the Sharpness for each individual zone using the toggle buttons on the right. - Page 49 Click on the compare icon in the expanded image window. The software will replicate and fix the current view. Multiple windows can be opened to visually compare different materials.
-
Page 50: Idtx
IDTX Notes... - Page 51 EU DECLARATION OF CONFORMITY Rhopoint Instruments Ltd, Rhopoint House, Enviro 21 Park, Queensway Avenue South, St Leonards on Sea, East Sussex, TN38 9AG DECLARE UNDER OUR SOLE RESPONSIBILITY THAT THE PRODUCT ID Imaging Transmission Appearance Meter TO WHICH THIS DECLARATION RELATES ARE IN CONFORMITY WITH THE...
Need help?
Do you have a question about the IDTX and is the answer not in the manual?
Questions and answers