
Related Manuals for Gardner Denver Governor TEN014983


Summary of Contents for Gardner Denver Governor TEN014983
- Page 1 13-17-621 Version: 01 September 28 , 2020 Governor™ Controller USER’S MANUAL Rotary Screw Compressor Application...
- Page 2 WARNING – PROHIBITION – MANDATORY LABEL INFORMATION Gardner Denver compressors are the result of advanced engineering and skilled manufacturing. To be assured of receiving maximum service from this machine, the owner must exercise care in its operation and maintenance. This book is written to give the operator and maintenance department essential information for day-to-day operation, maintenance and adjustment.
- Page 3 Indicates a hazard with a medium level of risk which, if not avoided, COULD result in death or serious injury. Asphyxiation Hazard – Poisonous Fumes or Toxic Gases in Compressed Air Indicates a hazard with a low level of risk which, if not avoided, MAY result in a minor or moderate injury.
- Page 4 SAFETY PRECAUTIONS Safety is everybody’s business and is based on your use of good common sense. All situations or circumstances cannot always be predicted and covered by established rules. Therefore, use your past experience, watch out for safety hazards and be cautious. Some general safety precautions are given below: Failure to observe these notices will result in injury to or death of personnel.
-
Page 5: Table Of Contents
TABLE OF CONTENTS SECTION 1 REVISION HISTORY ........................ 8 SECTION 2 GENERAL ..........................9 2.1 Components and Layout ........................9 2.1.1 Display ............................9 2.1.2 IO Module ........................... 10 2.1.3 Cellular Module ........................... 11 2.2 Features and Method of Control ......................11 2.3 Hardware Specs .......................... - Page 6 4.2.11 Auto Restart Enable ........................64 4.2.12 Dryer Pre-Run Time ........................64 4.3 Configuration ............................. 65 4.3.1 Locale ............................66 4.3.2 Date & Time ..........................68 4.3.3 Communication ........................... 69 4.3.4 Security ............................71 4.3.5 Advanced ............................ 72 4.4 Sequencing ............................74 4.4.1 Sequencing Types: ........................
- Page 7 4.7.5.2 Fan Control: ........................... 114 4.7.5.3 Fan Shutoff Delay: ......................... 114 4.7.6 PID Tuning: ..........................115 4.7.7 Backup / Restore: ........................115 SECTION 5 ALARMS ..........................117 5.1 Active Alarm ............................ 118 5.1.1 Contact Info: ..........................161 5.1.2 Info: ............................161 5.2 Alarm History ...........................
-
Page 8: Section 1 Revision History
SECTION 1 REVISION HISTORY Version Date Notes February 23 , 2019 First release September 28th, 2020 Added Sections and details to manual 13-17-621 Page 8... -
Page 9: Section 2 General
SECTION 2 GENERAL The Gardner Denver Governor™ controller is an advanced electronic control system designed to provide efficient and user friendly operation of your Gardner Denver compressor. This manual describes the controller specifications and operation on Gardner Denver rotary screw compressors. -
Page 10: Io Module
2.1.2 IO Module The IO module is mounted inside the compressor control cabinet and connects to the display via RS485 communications and houses all of the terminations for the analog and digital input and output signals. These values are monitored and controlled by the display to operate the compressor. The IO module also contains RS485 communications ports for customer connection and sequencing with multiple machines. -
Page 11: Cellular Module
Modbus and remote interfaces are provided to monitor the machine. 2.3 Hardware Specs 2.3.1 Display Module The display is a customized module, designed and developed for Gardner Denver. Figure 4: Oblique View & Figure 5: Rear View below shows the Oblique and Rear View of Display Module. 13-17-621... - Page 12 Figure 4: Oblique View Figure 5: Rear View 13-17-621 Page 12...
-
Page 13: Technical Data
2.3.1.1 Technical Data: Table 1 below details the technical data of the display module. Table 1: Display Module Technical Data General Information Cooling Passive Reset button Status Indicators Supply voltage OK, operating state, module status, Ethernet, CAN Rx/Tx, RS485 Rx/Tx Certification Interface Interface IF1... -
Page 14: Diagnostics Leds
Operating conditions Installation elevation above sea level 0 to 2000 m No limitation >2000 m Reduction of ambient temperature by 0.5°C per 100 m Ambient Conditions Temperature Operation -20 to 60°C Storage -25 to 70°C Transport -25 to 70°C Relative humidity 5 to 95%, non-condensing Mechanical Properties Front... -
Page 15: Reset Button / Operating Modes
The Reset button is reserved for system operations such as setting the system into different boot modes. Do not use the reset button unless directed by Gardner Denver Service. Location of reset button is shown just for reference purpose below in Figure 7. - Page 16 Table 3: CAN bus and RS485 CAN BUS CONNECTION Terminal Assignment Interface Function CAN_H CAN High Ground CAN_L CAN Low DATA Data Ground DATA\ Data inverted Ethernet Interface Figure 10 below shows the Ethernet Interface and Figure 10: Ethernet Interface Table 4 lists the Ethernet pinouts and signal diagnostics of the Ethernet port LEDs.
-
Page 17: Io Module
Assignment Explanation 24 VDC 2.3.2 IO Module: Gardner Denver uses a series of IO modules based on machine configuration. 2.3.2.1 Technical Data: In the Table 7 below the technical data of the IO module is listed. Table 7: IO Module... - Page 18 Input I/O Power Supply Connection X07, X08, X09 X07, X08 X07, X08, X09 X07, X08 designation Input voltage 24 VDC -25%/+30% Fuse Required line fuse: Max. 10 A, slow-blow Interfaces Interface IF2 Conn designation X02 RS485 Signal RS485 Max. distance 1200 m Transfer rate Max.
-
Page 19: Wiring
Temperature Operation -10 to 60°C Storage -20 to 70°C Transport -20 to 70°C Relative humidity Operation 5 to 95%, non-condensing Storage 5 to 95%, non-condensing Transport 5 to 95%, non-condensing Mechanical Properties Dimensions Width 190 mm Height 198 mm Depth 31 mm 2.3.2.2 Wiring: Unshielded Lines:... -
Page 20: Status Led
2.3.2.3 Status LED: Figure 14: IO Module LED Status and Diagnostics 2.3.2.4 Connection Interface: Power Supply (X01) Figure 15 and Table 8 below shows the connector (GD Part ) used for power supply TEN014969 connections and pinout to signal details. Figure 15: Power Supply (X01) Table 8: Power Supply (X01) Power Supply... -
Page 21: Terminal Block Connections
Table 9: RS485 (X02) RS485 Connections Signal Name B(+) - DATA A(-) - DATA C - GND RS485 Interface (X03) Only shielded cable must be used. Available only with IO Modules TEN014983 & TEN14980. Figure 17 below shows the connector (GD part used for RS485 connection and Table 9 for TEN014971) connector pin number to signal details. - Page 22 Figure 19: Digital Inout (X05) Table 11: DI (X05) Digital Input (X05) Connections Signal Name V+ or GND DI01 (counter input) DI02 DI03 DI04 Digital Inputs (X06) Figure 20 below shows the connector (GD part ) used for X06 Digital Input connections and TEN014974 Table 12 for connector pin to signal details.
- Page 23 Table 13: DO (X07) Digital Output (X07) Connections Signal Name DO01 DO02 DO03 DO04 Digital Outputs (X08) Figure 22 below shows the connector (GD part ) used for X08 Digital Output connection and TEN014977 Table 14 for connector pin to signal details. Figure 22: Digital Output (X08) Table 14: DO (X08) Digital Output (X08) connections...
- Page 24 Analog Outputs (X10) Only shielded cable must be used for analog output connections. Figure 24 and Table 16 shows the connector (GD part ) used and connector pin to signal details for the systems with 2 analog TEN014961 output designs with IO module part numbers TEN014983 & TEN014980. While, Figure 25 and Table 17 shows the connector (GD part ) used and connector pin to signal TEN014960...
- Page 25 Table 18: AI (X11) Analog Input (X11) Connections Signal Name +24 V_AI AI01 +24 V_AI AI02 +24 V_AI AI03 +24 V_AI AI04 +24 V_AI AI05 +24 V_AI AI06 4 Analog Input Configuration Available with IO module part number TEN014980. Figure 27 below shows the connector (GD part TEN014965) and Table 19 connector pin to signal details for 4 analog input designs.
- Page 26 Table 20: AI (X11) Analog Input (X11) Connections Signal Name +24 V_AI AI01 +24 V_AI AI02 +24 V_AI AI03 PT1000/PTC Inputs (X12) Only shielded cable must be used for PT1000/PTC inputs. Based on the system design there are three types of connections used for PT1000/PTC input signals. Following are the details. Available with IO Module part numbers TEN014982 &...
- Page 27 Figure 30: PT1000/PTC Inputs (X12) Table 22: PT1000/PTC (X12) PT1000/PTC (X12) Connections Signal Name +PT1000 01 -PT1000 01 +PT1000 02 -PT1000 02 +PT1000 03 -PT1000 03 +PT1000 04 -PT1000 04 Available with IO Module part number TEN014981. Figure 31 shows the connector (GD part TEN014963) used and Table 23 have the connector pin to signal details.
- Page 28 Table 24: PT1000/PTC (X13) PT1000/PTC (X13) Connections Signal Name +PTC 01 -PTC 01 +PT1000 08/+PTC 02 -PT1000 08/-PTC 02 Available with IO Module part number TEN014982. Figure 33 shows the connector (GD part TEN014962) used and Table 25 have the connector pin to signal details. Figure 33: PT1000/PTC Inputs (X13) Table 25: PT1000/PTC (X13) PT1000/PTC (X13) Connections...
-
Page 29: Section 3 Quick Start
SECTION 3 QUICK START This section provides the basic information on the controller so that the user can understand how to interact with and operate the machine. It focuses only on the common elements of the user interface and the settings and actions that are required to get the compressor running and producing air. -
Page 30: Buttons And Switches
Alarms system to determine the cause and resolve the fault condition. 6. The Gardner Denver Logo is present in the bottom right of every screen. Pressing this will navigate back to the Home screen from any screen in the system. -
Page 31: Scroll Elements
also be locked because the current machine status does not allow the action, or the action is not applicable to the machine configuration. On / Off switches are used for settings that can be enabled / disabled. If the item is disabled, or off, the switch will show “Off”... -
Page 32: Settings And Input Elements
Figure 39: Scroll Button Example 3.1.3 Settings and Input Elements The system uses several styles for elements that are used to show and change settings or other user interface controls. 3.1.3.1 Dropdown Boxes Dropdown selections allow the user to select an item from a pre-defined list of available options. An example is shown in Figure 40 below. -
Page 33: Value Settings
3.1.3.2 Value Settings Value boxes display a numerical or text value. Pressing on the box will bring up a number or text entry keypad. An example of a numerical value setting and keypad is shown below in Figure 41. Figure 41: Number Keypad Keypad entry operation is described below: ... -
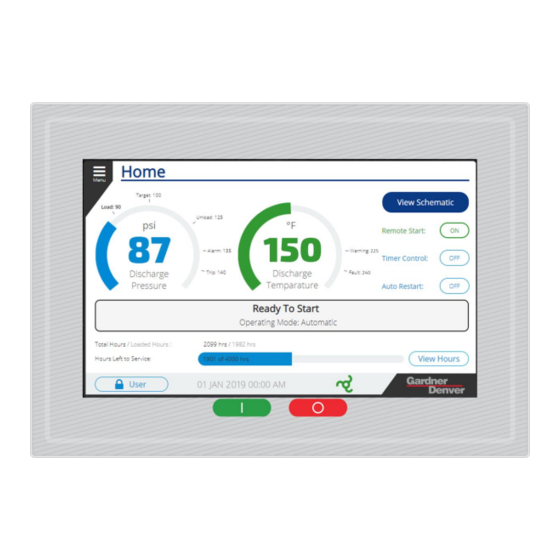
Page 34: Home Screen
Figure 42: Text Keypad 3.2 Home Screen The Home screen is the primary screen for operation of the machine. It displays machine status messages, pressure and temperature readings, essential settings, and maintenance status. Figure 43 below shows the Home screen with each element defined. Figure 43: Home Screen Elements Additional details on each of the home screen elements are provided below: 1. - Page 35 If the pressure is below the load pressure setting, it will be displayed in blue: If the pressure is above the Load pressure and less than the Warning pressure setting, it will be displayed in green: If the pressure is between the Warning and Fault pressure settings, it will be displayed in yellow: If the pressure is above the Fault pressure setting, it will be displayed in red: 2.
-
Page 36: Screen Saver
3. The View Schematic button is used to navigate to the Schematic screen. This provides a graphical representation of the machine operation and status. 4. The Control Settings Indicators area of the screen shows the current status of the control settings that control the machine operation and starting / stopping of the machine. -
Page 37: Schematic Screen
Figure 44: Screen Saver 3.3 Schematic Screen The Schematic screen shows a graphical summary of the machine operation, status, and data. It is accessed from the Home screen by pressing the View Schematic button. Figure 45 below shows the main Schematic screen view with a summary of the elements. - Page 38 Figure 45: Schematic View The main elements of the schematic view are described below: 1. The View Home button returns the user to the Home screen. 2. The Delivery pressure is shown in large text on the right of the screen in the default view. 3.
- Page 39 Figure 46: Airend Focus View If an element of the machine is in a warning or fault state, the element will be highlighted in yellow or red accordingly. For example, in Figure 47 below, the air filter service timer has expired, so the Air Filter element is highlighted in yellow.
-
Page 40: Navigation Menu
3.4 Navigation Menu The Main Menu provides quick access to all screens on the system. Subcategories of the Main Menu will expand when selected if there are multiple screens available. Pressing the Menu button in the upper left corner of the screen will deploy the Menu, as shown in Figure 48 below. -
Page 41: Logging In
Figure 49: Menu Cascade 3.5 Logging In Before making any changes to the settings on the controller, you must log in with an appropriate access level. The current access level is indicated by the User button on the Status Bar in the bottom left of the screen as shown in Figure 50 below. -
Page 42: Setting Up
This password should only be required under unusual circumstances and must be provided by Gardner Denver Technical Support. Note that the passwords can be changed from the default using the Adjustments button on the left of the screen once logged in. - Page 43 Figure 53: Locale Configuration It is important to verify that the Date, Time, and Time zone are set properly for the site. The date and time are relied on for logs, timer control, trends, etc. Setting the time zone properly ensures that daylight savings time adjustments will be accounted for automatically.
-
Page 44: Control Settings
Figure 55: Timezone Selection 6.2 Control Settings The settings under the Control Menu determine how the machine operates to match the process requirements of the customer. The default settings of the machine are acceptable for most installations. However, if the Pressure Band displayed on the gauge on the Home screen does not match the desired pressure range for the site, the Pressure Band must be adjusted. -
Page 45: Clearing Alarms
The p1 Pressure Band Setting screen is shown in Figure 57 below. The bar graph gives a visual indication of the pressure band settings. Press the numerical value boxes to make adjustments as needed. Note that the minimum and maximum values that will be allowed for each box will change dynamically based on the design pressure of the machine as well as the values of the other settings. -
Page 46: Jogging The Motors
Figure 58: Active Alarms Screen 3.8 Jogging the Motors If this is the first time that the machine has been started after being connected to power, the motors must be jogged to verify correct rotation. To do this, you must be logged in as a Technician. After logging in, navigate to Diagnostics >... -
Page 47: Operating The Compressor
3.9 Operating the Compressor The compressor is now ready to operate. This section gives a basic overview of how to operate the machine. 9.1 Starting From the home screen, the Message Status Bar should display “Ready to Start” as shown in Figure 60. Figure 60: Home Screen Ready to Start Press the Start button on the display directly below the screen. -
Page 48: Stopping
Figure 61: Home Screen Enabled 9.3 Stopping To stop the machine, press the Stop button directly below the screen. The machine will go through a soft stop process where it is depressurized before stopping. When the Stop button is pressed, the inlet valve will close immediately (if the machine is currently loaded) and the Message Status Bar will display that the controller is stopping as shown in Figure 62. -
Page 49: Emergency Stop
The progress of the stopping process is shown on the Message Status Bar. The time value shown (for example, “20 seconds”), is the time remaining on the minimum stop timer. The pressure value shown is the amount of pressure in the reservoir that must be vented for the system to be depressurized, or blown-down, to the appropriate value for the machine. -
Page 50: Section 4 Settings
SECTION 4 SETTINGS This section details each of the menus in the controller settings and the parameters that can be modified for the machine. The Settings menu is sub-categorized into Service, Control, Configuration, Sequencing, Timer Control, Programmable I/O, and Advanced. Refer below to Table 29 for a quick link to each section. Table 29: Settings Settings 4.1 Service... -
Page 51: Dashboard
Figure 63: Service Menu Figure 63 above shows the Service menu and its sub-menus: Dashboard and Distributor Info. 4.1.1 Dashboard The Service Dashboard screen lists the Hours/Days/Months remaining for different machine elements that require changing after a specific time period. Figure 64 shows the Service Dashboard. Figure 64: Service Dashboard Each parameter has a gray bar that will change color based on the percentage of time remaining until a change is required for the specific element. - Page 52 Service life greater than 15 days: Service life between 14 days to 7 days: Service life less than 7 days: Values of the parameters can be reset to default at any time. To change the value hit the box on the left side of the timer bar.
-
Page 53: Set Intervals
Figure 66: Hours Left to Service To reset all the parameters use the Select All button to reset all parameters at the same time. Then hit the Reset button on the next screen. 4.1.1.1 Set Intervals: While the bar graph shows how much time is left for the next service, the rectangular box on the right end of each bar is the service interval time setting. -
Page 54: Presetting A Timer Value
Figure 68: Set Intervals All other service elements will be set or changed using the same logic as above. 4.1.1.2 Presetting a Timer Value In some circumstances it is necessary to set the value of time remaining on a maintenance timer. For example, when replacing a controller in the field the timer values will need to be set to match the actual time remaining before they need to be changed. -
Page 55: Distributor Info
Figure 70: Hours Since Service Once done hit the Green Check, followed by the Set button in next screen to confirm the new timer. Note: confirming and saving values from the pop-up number pad and keyboard will be the same throughout this manual and will not be referenced again. -
Page 56: Control
Figure 72: Distributor Info 4.2 Control Table 31 below lists the settings available under the Control submenu of Settings. Table 31: Control Setting Control Settings Setting Settings Available Short Description User can set and select the operating mode between Automatic, Sequencing, Constant, and Low Demand. -
Page 57: Operating Mode
Navigate to the Control menu by selecting Settings then Control. The Control Settings screen is shown in Figure 73 below. Figure 73: Control Settings Use the scroll bar at right to scroll through and select the different control parameters to change, edit, or save. -
Page 58: P1 Pressure Band
Automatic Mode This is the default operating mode, where the machine attempts to regulate in the most efficient manner possible. The capabilities of the machine and profile of the compressed air demand will be utilized by the controller in this operating mode. In periods of light demand the compressor motor will be automatically stopped to save energy. - Page 59 is the secondary pressure band which defines alternative pressure set points that can be activated by a timer or control input. Both pressure band settings use the same type of interface and data entry, described below. The p1 Pressure Band defines the default pressure set points of the compressor. The p1 Pressure Band Settings screen will look like Figure 76 below.
-
Page 60: P2 Pressure Band
Figure 77: p1 Pressure Band Note that there is a certain limit that can be set for each of the pressure values. For example, the Target pressure minimum is 100 psi which is the Load Pressure Value. If you want to set the Target pressure below 100 psi then the Load pressure needs to changed first and it should be set lower than the Target pressure. -
Page 61: Control Mode
Figure 78: p2 Pressure Band The user can switch to the Primary Pressure Band screen by hitting the View p1 button available on the screen. 4.2.4 IV Control Mode These settings are only available on machines that have inlet valve modulation capability. The way the inlet valve is controlled can be changed here between load/unload and modulation. -
Page 62: Timer Start Enable
Figure 79: Remote Halt Mode Timed mode means the compressor will stop after the unload, blowdown, and automatic stop timers have expired upon receiving a remote halt signal. The compressor will act as if the pressure exceeded the unload set point. If the remote halt signal is removed at any point the compressor will re-load, as long as the pressure is not above the unload pressure set point. -
Page 63: Restart Delay Time
4.2.7 Restart Delay Time The Restart Delay Time sets the amount of time the controller will wait before restarting operation after a power failure has occurred. The user can input the desired value on the number pad. Refer to Figure 81 below. -
Page 64: Unlimited Power Loss Time
Figure 83: Max Power Loss Time 4.2.10 Unlimited Power Loss Time When the Unlimited Power Loss Time is turned On the Max Power Loss Time setting will be disabled and the controller will allow the machine to restart regardless of the duration of the power failure. 4.2.11 Auto Restart Enable Auto Restart Enable can be toggled on or off by pressing the button show below in Figure 84. -
Page 65: Configuration
Figure 85: Dryer Pre-Run Time When the compressor is started by local or remote control, it will activate the dryer start programmable output and then wait for the duration of the Dryer Pre-Run Time before starting the compressor motor. 4.3 Configuration Table 32 below gives a brief overview of the available configuration settings. -
Page 66: Locale
Figure 86: Configuration Menu Selection 4.3.1 Locale Under the Locale configuration menu the user can select the units used for different machine data such as the pressure, temperature, and flow. Pressure Units: With the drop down menu, the user can select the pressure units between bar and psi, as shown in Figure 87 below. - Page 67 Temperature Units: The User can set the temperature units to either °C or °F as shown in Figure 88 below. Figure 88: Temperature Units Flow Units: The User can set the flow units between m^3/min, m^3/hr, and cfm as shown in Figure 89 below. Figure 89: Flow Units 13-17-621 Page 67...
-
Page 68: Date & Time
4.3.2 Date & Time This screen has seven parameters which can be edited with the pop-up keypad/dropdown menu. These Date and Time parameters are: Year, Month, Day, Hour, Minute, and Second values as well as the Time zone. Figure 90 shows the Date & Time configuration settings screen. Note, the Timezone should be set before editing the other Date &... -
Page 69: Communication
4.3.3 Communication There are three communication protocol sub-menus available on the Communication screen: Ethernet, RS485 0, and RS485 1. Note, certain machine configurations will show an additional RS485 port labeled RS485 2, which will have identical settings to the RS485 1 port. Ethernet: Under Ethernet settings, the following parameters can be set: Ethernet Configuration Mode between Static and DHCP from drop down menu, IP Address with number pad entry, Subnet Mask with number... - Page 70 ES+ Protocol is designed to optimize systems of machine with turn valve or inlet valve Sequence – ES+ modulation. The system will automatically rotate the lead of the system and vary modulation across all of the machines to save energy. Modbus Master The machine will be assigned as a Master in the sequence.
-
Page 71: Security
Node ID: The Node ID is the Modbus address of the device when set to Modbus slave. Byte Swap: Byte Swap changes the order of bytes or endianness of the data in a 16-bit Modbus register. RS485 1: RS485-1 has the same type of settings and screens as RS485-0. The location of each of these communication ports are shown in the middle of the screen when selecting the various tabs at the top. -
Page 72: Advanced
Figure 96: New Password Once done hit the Change Password button and another screen will come up confirming the password has changed as is shown in Figure 97. Figure 97: Change Password On the Security home screen, if the user hits the Reset Password button, the password will be reset to the factory default password values for the Technician and Maintenance login. - Page 73 Gardner Denver service or engineering. One can select the required logging level with the drop down menu as shown in Figure 98 below. Figure 98: Logging Level Firewall Status: The Firewall Status setting can be either enabled or disabled with the toggle button. Figure 99 below shows the Firewall Enable status.
-
Page 74: Sequencing
The Gardner Denver Governor™ controller is capable of communicating with several different generations of Gardner Denver controls to allow multi-machine sequencing of new and existing Gardner Denver equipment. Depending on the protocol selected, up to 4 or 8 machines may be sequenced on a single installation without the use of a master controller. -
Page 75: Airsmart Protocol
The AirSmart protocol is the native protocol for fixed and variable speed compressors using the AirSmart or AirSmart G2 controller. If you are connecting to other Gardner Denver compressors with these controllers, the AirSmart protocol should be used to allow for direct and optimal sequencing control. The AirSmart protocol is uniquely designed to handle sequencing and load sharing of variable speed compressors or a mix of up to 8 variable speed and fixed speed machines. -
Page 76: Delcos Protocol
4.4.3 Delcos Protocol: The Delcos protocol is the native protocol for Gardner Denver machines using the GD Pilot, GD Pilot TS, GD Pilot XTC, Delcos Pro, Delcos XL, and Delcos XXL controllers. If you are connecting to other Gardner Denver compressors with one of these controllers, this is the protocol that should be used. It is also the protocol to select if you are using a Gardner Denver Connect 12™... -
Page 77: Timer Start Stop
Figure 104: Timer Control Time can also be set from the Settings > Configuration > Locale menu. Refer to Section 4.3.2 for more details, the same logic to change these settings applies. 4.5.1 Timer Start Stop: Hit the Timer Start Stop button and it will bring the user to the Timer Config settings. As you can see in Figure 105 below, all the channels are set to off. - Page 78 Figure 106: Set Channel 2 User can set the Start Time, Stop time, and Days of the week for compressor operation. We are setting Start time as 08:15, Stop Time 16:45 and days as Mo (Monday), We (Wednesday), Fr (Friday) and Sa (Saturday), for example.
-
Page 79: Press Band P2 Timer
Figure 108: Timer On Note that any channels with overlapping time will be treated as a continuous timer value. Press the Schedule button to view the current schedule of operation. The green areas shown on the schedule screen are the times when the compressor will be active, shown in Figure 109 below. Figure 109: Schedule View 4.5.2 Press Band p2 Timer: The Press. - Page 80 Figure 110: Timer Control Pressing the button will bring the user to Timer Config screen for Timer Pressure Band p2 as shown in Figure 111 below, all the channels are set to Off. We can set up to 8 different sets of time and days labeled as channels.
- Page 81 Figure 112: Set Channel 2 The User can set the Start Time, Stop time, and Days of the week for compressor operation. We are setting Start time as 22:30, Stop Time 07:30 and days as Mo (Monday), We (Wednesday), Fr (Friday) and Sa (Saturday), for example.
-
Page 82: Programmable I/O
Figure 114: Timer Pressure Band p2 On Note that any channels with overlapping time will be treated as a continuous timer value. Press the Schedule button to view the current schedule of operation. The green areas shown on the schedule screen are the times when the compressor will be active, shown in Figure 115 below. Figure 115: Schedule View 4.6 Programmable I/O The Programmable I/O settings menu allows the user to assign different digital and analog inputs and... -
Page 83: Digital Inputs
Table 36: Programmable I/O Programmable I/O Settings Setting Sub-Menu Short Description The User can enable or disable and assign digital input 4.6.1 Digital Inputs: signals to available channels. The User can enable or disable and assign digital output 4.6.2 Digital Outputs: signals to available channels. - Page 84 Figure 117: Setting Channel Figure 118: Setting Signal Active High and Active Low Signal In the system, digital signals are specified as either Active High or Active Low . An Active High signals means the function that is assigned to the pin will be active if there is a positive voltage on the input.
- Page 85 Table 37: Digital Inputs Digital Input Signals Signal Name Function This function can be used to stop the machine using a digital input. The method used to stop the machine will depend on the Remote Halt Mode setting, which can be either Timed or Immediate.
-
Page 86: Digital Outputs
This function is used to delay opening the inlet valve on a compressor until it becomes OK to Load active. This function is used to monitor Gardner Denver automatic motor lubrication systems. Motor Lubrication A set of controls and monitoring logic is tied to this input that monitor the automatic System lubricator for proper operation and fault signals. - Page 87 Figure 119: Digital Outputs Active High and Active Low Signal In the system, digital signals are specified as either Active High or Active Low . An Active High output means that the pin assigned to the output will be turned on when the function assigned to the pin is active.
-
Page 88: Temperature Inputs
External Reset Reset All button on the Alarm page used to acknowledge faults and warnings. This signal is used to control Gardner Denver automatic motor lubrication systems. Motor Lubrication Use of this output should always be combined with the Motor Lubrication digital input function for monitoring. -
Page 89: Analog Inputs
Table 39 below lists the signals available on the Temperature Inputs screen and a brief description of their function. Table 39: Temperature Inputs Temperature Inputs Signal Name Function This temperature signal monitors the temperature after the air-oil separator. If assigned, the controller will monitor this input for temperature-based warnings and Separator Temperature faults using the same warning and fault levels configured for the machine discharge temperature. -
Page 90: Analog Outputs
This input can be used to control the speed of a variable speed compressor. If the input is at 4 mA, the controller will run the motor at the minimum speed possible for the current conditions. If the input is at 20 mA, the controller will run the motor at the maximum speed Remote Speed possible for the current conditions. -
Page 91: Advanced
4.7.1 Setup: These settings are intended to be set/modified by authorized personnel having the Technician and Factory Login. Please contact Gardner Denver for assistance if you are not sure about these settings. Figure 123 shows the Advanced Setup home screen. -
Page 92: Model
Figure 123: Advanced Setup 4.7.1.1 Model: The Model button on the advanced setup menu brings the user to the Machine Definition and Configuration files selection screen. This is where machine configurations are loaded based on the system requirements and type of machine being set up. Hit the Model button on the Setup home screen as shown in Figure 123: Advanced Setup above. - Page 93 Figure 124: Model Setting The drop down menu on the left hand side of this screen lists two options as shown in Figure 125: Machine Def Files and Machine Config Files. The left side of this screen lists all of the different Machine Def Files or Machine Config Files, depending on which is selected from the drop-down menu.
- Page 94 Figure 126: Model Setting Figure 127: Model Setting Once the desired file is selected under each of the options from the drop down menu, hit the Load Button to load the file to the machine. Once the file is loaded, the user can confirm from the bottom right message box that the correct file is loaded.
-
Page 95: Serial Number
4.7.1.2 Serial Number: The Serial Number of the compressor will be entered in this location. This serial number is used in various places including the data logs for the machine. The serial number is set at the factory and can be used as a reference to the machine when needing information or replacement parts. -
Page 96: Oil Type
Figure 129: Max Volume Flow 4.7.1.5 Oil Type: The Oil Type setting is used to specify the oil used in the compressor. There are two types of selections available: Standard and High Temp. This should be set to match the type of oil used in the machine. Figure 130 shows the drop down menu of Oil Type. -
Page 97: System Voltage
9000SP or similar lubricant. High Temp: Oil Change Timer counts down more slowly at high temperature. Use with AEON 9000TH or similar lubricant. Table 43: Oil Change Multipliers Oil Change Multipliers Oil Aging Clock Standard Oil Temperature High Temp Oil Temperature Multiplier Break Points Break Points... -
Page 98: Elevation
Figure 132: Motor SFA 4.7.1.8 Elevation: The Elevation setting is the height above sea level of the geographical location where this unit (compressor/motor) is installed. Figure 133 below shows the Elevation setting. This value is used on variable speed machines to ensure that the variable speed drive performance is de-rated according to the elevation. -
Page 99: Total Hours
4.7.1.9 Total Hours: The Total Hours is the amount of run hours for the machine including both loaded and unloaded operation. The total hours must be set to match the actual hours on the machine when installing a replacement controller. Figure 134 shows setting the Total Hours to 100h. Figure 134: Total Hours 4.7.1.10 Loaded Hours: The Loaded Hours are the hours run hours during which the machine was loaded and producing air. -
Page 100: Brand
4.7.1.11 Brand: The Brand Name can be set to Gardner Denver or CompAir as seen in the example below. Use the drop down menu to select and set it accordingly. Figure 136 below shows the drop down menu for the Brand setting. -
Page 101: Max Start Pressure
As shown in the Figure above, Max Start Pressure and Heavy Startup settings are grayed out and the user can’t make changes to them. 4.7.2.1 Max Start Pressure: The Max Start Pressure setting defines the maximum start pressure in the reservoir before the motor will be allowed to start. -
Page 102: Discharge Temperature Fault
Figure 139: Discharge Temperature Warning 4.7.2.5 Discharge Temperature Fault: The Discharge Temperature Fault setting defines the temperature where an over temperature fault will be triggered in the controller. The technician may set the value of the Discharge Temperature Fault lower than the factory default but not above. -
Page 103: Delivery Pressure Warning
4.7.2.6 Delivery Pressure Warning: The Delivery Pressure Warning setting defines the pressure where an over pressure warning is triggered in the controller. Figure 141 below shows setting the Delivery Pressure Warning to 127 psi. Figure 141: Delivery Pressure Warning 4.7.2.7 Delivery Pressure Fault: The Delivery Pressure Fault defines the pressure where an over pressure fault is triggered in the controller. -
Page 104: Additional Operating Limits
4.7.2.8 Additional Operating Limits When the Temperature Inputs on the Programmable IO screen are set to a channel, additional operating limit tabs will show next to the Default Limits on the Operating Limits screen. The possible tabs are Control Panel Temperature, Delivery Temp, Dryer Temp, and Enclosure Temp and they will only show up when they are addressed to a channel. -
Page 105: Automatic Stop Time
Figure 144: Control - Default 4.7.3.1 Automatic Stop Time: The Automatic Stop Time is the amount of time that the compressor will run after the blowdown timer has expired before stopping the motor. This time setting has two inputs, one is for Minute and other for Seconds. Figure 145 below shows the setting Automatic Stop Time to 5 min 0 Sec. -
Page 106: Min Stop Time
installations, such as high elevation, it may be necessary to turn this function off to avoid trips. Figure 146 shows the Rotation Direction Check setting turned On. Figure 146: Rotation Direction Check 4.7.3.3 Min Stop Time: The Min Stop Time is the minimum amount of time that the compressor motor will run after pressing the stop button, which starts the depressurization process. -
Page 107: Acceleration Time
hour, without unnecessarily extending the automatic stop time. The range can be set from 1 Minute to 60 Minutes. Figure 148 shows the setting of Minimum Run Time to 10 Mins. Figure 148: Minimum Run Time 4.7.3.5 Acceleration Time: The Acceleration Time setting is used on fixed speed machines and defines the amount of time that the motor takes to accelerate. -
Page 108: Star Delta Time
4.7.3.6 Star Delta Time: The Star Delta Time setting defines the amount of time the main motor will run in the wye phase before transitioning to the delta connection. This value should be set to an appropriate value for the compressor by default but may be adjusted, if needed. -
Page 109: Ext Speed Limit (Min)
4.7.4.1 Ext Speed Limit (min): The Ext Speed Limit (min) is a percentage of the minimum speed of the variable speed motor. This is used to set the minimum speed limit when the programmable digital input function for External Speed Limit is active. -
Page 110: Speed Control Source
Figure 153: Ext Speed Limit (max) 4.7.4.3 Speed Control Source: The Speed Control Source is a selection drop-down to specify the source of the VFD’s speed control input. The user can select between Automatic, Remote, and Manual, shown below in Figure 154. When the Speed Control Source is set to Automatic (the default value), the controller will use its internal algorithms based on the system configuration to control the speed of the motor and attempt to maintain pressure control. -
Page 111: Capacity Limit
4.7.4.4 Capacity Limit: The Capacity Limit setting is a percentage of the compressor’s full speed. This setting limits the maximum speed that the compressor will run in any operating mode. Unlike the Ext Speed Limit settings, the Capacity Limit is active all of the time and a setting other than 100% will cause maximum speed limiting to occur any time that the motor is active. -
Page 112: Cold Start Limit
4.7.4.6 Cold Start Limit: The Cold Start Limit setting is a percentage between 50% and 100%, which sets the limit of the compressor’s full speed when running under cold start conditions, shown in Figure 157 below. This limit is active for the duration of the Cold Start Time setting when starting at ambient conditions less than 50 degrees Fahrenheit. -
Page 113: Cooling - Default
4.7.5 Cooling - Default: The Advanced Cooling menu has two settings, one is the selection of the Cooling Type and the second is the selection of the type of Fan Control being used on the machine. Figure 159 below represents the Cooling settings screen. -
Page 114: Fan Control
4.7.5.2 Fan Control: There are two fan control types: Constant and Thermostatic. Figure 161 below shows the Fan Control setting selection drop down menu. Constant: Under this setting the cooling fan will run continuously anytime the main motor of the machine is running. -
Page 115: Pid Tuning
The factory settings are optimized for the machine and will perform well for almost all applications. Only make adjustments to these values if directed by Gardner Denver. Figure 163: PID Tuning 4.7.7 Backup / Restore:... - Page 116 Save User Configuration: The User can save the current or user defined settings with Save User Configuration. Once you hit the button, a dialogue box will confirm user consent to proceed and perform the save operation. Figure 165: Save User Configuration below shows the Confirm Changes dialogue box. Figure 165: Save User Configuration The System will then save the settings and values and return to the screen shown in Figure 164: Backup / Restore.
-
Page 117: Section 5 Alarms
SECTION 5 ALARMS The Governor controller reads many analog inputs and controls a host of digital IO in order to achieve the system objectives and make sure the compressor is running optimally and efficiently. Tests are performed constantly by the Governor controller in order to determine the state of the compressor system at any given moment. -
Page 118: Active Alarm
Figure 169 – Alarm Active To view more information about the particular alarm, click anywhere inside the banner border to open a list of active alarms. Past alarm history can also be found on this page. An alternative way to navigate to this screen is through the main menu, selecting the Alarms sub-menu. - Page 119 Timestamp, Code, and Message. Selecting an alarm on the list and clicking the Info button will provide more detailed information about the specific alarm. Figure 171: Active Alarms Alarm: The alarm column indicates if the alarm is warning or fault. A fault alarm is an error which needs to be resolved first in order to further machine operation.
- Page 120 Table 44 below provides more definition of the major codes and components it represents in the compressor system. Table 44: Major Alarms Major Code Component Description This major code indicates an issue related to the compressor airend, such as high Airend 1 discharge temperature.
- Page 121 Using the wiring schematic for the machine, locate the inlet temperature sensor connection to the controller. Check for any shorted wires at the connector. Inspect the cable for damage between the controller and the sensor. Remove the cable Airend Inlet Inlet temperature sensor connector from the sensor and use a multi-meter Temperature is...
- Page 122 Check the temperature warning setting to ensure that it is not set too close to the normal operating range of the machine. Check site conditions for elevated ambient temperature. Check the Airend discharge condition of compressor cooling functions such as Airend temperature has thermal mixing valve and cooler.
- Page 123 Airend inlet pressure is Airend Inlet approaching the Pressure Input A1.10 Warning minimum value to be Inspect inlet air filter, clean/replace as necessary. is below the able to start or run the Warning Limit machine. Using the wiring schematic for the machine, locate the airend inlet pressure sensor connection to the controller.
- Page 124 Date and Time set them. If the problem persists, export the logs Warning time, most likely due to error from the controller and contact Gardner Denver invalid entries. service. Check the configuration settings. If the problem Error in valve Internal software error or...
- Page 125 If the problem persists, export the logs from the C.18 Warning machine configuration Backup/Restore controller and contact Gardner Denver service. using the backup/restore functionality. Remove and re-insert the USB device and try to save the logs again. Ensure that the USB device...
- Page 126 attempting to set it low. observe the feedback output for the digital output This indicates that the while forcing the value ON and OFF. If shorted output pin is shorted to high, the feedback will remain ON regardless of 24VDC. the forced value.
- Page 127 output pin is shorted to 24VDC. The feedback value of Digital Output 10 is high while the controller is Digital Output 10 C.57 Fault attempting to set it low. Short High This indicates that the output pin is shorted to 24VDC.
- Page 128 The feedback value of Digital Output 18 is high while the controller is Digital Output 18 C.65 Fault attempting to set it low. Short High This indicates that the output pin is shorted to 24VDC. The feedback value of Digital Output 19 is high while the controller is Digital Output 19 C.66...
- Page 129 ground or the output is overloaded. The feedback value of Digital Output 6 is low while the controller is Digital Output 6 attempting to set it high. C.73 Fault Short Low This indicates that the output pin is shorted to ground or the output is overloaded.
- Page 130 ground or the output is overloaded. The feedback value of Digital Output 13 is low while the controller is Digital Output 13 attempting to set it high. C.80 Fault Short Low This indicates that the output pin is shorted to ground or the output is overloaded.
- Page 131 Definition recipe If the problem persists, export the logs from the C.97 Warning The operation may have save failed, new controller and contact Gardner Denver service. been interrupted. The file created. controller was able to recover. Machine An error occurred during...
- Page 132 If the problem persists, export the logs from the C.101 Warning recipe save The operation may have controller and contact Gardner Denver service. failed, new file been interrupted. The created. controller was able to recover. An error occurred during...
- Page 133 Configuration If the problem persists, export the logs from the C.108 Warning The operation may have recipe load controller and contact Gardner Denver service. been interrupted. The partially failed controller was able to recover. An error occurred during an attempt to save the Alarm Info alarm info file.
- Page 134 The Ethernet IP task has If the problem persists, export the logs from the C.126 Fault variable Tasks encountered an issue. controller and contact Gardner Denver service. An Ethernet IP No EIP connection cannot be Check cables and network configuration. If the connection detected.
- Page 135 Gardner Denver service. Check the power cable to the iConn and the USB Cell-Data An error occurred when cable between the iConn and controller. If the C.131...
- Page 136 File Backup problem persists, export the logs from the C.147 Warning The operation may have Failure Warning controller and contact Gardner Denver for been interrupted. service. Process Control An error was detected in Export the logs from the controller and contact C.148...
- Page 137 Voltage across drive Confirm DC bus voltage within tolerance when FV1.7 Fault Saturation Trip IGBT exceeds fault limit. idle and running. Contact Gardner Denver fault service. Low VFD input voltage Verify package supply voltage within tolerance. VFD Cooling resulting in Low DC Bus Check input wiring connections to VFD.
- Page 138 VFD 3 phase system supplying compressor package, Fault supply protection may need to be disabled. Contact Gardner Denver service. Check wiring between motor and VFD for VFD Cooling VFD has detected output damaged or loose connections. Measure output FV1.11...
- Page 139 VFD Cooling VFD has detected Power cycle drive. Contact Gardner Denver FV1.19 Fault Power Board internal memory error. service. EEPROM fault VFD Cooling VFD has detected Power cycle drive. Contact Gardner Denver FV1.20 Fault RAM fault internal memory error. service.
- Page 140 Voltage Limit risen above the warning deceleration may be too fast and require Warning limit, due to motor regen parameter adjustment, contact Gardner Denver or high input voltage service. VFD Cooling Internal communication Try performing a power cycle to see if fault clears.
- Page 141 IC.11 Warning device and power cabling to the iConn. If the interrupted device. The operation problem persists contact Gardner Denver service. may have been interrupted. Value of a registered Reboot the controller. If the problem persists, Internal software IC.12...
- Page 142 VFD warning or fault. See the actions for the M1.13 Fault Speed Low fault speed limit set in the associated VFD alarm. Contact Gardner Denver controller. service. VFD Actual Motor Speed Typically this alarm will be accompanied by a VFD Motor is below the minimum VFD warning or fault.
- Page 143 Refer to the compressor package wiring diagram. Using a multi-meter, measure 24VDC supply at the power supply output terminals. If voltage is Control panel 24VDC low, use the adjustment screw to raise voltage to Low DC supply power supply has Fault 24VDC.
- Page 144 function has been activated. Programmable input for Low voltage low voltage relay fault Inspect low voltage relay and monitor for P.21 Fault relay fault function has been conditions causing the device to trip. activated. Programmable input for High vibration high vibration fault Inspect vibration monitoring equipment and P.22 Fault...
- Page 145 Check the condition of compressor cooling functions such as thermal mixing valve and cooler. Check oil condition and oil level. Examine separator Separator temperature airend for issues. Review history of compressor P.101 Fault temperature has exceeded the high discharge temperature using the controller trends, high fault fault limit setting.
- Page 146 Ambient air temperature Ambient Check the site conditions and increase is approaching the P.106 Warning temperature low temperature of the ambient air to the compressor minimum limit to start or warning enclosure. run the compressor. Using the wiring schematic for the machine, locate the enclosure temperature sensor connection to the controller.
- Page 147 wiring or sensor depending on the results of the findings. Using the wiring schematic for the machine, locate the Control Box temperature sensor connection. Check for disconnected wires, plugs, or loose connections. Inspect the cable for Control Box temperature damage between the controller and the sensor. sensor is faulty, the Control Box Remove the cable connector from the sensor and...
- Page 148 Using the wiring schematic for the machine, locate the Delivery temperature sensor connection to the controller. Check for disconnected wires, plugs, or loose connections. Delivery temperature Inspect the cable for damage between the sensor is faulty, the controller and the sensor. Remove the cable Plant delivery wiring to the sensor is connector from the sensor and use a multi-meter...
- Page 149 Oil Sump 1 Oil Sump 1 temperature Inspect the oil level and condition. Add oil as P.130 Fault temperature has exceeded the high required. Inspect the oil cooler and thermal mixing high fault temp fault limit. valve operation. Clean the cooler as required. Oil Sump 1 temperature Oil Sump 1 has exceeded the high...
- Page 150 Oil Sump 2 temperature Oil Sump 2 Raise the ambient temperature with the is approaching the P.236 Warning temperature low compressor package. Inspect thermal mixing minimum limit to start or warning valve. run the compressor. Using the wiring schematic for the machine, locate the Oil Sump 2 temperature sensor connection to the controller.
- Page 151 within range at room temperature but still be faulty once exposed to an elevated temperature or vibration. Replace or repair the wiring or sensor depending on the results of the findings. Using the wiring schematic for the machine, locate the Oil Injection temperature sensor connection to the controller.
- Page 152 Using the wiring schematic for the machine, locate the Enclosure temperature sensor connection to the controller. Check for disconnected wires, plugs, or loose connections. Enclosure temperature Inspect the cable for damage between the sensor is faulty, the controller and the sensor. Remove the cable Enclosure wiring to the sensor is connector from the sensor and use a multi-meter...
- Page 153 Using the wiring schematic for the machine, locate the Reservoir pressure sensor connection to the controller. Check for any shorted wires at Reservoir pressure the connector. Inspect the cable for damage Reservoir sensor is faulty or the between the controller and the sensor. Using a P.205 Fault pressure short...
- Page 154 Using the wiring schematic for the machine, locate the System pressure sensor connection to the controller. Check for any shorted wires at the connector. Inspect the cable for damage between System System pressure sensor the controller and the sensor. Using a multi-meter P.211 Fault pressure short...
- Page 155 Using the wiring schematic for the machine, Remote speed control locate the Remote speed control input connection input is faulty, the wiring Remote speed to the controller. Check for any shorted wires at to the sensor is broken, P.313 Warning control open the connector.
- Page 156 maintenance compressor overhaul has warning expired. The digital input for the air filter vacuum has Air Filter tripped. The air filter is Change the air filter and reset the air filter S.21 Warning Warning blocked and has created maintenance timer when the change is complete. excessive vacuum at the inlet to the compressor The digital input for the...
- Page 157 Voltage across drive Confirm DC bus voltage within tolerance when V1.7 Fault Trip fault IGBT exceeds fault limit. idle and running. Contact Gardner Denver service. Low VFD input voltage Verify package supply voltage within tolerance. resulting in Low DC Bus VFD1 Under Check input wiring connections to VFD.
- Page 158 Test motor insulation resistance. VFD1 Power VFD has detected Power cycle drive. Contact Gardner Denver V1.19 Fault Board EEPROM internal memory error. service. fault VFD has detected Power cycle drive.
- Page 159 VFD1 MCU VFD has detected Power cycle drive. Contact Gardner Denver V1.25 Fault Watchdog fault internal processing error. service. Monitor the heat sink cooling fan operation. Using VFD has detected an VFD1 Fan a multi-meter check for 24VDC/48VDC at the V1.32...
- Page 160 DC bus voltage has deceleration may be too fast and require V1.68 Warning Voltage limit risen above the warning parameter adjustment, contact Gardner Denver warning limit, due to motor regen service. or high input voltage VFD1 System Internal communication Try performing a power cycle to see if fault clears.
-
Page 161: Contact Info
A quick link has been provided to reach out for the best support and service in case the user needs help in handling any particular alarm. As shown in Figure 172, the Contact Info Name is set to Gardner Denver. -
Page 162: Alarm History
The Info Button available next to the Contact Info button, gives more information about a specific alarm. Select the Alarm from the list then select the Info Button and an Alarm Info screen will come up with details such as Operating Stats, Total Hours, Loaded Hours, Reservoir Pressure, Delivery Pressure, and Discharge Temp. - Page 163 Figure 174: Alarm History The Info Button available on the Alarm History Page is the same as described in section 5.1.2. The Info button will be available for alarm and snapshot events but disabled for acknowledged events as shown in Figure 175 below.
-
Page 164: Section 6 Diagnostics
SECTION 6 DIAGNOSTICS This section explains the diagnostics and troubleshooting options and settings available to the user. The user can review and monitor the status of the machine in a number of different ways. Table 47 below gives a brief summary about the sub-menus for diagnostics and brief information about each. Table 47: Diagnostics Diagnostics Sub-Menu... - Page 165 Figure 176: Sequencing Diagnostics – ES+ Protocol Figure 177: Sequencing Diagnostics - AirSmart Protocol 13-17-621 Page 165...
-
Page 166: Jog Motors
Figure 178: Sequencing Diagnostics - Delcos Protocol - Master Figure 179: Sequencing Diagnostics - Delcos Protocol - Slave 6.2 Jog Motors The Jog Motor diagnostics screen is used to run the motors in the system for a short amount of time to make sure they are rotating in the right direction. -
Page 167: Selected Motor
Figure 180: Jog Duration 6.2.2 Selected Motor: In the system there are two types of motors: Compressor and Fan. Select the motor you wish to jog from the dropdown menu. Figure 181 below shows the selection of compressor motor. Figure 181: Selected Jog Motor 6.2.3 Jog Delay: The Jog Delay setting allows the user to insert a delay between pressing the start job button and the start of the motor jog operation. - Page 168 Figure 182: Jog Delay Once set the user can hit the Start Jog button to start the test jog. Note, once the jog function has been activated, another jog may not be started until 10 seconds have passed since the pervious jog. 6.3 IO The IO Diagnostics screen gives the status of IO signals for the Digital Inputs, Digital Outputs, Temperature Inputs, Analog Inputs, and Analog Outputs.
- Page 169 Digital Outputs: Figure 184 below shows the screen for Digital Output signals. The feedback is a readout of the status of the output pin while the value column represents the commanded state. The Value and Feedback for each output should match if the output is working properly. If these do not match, the output may be shorted or overloaded or there may be not power signal applied to the appropriate digital output bank.
- Page 170 Figure 185: Temperature Inputs Analog Inputs: Similar to the Temperature Inputs tab, the Analog Inputs tab lists the raw and scaled values for each of the analog sensors on the machine. Figure 186 below shows the Analog Input screen. Figure 186: Analog Inputs Analog Outputs: Similar to the Analog Inputs tab, the Analog Outputs tab lists the raw and scaled values for each of the analog sensors on the machine.
-
Page 171: Controller
The DC Supply is the current value of the control voltage and can be useful in troubleshooting. The other values may be referenced by Gardner Denver Support to determine if a software update should be performed on the controller. -
Page 172: Logs
Figure 188: Controller General Information 6.4.2 Logs: The controller has a data recording function which enables the user to save log files to a flash drive. This function can be used to monitor and save various compressor parameters for evaluation of system performance and troubleshooting. - Page 173 Once the files have been transferred to the flash drive it may be removed and inserted to a PC for review. The files downloaded from the controller will be stored in a “gz archive” file and will need to first be un- zipped and extracted to a folder for viewing by right-clicking on the file and extracting.
- Page 174 Figure 192: Audit Report Data Recorder: The Data Recorder folder contains logs recording various values of the system during operation. Figure 193 below shows the contents of the Data Recorder folder. Figure 193: Data Recorder Folder The file named “Datalog_2020_05_01_08_16_30.csv” contains the logs of the system after the previously generated log.
- Page 175 made once every 10 minutes if the machine is not running, every 20 seconds during normal operation, and every 1 second during the starting phase. Figure 194: Datalog File Event Trace: The Event Trace folder contains logs created when a specific event occurred. These files include the same information that is available in the Data Recorder files but at a higher resolution for a short period of time preceding a fault.
-
Page 176: System
Figure 197: Machine Configuration Files System Dump File: The logs also contain the system dump files which can be used by Gardner Denver support for diagnostics. If this file is requested, please forward to Gardner Denver support. Figure 198 shows the system dump file for this example. - Page 177 Figure 199: System SDM System: The System Tab lists the operational values, time synchronization, software versions, and CPU configuration information. Figure 200 below shows the System screen. Figure 200: System Software: The Software information page will list the software configuration. Figure 201 shows the Software tab. 13-17-621 Page 177...
- Page 178 Figure 201: Software Hardware: The Hardware screen shows the status of hardware within the hardware tree. It also have the Module Status and Module details. Figure 202 below shows the hardware status with green tick marks. Figure 202: Hardware Logger: The Logger page lists logs for various machine modules.
- Page 179 Figure 203: Logger To view the details right on the screen, hit the View button. Another screen with more details will show up as shown in Figure 204 below. Figure 204: Logger Details to return to previous screen of Logger. to refresh the page.
- Page 180 The Profiler in Figure 206 is a high level Diagnostic tool which keeps track of all the changes taking place with very fine level of details. By default there will be default profiler running and keeping record of all the changes. Note, the user should not modify this page unless directed to by Gardner Denver. Figure 206: Profiler...
-
Page 181: Update Software
6.4.4 Update Software The Update Software screen will show the list of available software versions to install. In order to install new software insert a USB device with the desired software on it and then select the software from the list. Once the software has been selected, press the install button to update the controller. -
Page 182: Logger
Section 6.4.3. This screen facilitates the user to read the logs from a specific logger. Figure 209 below represents the Logger screen. Note that this page should be used only when directed by Gardner Denver service. Figure 209: Logger To select a logger, hit the Sel Logger button on the bottom right side. -
Page 183: Advanced
Figure 210: Select Logger Once selected, hit the Save button. Another window will open showing that it is loading data from the selected logger as shown in Figure 211 below. Figure 211: Data Loading from Logger Hit the Close button and it will take you to the Logger home screen. It might take few minutes to load and display the data. - Page 184 Figure 212: Advanced As you can see, for Alarm info there are total of 20 files with 178.3 kB of memory size. You can scroll through the list using up and down navigation. The bottom left side of the screen shows how much memory is being used in the system.
-
Page 185: Iconn
6.5 iConn iConn is a remote connectivity systems which enables the unit to be connected over the cellular network. The iConn diagnostics page shows the operating status and information about the iConn module. If the iConn is connected to the controller but you are having issues with operation, refer to this screen first for diagnostics information. -
Page 186: Remote Control
Figure 215: Communication 6.7 Remote Control The Remote Control diagnostics page is a diagnostics page which shows the current status of all available remote control input signals. These parameters and their brief descriptions are listed below in Table 49. Table 49: Remote Control Remote Control Signal Name Brief Description... -
Page 187: Vfd Diagnostics
TV Full open When active, turn valve is forced to a fully open position When active, turn valve is forced to a fully closed position operating at TV Full close full flow. An analog input that will control the percent load of a machine when the Remote Speed Control speed control source is set to remote. - Page 188 Figure 217: VFD Diagnostics Figure 218: VFD Diagnostics 13-17-621 Page 188...
-
Page 189: Section 7 Trends
SECTION 7 TRENDS The Trends screen shows data on the operation of the machine over time. The Trends screen is shown in Figure 219, Delivery Pressure and Discharge Temp are shown along the left and right y-axis respectively, with time across the x-axis. Figure 219: Trends Display The graph allows you to display any two available parameters by changing the selection in the two dropdowns. - Page 190 Figure 221: Trend Right Dropdown The trends on the controller keep up to 30 days of data. To examine historical readings, press anywhere within the graph and a cursor will be activated for a History View. This is shown in Figure 222. Figure 222: Trend History View While the History view is activated, you can use the arrows to scroll forward and backward in time.
- Page 191 Additional configurations of the graph can be done by pressing the Graph Setup button. This will bring up a configuration popup as shown in Figure 223. The upper and lower limits of each axis can be configured to change the scale of the graph. ...
-
Page 192: Section 8 Web Interface
SECTION 8 WEB INTERFACE The controller HMI may be viewed as a web interface from a remote location on an internet browser. This allows monitoring of the compressor when away from the physical machine. All that is needed is the IP Address from the Settings >... - Page 193 Page left blank intentionally. 13-17-621 Page 193...
- Page 194 For additional information, contact your local representative or visit: www.contactgd.com/compressors ©2019 Gardner Denver, Inc. Printed in U.S.A. 13-17-621 Page 194...
Need help?
Do you have a question about the Governor TEN014983 and is the answer not in the manual?
Questions and answers