
Subscribe to Our Youtube Channel
Related Manuals for Gardner Denver Governor


Summary of Contents for Gardner Denver Governor
- Page 1 13-17-621 Version: 00 February 23 , 2019 Governor™ Controller USER’S MANUAL Rotary Screw Compressor Application...
- Page 2 WARNING – PROHIBITION – MANDATORY LABEL INFORMATION Gardner Denver compressors are the result of advanced engineering and skilled manufacturing. To be assured of receiving maximum service from this machine, the owner must exercise care in its operation and maintenance. This book is written to give the operator and maintenance department essential information for day-to-day operation, maintenance and adjustment.
- Page 3 Indicates a hazard with a medium level of risk which, if not avoided, COULD result in death or serious injury. Asphyxiation Hazard – Poisonous Fumes or Toxic Gases in Compressed Air Indicates a hazard with a low level of risk which, if not avoided, MAY result in a minor or moderate injury.
- Page 4 SAFETY PRECAUTIONS Safety is everybody’s business and is based on your use of good common sense. All situations or circumstances cannot always be predicted and covered by established rules. Therefore, use your past experience, watch out for safety hazards and be cautious. Some general safety precautions are given below: Failure to observe these notices will result in injury to or death of personnel.
-
Page 5: Table Of Contents
TABLE OF CONTENTS SECTION 1 REVISION HISTORY ........................ 6 SECTION 2 GENERAL ..........................7 2.1 Components and Layout ........................7 2.1.1 Display ............................7 2.1.2 IO Module ............................. 8 2.1.3 Cellular Module ..........................9 2.2 Features and Method of Control ......................9 SECTION 3 QUICK START ........................ -
Page 6: Section 1 Revision History
SECTION 1 REVISION HISTORY Version Date Notes February 23 , 2019 First release 13-17-621 Page 6... -
Page 7: Section 2 General
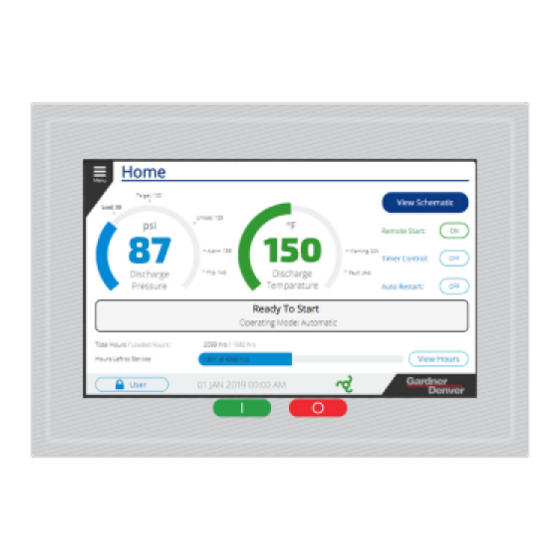
Gardner Denver compressor. This manual describes the controller specifications and operation on Gardner Denver rotary screw compressors. 2.1 Components and Layout The Governor™ control system is made up of several different components, described briefly in this section. 2.1.1 Display The display is the primary component that the user interacts with. -
Page 8: Io Module
The display is shown above in Figure 1 with the Home screen visible. Note that the Start and Stop buttons as shown in the image are active areas of the touchscreen rather than physical buttons. 2.1.2 IO Module The IO module is mounted inside the compressor cabinet and connects to the display as well as all of the digital and analog inputs and outputs on the system. -
Page 9: Cellular Module
2.1.3 Cellular Module The Governor™ controller features a cellular module that is connected to the display by USB. This connects into the iConn by Gardner Denver™ platform to provide machine health monitoring and analysis. Figure 3: Cellular Module The cellular module is shown in Figure 3 above. It is mounted in the control cabinet and connected to an antenna mounted on the top of the compressor package. -
Page 10: Section 3 Quick Start
SECTION 3 QUICK START This section provides the basic information on the controller so that the user can understand how to interact with and operate the machine. It focuses only on the common elements of the user interface and the settings and actions that are required to get the compressor running and producing air. Common User Interface Elements The user interface has common elements that are shared across all screens in the system. -
Page 11: Buttons And Switches
Refer to the Alarms system to determine the cause and resolve the fault condition. 6. The Gardner Denver Logo is present in the bottom right of every screen. Pressing this will navigate back to the Home screen from any screen in the system. -
Page 12: Scroll Elements
The Secondary buttons are outlined in blue with white fill. These buttons represent the less common action(s) for a screen. For example, on a settings screen the Cancel button will be a secondary button. If a button is locked it will be shown as in the Primary Locked and Secondary Locked examples above. -
Page 13: Settings And Input Elements
Figure 7: Scroll Bar Example The second type of scroll element is shown below in Figure 8. It is used for screens where there is a need to move with more precision than with the scroll bar, for example when there is a long list of individual elements. -
Page 14: Dropdown Boxes
3.1.3.1 Dropdown Boxes Dropdown selections allow the user to select an item from a pre-defined list of available options. An example is shown in Figure 9 below. To deploy the dropdown, press on the value that is shown (Automatic in the example below). With the dropdown deployed, you can change the selection by pressing on the option that you would like to select. -
Page 15: Home Screen
Keypad entry operation is described below: For inputs that have a maximum and minimum valid range, the keypad will display the valid input range as shown in Figure 10. To change the value, start typing a new value and it will overwrite the existing setting. ... - Page 16 Figure 12: Home Screen Elements Additional details on each of the home screen elements are provided below: 1. The Delivery Pressure gauge shows the current pressure as well as the currently active pressure band used for control. The color of the gauge and pressure display also changes to indicate the region that the pressure is currently in.
- Page 17 If the pressure is between the Warning and Fault pressure settings, it will be displayed in yellow: If the pressure is above the Fault pressure setting, it will be displayed in red: 2. The Discharge Temperature gauge shows the compressor airend discharge temperature. If the temperature is below the Minimum Start Temperature setting, it will be displayed in red.
-
Page 18: Schematic Screen
6. The View Hours button links to the Service Dashboard screen, which can be used to view, configure, and reset all of the maintenance timers on the system 7. The Total / Loaded hours display shows the current total and loaded hours of the machine. 8. - Page 19 Figure 13: Schematic View The main elements of the schematic view are described below: 1. The View Home button returns the user to the Home screen. 2. The Delivery pressure is shown in large text on the right of the screen in the default view. 3.
- Page 20 Figure 14: Airend Focus View If an element of the machine is in a warning or fault state, the element will be highlighted in yellow or red accordingly. For example, in Figure 15 below, the air filter service timer has expired, so the Air Filter element is highlighted in yellow.
-
Page 21: Navigation Menu
Table 1: Values for Schematic Elements Air Filter Airend Motor Reservoir Cooler Oil Cooler Oil Filter Air Filter Discharge State (FS) Reservoir Delivery None on Oil Filter Hours Temperature Pressure Pressure current Hours machine Inlet State Motor RPM Differential Oil Change (RS) Pressure Hours... -
Page 22: Logging In
The following screens and categories are available through the Menu: Home: This button links to the Home screen. Settings: Deploys cascading Settings Menu structure to view or modify any setting on the system. Alarms: Deploys cascading Alarms Menu with links to the Active Alarms and Alarm History views. - Page 23 This password should only be required under unusual circumstances and must be provided by Gardner Denver Technical Support. Note that the passwords can be changed from the default using the Adjustments button on the left of the screen once logged in.
-
Page 24: Setting Up
Setting Up Before running the machine, there are several basic configuration settings that may need to be changed. 6.1 Controller Configuration Basic controller configuration is located under the Settings -> Configuration menu as shown in Figure 20. Figure 20: Configuration Menu First, ensure that the units are set as desired by selecting the Locale link from the Configuration menu. - Page 25 It is important to verify that the Date, Time, and Timezone are set properly for the site. The date and time are relied on for logs, timer control, trends, etc. Setting the timezone properly ensures that daylight savings time adjustments will be accounted for automatically. The Date and Time Configuration screen is shown in Figure 22.
-
Page 26: Control Settings
6.2 Control Settings The settings under the Control Menu determine how the machine operates to match the process requirements of the customer. The default settings of the machine are acceptable for most installations. However, if the Pressure Band displayed on the gauge on the Home screen does not match the desired pressure range for the site, the Pressure Band must be adjusted. -
Page 27: Clearing Alarms
Figure 25: Primary Pressure Band Setting Once you are satisfied with the pressure band settings, press the Save button to commit the changes. Clearing Alarms If there are any faults present on the machine, they must first be cleared to allow the machine to be started. -
Page 28: Jogging The Motors
If the alarm icon in the Alarm column is an outline, as shown in Figure 26, the alarm is no longer active and may be reset. If the alarm icon is solid ( ), the fault is still active and the condition must be resolved before it can be cleared. -
Page 29: Running
Figure 28: Home Screen Ready to Start Press the Start button on the display directly below the screen. If the delivery pressure is below the load pressure setting, the compressor will start and accelerate the motor, then open the inlet valve and begin building pressure. -
Page 30: Stopping
Figure 29: Home Screen Enabled 9.3 Stopping To stop the machine, press the Stop button directly below the screen. The machine will go through a soft stop process where it is depressurized before stopping. When the Stop button is pressed, the inlet valve will close immediately (if the machine is currently loaded) and the Message Status Bar will display that the controller is stopping as shown in Figure 30. -
Page 31: Emergency Stop
Figure 30: Home Screen Stopping The progress of the stopping process is shown on the Message Status Bar. The time value shown (for example, “20 seconds”), is the time remaining on the minimum stop timer. The pressure value shown is the amount of pressure in the reservoir that must be vented for the system to be depressurized, or blown- down, to the appropriate value for the machine. -
Page 32: Section 4 Settings
SECTION 4 SETTINGS This section describes the settings available on the controller. Settings Map The complete map of settings available on the controller is shown in Figure 31 below. Note that items in dashed boxes are not shown if they do not apply to the machine. 13-17-621 Page 32... - Page 33 Figure 31: Settings Map 13-17-621 Page 33...
-
Page 34: Section 5 Trends
SECTION 5 TRENDS The Trends screen on the controller shows data on the operation of the machine over time. The main Trends screen is shown in Figure 32. Figure 32: Trends Display The graph allows you to display any two available parameters by changing the selection in the dropdown boxes. - Page 35 Figure 33: Trend Left Dropdown Figure 34: Trend Right Dropdown The trends on the controller keep up to 30 days of date. To examine historical readings, press anywhere within the graph window, and a cursor will be activated for History View. This is shown in Figure 35. 13-17-621 Page 35...
- Page 36 Figure 35: Trend History View While History view is activated, you can use the arrows to scroll forward and backward in time. The black vertical bar on the display shows the current position and the readings just above the graph show the values at the location of the bar.
- Page 37 Figure 36: Trend Graph Setup 13-17-621 Page 37...
-
Page 38: Section 6 Diagnostics
SECTION 6 DIAGNOSTICS The controller provides a section of screens for diagnostics and troubleshooting. Diagnostics Map The complete map of diagnostics available on the controller is shown in Figure 37 below. Note that items in dashed boxes are hidden on the user interface if they do not apply to the machine configuration. Sequencing System Overview Jog Motors... -
Page 39: Appendix Aalarm Codes
APPENDIX A ALARM CODES Each alarm in the system is assigned a code to indicate the exact condition. If a condition can cause both a warning and a fault, they will share the same alarm code and the severity will be indicated by the alarm type on the system. - Page 40 Alarm Code Alarm Name Severity Major Minor Warning Fault Notice ✔ Network Error ✔ Machine Configuration Task Error ✔ Machine Definition Task Error ✔ Date And Time Error ✔ Valve Task Error ✔ Oil Control Task Error ✔ Manual Snapshot ✔...
- Page 41 Alarm Code Alarm Name Severity Major Minor Warning Fault Notice ✔ Separator Temperature Sensor Shorted ✔ Separator Temperature Sensor Open ✔ ✔ High Ambient Temperature ✔ ✔ Low Ambient Temperature ✔ Ambient Temperature Sensor Shorted ✔ Ambient Temperature Sensor Open ✔...
- Page 42 Alarm Code Alarm Name Severity Major Minor Warning Fault Notice ✔ External Maintenance Warning (Digital Input) ✔ ✔ Change Separator ✔ Sequence Communications Warning ✔ Sequence Duplicate Unit Number Warning ✔ VFD Warning ✔ VFD Fault 13-17-621 Page 42...
- Page 43 13-17-621 Page 43...
- Page 44 For additional information, contact your local representative or visit: www.contactgd.com/compressors ©2019 Gardner Denver, Inc. Printed in U.S.A. 13-17-621 Page 44...
Need help?
Do you have a question about the Governor and is the answer not in the manual?
Questions and answers