Table of Contents
Advertisement
Quick Links
Advertisement
Table of Contents

Related Manuals for VOLTCRAFT DSO-2104


Summary of Contents for VOLTCRAFT DSO-2104
- Page 1 DSO-2104 Digital Storage Oscilloscope User Manual...
- Page 2 General Warranty We warrant that the product will be free from defects in materials and workmanship for a period of 3 years from the date of purchase of the product by the original purchaser from our company. The warranty period for accessories such as probes is 12 months.
-
Page 3: Table Of Contents
Table of Contents 1. General Safety Requirements ..................1 2. Safety Terms and Symbols ....................2 3. Quick Start ........................4 Introduction to the Structure of the Oscilloscope ............4 Front Panel ............................4 Rear Panel ............................5 Control Area ............................6 User Interface Introduction .................... - Page 4 Example 1: Measurement a Simple Signal ................50 Example 2: Gain of a Amplifier in a Metering Circuit ............51 Example 3: Capturing a Single Signal ..................52 Example 4: Analyze the Details of a Signal ................53 Example 5: Application of X-Y Function ................55 Example 6: Video Signal Trigger ....................
-
Page 5: General Safety Requirements
1.General Safety Requirements 1. General Safety Requirements Before use, please read the following safety precautions to avoid any possible bodily injury and to prevent this product or any other connected products from damage. To avoid any contingent danger, ensure this product is only used within the ranges specified. -
Page 6: Safety Terms And Symbols
2.Safety Terms and Symbols 2. Safety Terms and Symbols Safety Terms Terms in this manual (The following terms may appear in this manual): Warning: Warning indicates conditions or practices that could result in injury or loss of life. Caution: Caution indicates the conditions or practices that could result in damage to this product or other property. - Page 7 2.Safety Terms and Symbols To avoid body damage and prevent product and connected equipment damage, carefully read the following safety information before using the test tool. This product can only be used in the specified applications. Warning The four channels of the oscilloscope are not electrically isolated. The channels should adopt a common ground during measuring.
-
Page 8: Quick Start
3.Quick Start 3. Quick Start Introduction to the Structure of the Oscilloscope This chapter makes a simple description of the operation and function of the front panel of the oscilloscope, enabling you to be familiar with the use of the oscilloscope in the shortest time. -
Page 9: Rear Panel
3.Quick Start Rear Panel Figure 3-2 Rear Panel 1. Handle 2. Air vents 3. AC power input jack 4. Foot stool: Adjust the tilt angle of the oscilloscope. 5. USB Device port: It is used to transfer data when external USB equipment connects to the oscilloscope regarded as "slave device". -
Page 10: Control Area
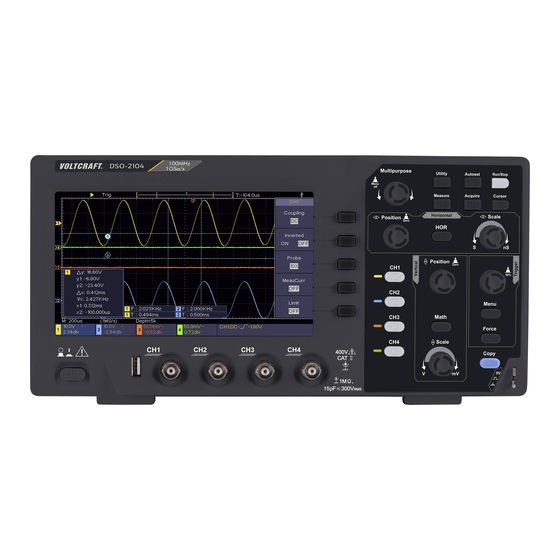
3.Quick Start Control Area Figure 3-3 Control Area Overview 1. Function button area: Total 6 buttons. 2. Horizontal control area with 1 button and 2 knobs. "HOR" button refer to horizontal system setting menu, "Horizontal Position" knob control trigger position, " Horizontal Scale" control time base. 3. -
Page 11: User Interface Introduction
3.Quick Start "Vertical Scale" knob control voltage scale of current channel. 6. M knob(Multipurpose knob): when a symbol appears in the menu, it indicates you can turn the M knob to select the menu or set the value. You can push it to close the menu on the left and right. - Page 12 3.Quick Start 10. The waveform of CH1. 11. Right Menu. 12. The waveform of CH4 13. The waveform of CH3 14. The waveform of CH2. 15. Current trigger type: Rising edge triggering Falling edge triggering Video line synchronous triggering Video field synchronous triggering The reading shows the trigger level value of the corresponding channel.
-
Page 13: How To Implement The General Inspection
3.Quick Start of the waveform of the CH3 channel. If the pointer is not displayed, it means that this channel is not opened. 25. The two blue dotted lines indicate the horizontal position of cursor measurement. 26. The green pointer shows the grounding datum point (zero point position) of the waveform of the CH4 channel. -
Page 14: How To Implement The Probe Compensation
3.Quick Start The instrument carries out all self-check items and shows the Boot Logo. Push the Utility button, select Function in the right menu. Select Adjust in the left menu, select Default in the right menu. The default attenuation coefficient set value of the probe in the menu is 10X. -
Page 15: How To Set The Probe Attenuation Coefficient
3.Quick Start probe hook tip is used, ensure that it keeps in close touch with the probe. Connect the probe tip with the signal connector of the probe compensator and connect the reference wire clamp with the ground wire connector of the probe connector, and then push the Autoset button on the front panel. -
Page 16: How To Use The Probe Safely
3.Quick Start Caution: The default attenuation coefficient of the probe on the instrument is preset to 10X. Make sure that the set value of the attenuation switch in the probe is the same as the menu selection of the probe attenuation coefficient in the oscilloscope. -
Page 17: How To Implement Self-Calibration
3.Quick Start How to Implement Self-calibration The self-calibration application can make the oscilloscope reach the optimum condition rapidly to obtain the most accurate measurement value. You can carry out this application program at any time. This program must be executed whenever the change of ambient temperature is 5℃... -
Page 18: Introduction To The Horizontal System
3.Quick Start 1. Press CH1, CH2, CH3 or CH4 to select the desired channel. 2. Use the Vertical Position knob to show the selected channel waveform in the center of the waveform window. The Vertical Position knob functions the regulating of the vertical display position of the selected channel waveform. Thus, when the Vertical Position knob is rotated, the pointer of the earth datum point of the selected channel is directed to move up and down following the waveform, and the position message at the center of the screen would... -
Page 19: Introduction To The Trigger System
3.Quick Start 1. Turn the Horizontal Scale knob to change the horizontal time base setting and observe the consequent status information change. Turn the Horizontal Scale knob to change the horizontal time base, and it can be found that the Horizontal Time Base display in the status bar changes accordingly. - Page 20 3.Quick Start Note: Turning the Trigger Level knob can change trigger level value and it is also the hotkey to set trigger level as the vertical mid point values of the amplitude of the trigger signal. 3. Push the Force button to force a trigger signal, which is mainly applied to the "Normal"...
-
Page 21: Advanced User Guidebook
4.Advanced User Guidebook 4. Advanced User Guidebook This chapter will deal with the following topics mainly: How to Set the Vertical System How to Set the Horizontal System How to Set the Trigger System How to Set the Sampling/Display ... -
Page 22: How To Set The Vertical System
4.Advanced User Guidebook How to Set the Vertical System The VERTICAL CONTROLS includes three menu buttons such as CH1, CH2, CH3, CH4 and Math, and two knobs such as Vertical Position, Vertical Scale. Setting of CH1 – CH4 Each channel has an independent vertical menu and each item is set respectively based on the channel. -
Page 23: Use Mathematical Manipulation Function
4.Advanced User Guidebook below: (1) Push the CH1 button to show the CH1 SETUP menu. (2) In the right menu, select Coupling as DC. Both DC and AC components of the signal are passed. (3) In the right menu, select Coupling as AC. The direct current component of the signal is blocked. -
Page 24: The Waveform Calculation
4.Advanced User Guidebook addition, multiplication, division and subtraction operations between two channels, or the FFT operation for a channel. Press the Math button to display the menu on the right. The Waveform Calculation Press the Math button to display the menu on the right, select Type as Math. Function Menu Setting Description... - Page 25 4.Advanced User Guidebook analyzing the input signal on Oscilloscope. You can match these frequencies with known system frequencies, such as system clocks, oscillators, or power supplies. FFT function in this oscilloscope transforms 2048 data points of the time-domain signal into its frequency components mathematically (the record length should be 10K or above).
- Page 26 4.Advanced User Guidebook 6. In the right menu, press Hori (Hz) to make the symbol in front of the frequency value, turn the M knob to adjust the horizontal position of FFT waveform; then press to make the symbol in front of the frequency/div below, turn the M knob to adjust the time base of FFT waveform.
- Page 27 4.Advanced User Guidebook Best solution magnitude, worst frequency. Blackman Recommend to use for: Single frequency waveforms, to find higher order harmonics. Good for magnitude, but poorer frequency resolution than Hamming. Recommend to use for: Sine, periodic and narrow band random Hanning noise.
-
Page 28: Use Vertical Position And Scale Knobs
4.Advanced User Guidebook aliasing. So pay more attention to the relation between the frequency being sampled and measured. Use Vertical Position and Scale Knobs 1. The Vertical Position knob is used to adjust the vertical positions of the waveforms. The analytic resolution of this control knob changes with the vertical division. -
Page 29: Zoom The Waveform
4.Advanced User Guidebook below. Zoom the Waveform Push the Horizontal HOR button to enter wave zoom mode. The top half of the display shows the Main window and the bottom half displays the Zoom window. The Zoom window is a magnified portion of the Main window. Selected portion Main Window Horizontal position of... -
Page 30: Single Trigger
4.Advanced User Guidebook Single trigger: Use a trigger level to capture stable waveforms in two channels simultaneously. Alternate trigger: Trigger on non-synchronized signals. The Single Trigger, Alternate Trigger menus are described respectively as follows: Single Trigger Single trigger has two types: edge trigger, video trigger. Edge Trigger: It occurs when the trigger input passes through a specified voltage level with the specified slope. - Page 31 4.Advanced User Guidebook Trigger on rising edge Slope Trigger on falling edge 100 ns - 10 s, turn the M knob to set time interval Holdoff before another trigger occur. Holdoff Set Holdoff time as default value (100 ns). Reset Prev Page Enter previous page Trigger Level: trigger level indicates vertical trig position of the channel, rotate trig...
-
Page 32: How To Operate The Function Menu
4.Advanced User Guidebook How to Operate the Function Menu The function menu control zone includes 4 function menu buttons: Utility, Measure, Acquire, Cursor, and 2 immediate-execution buttons: Autoset, Run/Stop. How to Set the Sampling/Display Push the Acquire button, the Sampling and Display menu is shown in the right as follows: Function Setting... - Page 33 4.Advanced User Guidebook (2) In the right menu, press Persist to select the persist time, including OFF, 1 Second, 2 Seconds, 5 Seconds and Infinity. When the "Infinity" option is set for Persist Time, the measuring points will be stored till the controlling value is changed.
-
Page 34: How To Save And Recall A Waveform
4.Advanced User Guidebook How to Save and Recall a Waveform Push the Utility button, select Function in the right menu, select Save in the left menu. By selecting Type in the right menu, you can save the waveforms, configures or screen images. When the Type is selected as Wave, the menu is shown as the following table: Function Menu Setting... - Page 35 4.Advanced User Guidebook When the Type is selected as Configure, the menu is shown as the following table: Function Menu Setting Description Function Save Display the save function menu Configur Type Choose the saving type as configure. Setting1 ….. Configure The setting address Setting8 Save the current oscilloscope configure...
- Page 36 4.Advanced User Guidebook stored in the address will be shown, the address number and relevant information will be displayed at the top left of the screen. In order to save the waveform of CH1, CH2, CH3, CH4 into the USB storage as a BIN file, the operation steps should be followed: 1.
- Page 37 4.Advanced User Guidebook USB disk Requirements Support USB disk format: USB 2.0 or below, FAT16 or FAT32, allocation unit size no exceed 4k, max capacity 64G. If the USB disk doesn't work properly, format your USB disk and then try again. There are two methods in format the USB disk, first by using computer system to format, the other one is through formatting software to format.
- Page 38 4.Advanced User Guidebook message. Figure 4-4: Formatting the USB disk setting 6. Formatting process. Figure 4-5: Formatting the USB disk Check whether the USB disk is FAT32 with allocation unit size 4096 after formatting. Use Minitool Partition Wizard to format Download URL: http://www.partitionwizard.com/free-partition-manager.html Tip: There are many tools for the USB disk formatting on the market, just take...
- Page 39 4.Advanced User Guidebook 3. Click Reload Disk on the pull-down menu at the top left or push keyboard F5, and information about the USB disk will display on the right side with red mark 1 and 2. Figure 4-6: Reload Disk 4.
-
Page 40: How To Implement The Auxiliary System Function Setting
4.Advanced User Guidebook to begin formatting. Figure 4-9: Apply setting 7. Formatting process Figure 4-10: Format process Format the USB disk successfully Figure 4-11: Format successfully How to Implement the Auxiliary System Function Setting ●Config Push the Utility button, select Function in the right menu, select Configure in the left menu. - Page 41 4.Advanced User Guidebook Function Setting Description Menu Function Configure Show the configure menu Lock all keys. Unlock method: push Trigger Menu button in trigger control KeyLock area, then push Force button, repeat 3 times. About Show the version and serial number ●Display Push the Utility button, select Function in the right menu, select Display in the left menu.
-
Page 42: How To Update Your Instrument Firmware
4.Advanced User Guidebook from the input connector. Push the Utility button, select Function in the right menu, the function menu will display at the left, select Adjust. If everything is ready, select Self Cal in the right menu to enter the self-calibration procedure of the instrument. -
Page 43: How To Measure Automatically
4.Advanced User Guidebook Copy the firmware file onto the root directory of your USB memory device. 3. Insert the USB memory device into the front-panel USB port on your instrument. 4. Push the Utility button, select Function in the right menu, select Update in the left menu. - Page 44 4.Advanced User Guidebook A→B ,+PulseCount, -PulseCount, RiseEdgeCnt, FallEdgeCnt, Area, and Cycle Area. The "Automatic Measurements" menu is described as the following table: Function Menu Setting Description Source CH1 CH2 Select the source CH3 CH4 Add the selected measure types (shown at the left bottom, you could only add 8 types at most) Hide the window of measures...
- Page 45 4.Advanced User Guidebook Figure 4-12 Automatic measurement The automatic measurement of voltage parameters The oscilloscopes provide automatic voltage measurements including Mean, PK-PK, RMS, Max, Min, Vtop, Vbase, Vamp, OverShoot, PreShoot, Cycle RMS, and Cursor RMS. Figure 4-13 below shows a pulse with some of the voltage measurement points.
- Page 46 4.Advanced User Guidebook Vtop: Voltage of the waveform's flat top, useful for square/pulse waveforms. Vbase: Voltage of the waveform's flat base, useful for square/pulse waveforms. Vamp: Voltage between Vtop and Vbase of a waveform. OverShoot: Defined as (Vmax-Vtop)/Vamp, useful for square and pulse waveforms.
- Page 47 4.Advanced User Guidebook Phase: Compare the rising edge of CH1 and CH2, calculate phase difference of two channels. Phase difference=(Delay between channels at the rising edge÷ Period)×360° . Note for the following delay measurements: Source A and Source B can be set in the automatic measurement function menu. FRR: Time between Source A first rising edge and Source B first rising edge.
-
Page 48: How To Measure With Cursors
4.Advanced User Guidebook How to Measure with Cursors Push the Cursor button to turn cursors on and display the cursor menu. Push it again to turn cursors off. The Cursor Measurement for normal mode: The description of the cursor menu is shown as the following table: Function Setting Description... - Page 49 4.Advanced User Guidebook cursors active. Select Line in the right menu as a or b, turn the M knob to move it. 6. Push the horizontal HOR button to enter wave zoom mode. Push Cursor to show the right menu, select Window as Main or Extension to make the cursors shown in the main window or zoom window.
-
Page 50: How To Use Executive Buttons
4.Advanced User Guidebook The description of the cursor menu in FFT mode is shown as the following table: Function Setting Description Menu Vamp Display the Vamp measurement cursor and menu. Freq Display the Freq measurement cursor and menu. Freq&Vamp Display the Freq and Vamp measurement cursor and Type menu. - Page 51 4.Advanced User Guidebook [Autoset] button It's a very useful and quick way to apply a set of pre-set functions to the incoming signal, and display the best possible viewing waveform of the signal and also works out some measurements for user as well. The details of functions applied to the signal when using Autoset are shown as the following table: Function Items...
- Page 52 4.Advanced User Guidebook Cancel Autoset : Go back to display the upper menu and waveform information Note: The Autoset function requires that the frequency of signal should be no lower than 20Hz, and the amplitude should be no less than 5mv. Otherwise, the Autoset function may be invalid.
-
Page 53: Communication With Pc
5.Communication with PC 5. Communication with PC The oscilloscope supports communications with a PC through USB. You can use the Oscilloscope communication software to store, analyze, display the data and remote control. To learn about how to operate the software, you can push F1 in the software to open the help document. -
Page 54: Demonstration
6.Demonstration 6. Demonstration Example 1: Measurement a Simple Signal The purpose of this example is to display an unknown signal in the circuit, and measure the frequency and peak-to-peak voltage of the signal. 1. Carry out the following operation steps for the rapid display of this signal: (1) Set the probe menu attenuation coefficient as 10X and that of the switch in the probe switch as 10X (see "How to Set the Probe Attenuation... -
Page 55: Example 2: Gain Of A Amplifier In A Metering Circuit
6.Demonstration Figure 6-1 Measure period and frequency value for a given signal Example 2: Gain of a Amplifier in a Metering Circuit The purpose of this example is to work out the Gain of an Amplifier in a Metering Circuit. First we use Oscilloscope to measure the amplitude of input signal and output signal from the circuit, then to work out the Gain by using given formulas. -
Page 56: Example 3: Capturing A Single Signal
6.Demonstration Gain (db) = 20×log (gain) Figure 6-2 Waveform of Gain Measurement Example 3: Capturing a Single Signal It's quite easy to use Digital Oscilloscope to capture non-periodic signal, such as a pulse and burr etc. But the common problem is how to set up a trigger if you have no knowledge of the signal? For example, if the pulse is the logic signal of a TTL level, the trigger level should be set to 2 volts and the trigger edge be set as the rising edge trigger. -
Page 57: Example 4: Analyze The Details Of A Signal
6.Demonstration (8) In the right menu, select Coupling as DC. (9) In the right menu press Next Page, select Slope as (rising). (10) Turn the Trigger Level knob and adjust the trigger level to the roughly 50% of the signal to be measured. (11) Check the Trigger State Indicator on the top of the screen, if it is not Ready, push down the Run/Stop button and start acquiring, wait for trigger to happen. - Page 58 6.Demonstration these noise. Here is how we do it: (1) Push the Acquire button to display the right menu. (2) In the right menu, select Acqu Mode as Peak Detect. The signal displayed on the screen containing some noise, by turning on Peak Detect function and changing time base to slow down the incoming signal, any peaks or burr would be detected by the function (see Figure 6-4).
-
Page 59: Example 5: Application Of X-Y Function
6.Demonstration Figure 6-5 Reduce Noise level by using Average function Example 5: Application of X-Y Function Examine the Phase Difference between Signals of two Channels Example: Test the phase change of the signal after it passes through a circuit network. X-Y mode is a very useful when examining the Phase shift of two related signals. -
Page 60: Example 6: Video Signal Trigger
6.Demonstration (7) Turn the Vertical Scale and Vertical Position knobs, optimizing the waveform. (8) With the elliptical oscillogram method adopted, observe and calculate the phase difference (see Figure 6-6). The signal must be centered and kept in the horizontal direction. Figure 6-6 Lissajous Graph Based on the expression sin (q) =A/B or C/D, thereinto, q is the phase difference angle, and the definitions of A, B, C, and D are shown as the graph... - Page 61 6.Demonstration (1) Push the Trigger Menu button to display the right menu. (2) In the right menu, select Type as Single. (3) In the right menu, select Single as Video. (4) In the right menu, select Source as CH1. (5) In the right menu, select Modu as NTSC. (6) In the right menu, press Next Page, select Sync as Field.
-
Page 62: Troubleshooting
7.Troubleshooting 7. Troubleshooting 1. Oscilloscope is powered on but no Display. Check whether the power connection is connected properly. Restart the instrument after completing the checks above. If the problem persists, please contact us and we will be under your service. - Page 63 8.Technical Specifications oscilloscope only, and Probes attenuation set as 10X. Only if the oscilloscope fulfills the following two conditions at first, these specification standards can be reached. This instrument should run for at least 30 minutes continuously under the specified operating temperature.
- Page 64 8.Technical Specifications Performance Characteristics Instruction Rise time (at input, ≤ 3.5 ns Typical) DC gain accuracy ± 3% Delta Volts between any two averages of ≥16 waveforms acquired with the same scope DC accuracy (average) setup and ambient conditions (△V): ±...
-
Page 65: General Technical Specifications
8.Technical Specifications Performance Characteristics Instruction 50% level setting Input signal frequency ≥ 50 Hz (typical) Edge trigger slope Rising, Falling Support standard NTSC, PAL and Modulation SECAM broadcast systems Video Trigger Line number 1-525 (NTSC) and 1-625 range (PAL/SECAM) General Technical Specifications Display Display Type 7"... -
Page 66: Appendix
9.Appendix 9. Appendix Appendix A: Enclosure (The accessories subject to final delivery.) Standard Accessories: Power Cord CD Rom Quick Guide USB Cable Probe Probe Adjust Safety hintsheet Appendix B: General Care and Cleaning General Care Do not store or leave the instrument where the liquid crystal display will be exposed to direct sunlight for long periods of time.
Need help?
Do you have a question about the DSO-2104 and is the answer not in the manual?
Questions and answers