Table of Contents
Advertisement
Quick Links
Advertisement
Table of Contents

Related Manuals for VOLTCRAFT DSO-5072H


Summary of Contents for VOLTCRAFT DSO-5072H
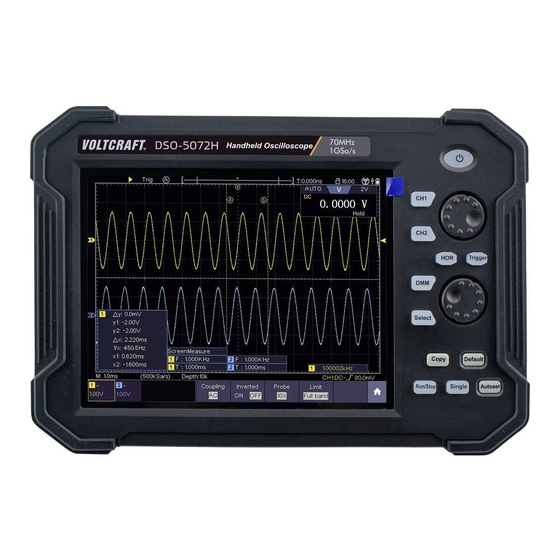
- Page 1 DSO-5072H Handheld Oscilloscope User Manual...
-
Page 2: Table Of Contents
Table of Contents 1. General Safety Requirements..................1 2. Safety Terms and Symbols...................2 3. Junior User Guidebook....................4 Introduction to the Structure of the Oscilloscope..............5 Front Panel...............................5 Side Panel..............................6 Top Panel..............................7 User Interface Introduction......................7 How to Implement the General Inspection................9 How to Implement the Function Inspection................ - Page 3 Measure with Cursors.......................... 74 Use Mathematical Manipulation Function..................77 Waveform math..............................78 User defined function............................79 Digital Filter................................79 Use Autoscale function........................80 Use HOR function..........................81 Use FFT function..........................81 Use XY Format............................88 Use Pass/Fail function......................... 89 Use Executive Buttons.........................90 Print the Screen Image........................92 5.
- Page 4 Example 6: Video Signal Trigger..................112 8. Troubleshooting......................113 9. Technical Specifications................... 114 Oscilloscope..........................114 Trigger............................116 Multimeter..........................117 General Technical Specifications..................118 10. Appendix........................119 Appendix A: Enclosure......................119 Appendix B: General Care and Cleaning................119 Appendix C: Battery Using Guide..................120...
-
Page 5: General Safety Requirements
1.General Safety Requirements 1. General Safety Requirements Before use, please read the following safety precautions to avoid any possible bodily injury and to prevent this product or any other connected products from damage. In order to avoid any contingent danger, ensure this product is only used within the range specified. -
Page 6: Safety Terms And Symbols
2.Safety Terms and Symbols 2. Safety Terms and Symbols Safety Terms Terms in this manual. The following terms may appear in this manual: Warning: Warning indicates the conditions or practices that could result in injury or loss of life. Caution: Caution indicates the conditions or practices that could result in damage to this product or other property. - Page 7 2.Safety Terms and Symbols short circuits, the 2 probe grounds must not be connected to 2 different non-isolated DC levels. The diagram of the oscilloscope ground wire connection: The diagram of the ground wire connection when the battery-powered oscilloscope is connected to the AC-powered PC through the ports: It is not allowed to measure AC power when the oscilloscope is AC powered, or when the battery-powered oscilloscope is connected to the AC-powered PC through the ports.
-
Page 8: Junior User Guidebook
3.Junior User Guidebook 3. Junior User Guidebook This chapter deals with the following topics mainly: Introduction to the structure of the oscilloscope Introduction to the user interface How to implement the general inspection How to implement the function inspection How to make a probe compensation How to set the probe attenuation coefficient How to use the probe safely How to implement a self-calibration... -
Page 9: Introduction To The Structure Of The Oscilloscope
3.Junior User Guidebook Introduction to the Structure of the Oscilloscope This chapter makes a simple description of the operation and function of the oscilloscope, enabling you to be familiar with the use of the oscilloscope in the shortest time. Front Panel The front panel has knobs and function buttons. -
Page 10: Side Panel
3.Junior User Guidebook the waveform zooming mode. 6. Trigger button: Accesses to trigger system setting. When the button light is on, the upper knob is used to adjust trigger level of current channel. 7. The lower knob: When one of the CH1, CH2 buttons is lighted, this knob is used to adjust the voltage scale of current channel. -
Page 11: Top Panel
3.Junior User Guidebook output. The output type can be set on the menu ( → Utility → Function → Output → Output). 3. USB Device port: It is used to transfer data when external USB equipment connects to the oscilloscope regarded as "slave device". For example: to use this port when connect PC to the oscilloscope by USB. - Page 12 3.Junior User Guidebook 1. Waveform Display Area. 2. Run/Stop (touchable) (see "Use Executive Buttons" on P93) 3. The state of trigger, including: Auto: Automatic mode and acquire waveform without triggering. Trig: Trigger detected and acquire waveform. Ready: Pre-triggered data captured and ready for a trigger. Click the to force a trigger signal, which is mainly applied to the "Normal"...
-
Page 13: How To Implement The General Inspection
3.Junior User Guidebook FFR, "FFF" the FFF, "LRR" the, "LRF" the LRF, "LFR" the LFR, "LFF" the LFF, "PD" the Delay A->B value, "ND" the Delay A->B value, "TR" the Cycle RMS, "CR" the Cursor RMS, "RP" the Phase A->B , "FP"... -
Page 14: How To Implement The Function Inspection
3.Junior User Guidebook the package. With the transportation department or our distributor responsible for this business informed about it, a repairing or replacement of the instrument will be arranged by us. How to Implement the Function Inspection Make a fast function check to verify the normal operation of the instrument, according to the following steps: 1. -
Page 15: How To Implement The Probe Compensation
3.Junior User Guidebook How to Implement the Probe Compensation When connect the probe with any input channel for the first time, make this adjustment to match the probe with the input channel. The probe which is not compensated or presents a compensation deviation will result in the measuring error or mistake. -
Page 16: How To Use The Probe Safely
3.Junior User Guidebook oscilloscope: (1) Push the function menu button of the used channels (CH1, CH2 button). (2) Select Probe in the bottom menu; select Attenu in the right menu, select the proper value corresponding to the probe in the left menu. This setting will be valid all the time before it is changed again. -
Page 17: How To Implement Self-Calibration
3.Junior User Guidebook Warning: To avoid electric shock, always keep your finger behind the safety guard ring of the probe during the operation. To protect you from suffering from the electric shock, do not touch any metal part of the probe tip when it is connected to the power supply. Before making any measurements, always connect the probe to the instrument and connect the ground terminal to the earth. -
Page 18: Introduction To The Horizontal System
3.Junior User Guidebook 1. Press CH1 or CH2 panel button to select the desired channel. 2. When one of the channel buttons is lit, you can use the upper knob to show the selected channel waveform in the center of the waveform window. The upper knob functions the regulating of the vertical display position of the selected channel waveform. -
Page 19: Introduction To The Trigger System
3.Junior User Guidebook Figure 3- 11 Horizontal Control 1. When the HOR button is lit, push the HOR button to switch between the normal mode and the wave zoom mode. 2. When the HOR button is lit, turn the lower knob to change the horizontal time base setting and observe the consequent status information change. -
Page 20: Touchscreen Controls
3.Junior User Guidebook 1. Click the icon on the right bottom of the display area, click Trig Menu to call out the trigger menu in the bottom. The trigger setting can be changed. 2. When the Trigger button is lit, use the upper knob to change the trigger level setting. - Page 21 3.Junior User Guidebook Scroll the list: If there is a scroll bar in the left menu, you can swipe up and down to scroll the list. Touchable menu panel: Click the icon on the right bottom of the display area, a menu will be shown.
- Page 22 3.Junior User Guidebook Note: Swipe up/down or left/right in this area, you can make the icon appear and control it. When the P icon appears, in the full screen, swipe left/right to control the horizontal position, swipe up/down to control the vertical position of the selected channel.
- Page 23 3.Junior User Guidebook When the L icon appears, in the full screen, swipe up/down to control the trigger level of the source in the trigger menu. Click the L icon to fine-turn, long-press to adjust continuously. Set the time base and the voltage division Click in the area as shown in the figure below, the M and V icons will appear.
- Page 24 3.Junior User Guidebook When the M and V icons appear, in the full screen, swipe left/right to change the time base, swipe up/down to change the voltage division of the selected channel. Click the icons to fine-turn, long-press to adjust continuously. In the full screen, pinch and spread horizontally to change the time base;...
- Page 25 3.Junior User Guidebook When the C icon appears, in the full screen, swipe left/right to move the selected line. Click the direction buttons of the C icon to fine-turn, long-press to move continuously. Click the center "ab" button to select a, b, or a&b.
-
Page 26: Advanced User Guidebook
4.Advanced User Guidebook 4. Advanced User Guidebook Up till now, you have already been familiar with the basic operations of the function areas, buttons and knobs in the front panel of the oscilloscope. Based the introduction of the previous Chapter, the user should have an initial knowledge of the determination of the change of the oscilloscope setting through observing the status bar. -
Page 27: How To Set The Vertical System
4.Advanced User Guidebook How to Set the Vertical System The VERTICAL CONTROLS include two menu buttons such as CH1, CH2, and two knobs such as the upper knob, the lower knob. Setting of CH1, CH2 Each channel has an independent vertical menu and each item is set respectively based on the channel. - Page 28 4.Advanced User Guidebook (2) Select Coupling in the bottom menu. (3) Select DC in the right menu. Both DC and AC components of the signal are passed. (4) Select AC in the right menu. The direct current component of the signal is blocked.
-
Page 29: How To Set The Horizontal System
4.Advanced User Guidebook (3) Select Full band in the right menu. The high frequency of the signal will be allowed to pass. (4) Select 20M in the right menu. The bandwidth is limited to 20 MHz. The frequencies above 20MHz will be rejected. Use the upper knob and the lower knob If you want to set the vertical position and vertical scale of a channel, press CH1 or CH2 at first to select the desired channel, then turn the upper knob to set the... -
Page 30: Waveform Horizontal Zooming
4.Advanced User Guidebook all channels (including mathematical operations). The resolution of this knob changes with the time base. The lower knob: When the HOR button is lit, adjust the horizontal scale of waveform. Horizontal HOR key: Switch between the normal mode and the waveform zooming mode. -
Page 31: Set The Trigger/Decoding System
4.Advanced User Guidebook Executive Buttons There are 5 executive buttons at the bottom right of the front panel: Copy, Default, Run/Stop, Single, Autoset. Set the Trigger/Decoding System Trigger determines when DSO starts to acquire data and display waveform. Once trigger is set correctly, it can convert the unstable display to meaningful waveform. - Page 32 4.Advanced User Guidebook Slope Trigger: The oscilloscope begins to trigger according to the signal rising or falling speed. Runt Trigger: Trigger pulses that pass through one trigger level but fail to pass through the other trigger level. Windows Trigger: Provide a high trigger level and low trigger level, the oscilloscope triggers when the input signal passes through the high trigger level or the low trigger level.
- Page 33 4.Advanced User Guidebook Holdoff 100 ns - 10 s, click to set time interval before another trigger occur, click to move cursor to choose which digit to be set. Sensitivity Set the trigger sensitivity. Trigger Level: trigger level indicates vertical trig position of the channel, turn the trig level knob or slide on the touch screen upward and downward to move trigger level, during setting, an orange red dotted line displays to show trig position, and the value of trigger level changes at the right corner, after setting,...
- Page 34 4.Advanced User Guidebook trigger type is pulse width, trigger source is CH1, coupling is DC, polarity is positive, and trigger level is 0.00mV. Pulse Width Trigger menu list: Menu Setting Instruction Single Pulse Set vertical channel trigger type as pulse trigger. Select CH1 as the trigger source Source Select CH2 as the trigger source...
- Page 35 4.Advanced User Guidebook Select CH1 as the trigger source Source Select CH2 as the trigger source slope Slope selecting When Set slope condition; click to set slope time, click to move cursor to choose which digit to be set. High level Click to set the High level upper limit.
- Page 36 4.Advanced User Guidebook Single Runt Set vertical channel trigger type as runt trigger. Select CH1 as the trigger source Source Select CH2 as the trigger source Up Level Click to set the up level threshold. Threshold Low Level Click to set the low level threshold. Positive Polarity, the oscilloscope triggers on the Polarity positive runt pulse.
- Page 37 4.Advanced User Guidebook Positive Polarity, the oscilloscope triggers on the Polarity positive Windows pulse. Negative Polarity, the oscilloscope triggers on the negative Windows pulse. Enter: Triggers when the trigger signal enters the specified trigger level range. Condition Exit: Triggers when the trigger signal exits the specified trigger level range.
- Page 38 4.Advanced User Guidebook Set idle time. Idle time means the minimum time of idle clock before searching data that can meet Configure Idle Time trigger conditions. Available range is 30ns-10s, default 100ns. Auto Acquire waveform even no trigger occurred Normal Acquire waveform when trigger occurred Single When trigger occurs, acquire one waveform then...
-
Page 39: Logic Trigger
4.Advanced User Guidebook Set vertical channel trigger type as Nth Edge Single Nth Edge trigger. Select CH1 as the trigger source Source Select CH2 as the trigger source Edge Trigger on the rising edge of the input signal when voltage level meets the specified trigger level. Edge Trigger on the falling edge of the input signal when voltage level meets the specified trigger level. -
Page 40: Bus Trigger
4.Advanced User Guidebook Set CH1 as High Level, Low level, high or low level, Rise and Fall. Set CH2 as High Level, Low level, high or low Input level, Rise and Fall. Mode Note: When input mode of one channel is set as Rise or Fall, the other channel could not be set as Rise and Fall at the same time. - Page 41 4.Advanced User Guidebook UART Trigger menu list: Menu Setting Instruction Set vertical channel bus type as UART Bus Type UART trigger. Select CH1 as the trigger source. Source Select CH2 as the trigger source. Polarity Normal Select polarity of data transmission as Input Normal.
- Page 42 4.Advanced User Guidebook Common Baud: click in the left menu to choose common baud. Custom Baud: click to choose baud, ranges from 50 to 10,000,000. Auto Acquire waveform even no trigger occurred Mode Normal Acquire waveform when trigger occurred When trigger occurs, acquire one waveform Holdoff Single then stop...
- Page 43 4.Advanced User Guidebook Trigger when SDA data is high during Ack Lost any acknowledgement of SCL clock position. Trigger on the read or write bit when the Addr preset address is met. Addr Set Address Bits to be “7”, “8” or “10”. Bits Set address according to the preset Addr...
- Page 44 4.Advanced User Guidebook Bus Type Set vertical channel bus type as SPI trigger. Set SCL. Source Set SDA. Set the minimum time that SCL must be idle, that is a period of SCL, available range 100ns-10s. Time out means SCL keeps idle for a specified Time Out Time out time before oscilloscope starts to search for the...
- Page 45 4.Advanced User Guidebook CAN Trigger menu list: Menu Setting Instruction Set vertical channel bus type as CAN trigger. Type Select CH1 as the trigger source. Source Select CH2 as the trigger source. CAN_H Actual CAN_H bus signal. CAN_L Actual CAN_L bus signal. Type Transmission signal on the CAN signal line.
-
Page 46: Bus Decoding (Optional)
4.Advanced User Guidebook Click to set the Byte number of bytes. The range is 1 Length to 8. Click to set value, Data click to move cursor. Trigger on the end frame of the data frame. Lost Trigger on Missing Ack. Error Trigger on Bit Stuffing Error. - Page 47 4.Advanced User Guidebook Click to set the Baud. The range is 50 to Custom 10,000,000. Baud Tip: You can select the nearest value in Common Baud, and then adjust it in this menu. Set the data width of each frame to match the signal. Data Bits It can be set to 5, 6, 7 or 8.
- Page 48 4.Advanced User Guidebook Note: Use the upper knob to adjust the thresholds of bus trigger and bus decoding. When the ACK (ACKnowledge Character) is not met, two red error marks will be displayed in the corresponding position in the waveform. I2C Decoding menu list: Menu Setting...
- Page 49 4.Advanced User Guidebook decoding. LS First in Bit Order menu item (Least Significant Bit First) means that the least significant bit will arrive first: hence e.g. the hexadecimal number 0x12, will arrive as the sequence 01001000 in binary representation, will be decoded as the reversed sequence 00010010.
- Page 50 4.Advanced User Guidebook switch to the ON state. Select bus type as CAN. set parameters based on the characteristics of the signal. When the parameters are set correctly, the information carried by the signal will be displayed. Tip: If there are repetitive menu items in both trigger menu and decoding menu, you can set anyone of them, the other will be changed synchronously.
-
Page 51: Implement Sampling Setup
4.Advanced User Guidebook Implement Sampling Setup to call up the menu panel. Click the Acquire softkey on panel, Acqu Click Mode, Length and Intrpl is shown in the bottom menu. The description of the Acqu Mode menu is shown as follows: Function Menu Setting Description... -
Page 52: Implement The Auxiliary System Function Setting
4.Advanced User Guidebook Figure 4- 3 Sine(x)/x interpolation Figure 4- 4 Linear interpolation Implement the Auxiliary System Function Setting ●Config Click to call up the menu panel. Click the Utility softkey on panel, select Function in the bottom menu, select Configure in the left menu. The description of Configure Menu is shown as the follows:... - Page 53 4.Advanced User Guidebook Function Setting Description Menu Choose the display language of the operating Language system. Display On/Off the date display Set Time Hour Min Setting Hour/Minute Day Month Setting Date/Month Year Setting Year Lock all keys. Unlock method: push HOR button, then push Trigger button, repeat 3 KeyLock times.
- Page 54 4.Advanced User Guidebook ProbeCh. Check whether probe attenuation is good. Do Self Cal (Self-Calibration) The self-calibration procedure can improve the accuracy of the oscilloscope under the ambient temperature to the greatest extent. If the change of the ambient temperature is up to or exceeds 5℃, the self-calibration procedure should be executed to obtain the highest level of accuracy.
-
Page 55: Set The Display System
4.Advanced User Guidebook Using the LAN port, the oscilloscope can be connected with a computer. Refer to "Communication with PC" on page 100 for the operation steps. ● Update Use the side panel USB port to update your instrument firmware using a USB memory device. - Page 56 4.Advanced User Guidebook (5) Select Clear in the bottom menu to erase the results of previous acquisitions from the display. The oscilloscope will start to accumulate acquisitions again. Color Color temperature function uses color-grading to indicate frequency of occurrence. The hot colors like red/yellow indicate frequently occurring events, and the colder colors like blue/green indicate rarely occurring events.
-
Page 57: Save And Recall A Waveform
4.Advanced User Guidebook Operation steps: , click the Trig Menu softkey on panel, set the trigger type to 1. Click Single, set the trigger mode to Edge, select the signal source. 2. Click , click the Display softkey on panel. 3. - Page 58 4.Advanced User Guidebook Close all the waveforms stored in the Close All object address. Save the waveform of the source to the selected address. Whatever the Type of save menu is set, you can save the waveform by just pressing the Copy Save panel button in any user interface.
- Page 59 4.Advanced User Guidebook 3. Saving: Select Type in the bottom menu, select Wave in the left menu. 4. Select Storage in the bottom menu, select Internal in the right menu. 5. Select Source in the bottom menu, check CH1, CH2, Math in the right menu for Source.
- Page 60 4.Advanced User Guidebook 1. Install the USB disk: Insert the USB disk into the "USB Host port" of "Figure 3- 2 Side Panel". If an icon appears on the top right of the screen, the USB disk is installed successfully. If the USB disk cannot be recognized, format the USB disk according to the methods in "USB disk Requirements"...
- Page 61 4.Advanced User Guidebook Figure 4- 6: Disk Management of computer 4. Right click 1 or 2 red mark area, choose Format. And system will pop up a warning message, click Yes. Figure 4- 7: Format the USB disk warning 5. Set File System as FAT32, Allocation unit size 4096. Check "Perform a quick format"...
- Page 62 4.Advanced User Guidebook Figure 4- 8: Formatting the USB disk setting 6. Formatting process. Figure 4- 9: Formatting the USB disk Check whether the USB disk is FAT32 with allocation unit size 4096 after formatting. Use Minitool Partition Wizard to format Download URL: http://www.partitionwizard.com/free-partition-manager.html Tip: There are many tools for the USB disk formatting on the market, just take...
- Page 63 4.Advanced User Guidebook 3. Click Reload Disk on the pull-down menu at the top left or push keyboard F5, and information about the USB disk will display on the right side with red mark 1 and 2. Figure 4- 10: Reload Disk 4.
-
Page 64: Record/Playback Waveforms
4.Advanced User Guidebook 6. Click Apply at the top left of the menu. Then click Yes on the pop-up warning to begin formatting. Figure 4- 13: Apply setting 7. Formatting process Figure 4- 14: Format process Format the USB disk successfully Figure 4- 15: Format successfully Record/Playback Waveforms Click... - Page 65 4.Advanced User Guidebook and storage function. The storage medium contains two kinds: Internal and External. When the storage medium is Internal, Wave Record contains four modes: OFF, Record, Playback and Storage. When storage medium is External, Wave Record contains two modes: OFF, Record.
- Page 66 4.Advanced User Guidebook Play Begin to record Operate Stop Stop recording Storage: Save the current wave according to the start frame and end frame set. Storage menu shows as follows: Menu Setting Instruction Click to select the number of start Start frame Storage frame to store (1 - 1000)
- Page 67 4.Advanced User Guidebook FrameSet Click to select the interval between Interval recorded frames (10ms - 10s) Infinity Record infinitely until the storage medium is full Refresh wave during recording Refresh Stop refreshing Play Begin to record Operate Stop Stop recording Note: Both of the waveforms of Channel 1 and Channel 2 will be recorded.
-
Page 68: Clone And Recall A Waveform
4.Advanced User Guidebook Figure 4- 16: Play back waveform by software Clone and Recall a waveform Click to call up the menu panel. Click the Save softkey on panel. Select Type in the bottom menu, select Clone in the left menu. You can clone one or two channel waveforms between two cursors, and save it as a cloned waveform into a USB memory device. - Page 69 4.Advanced User Guidebook Click line a to select it, swipe left/right to move it. Click line b to select it, swipe left/right to move it. Two cursors are linked. Click line a or b to select them, swipe left/right to move the pair of cursors. Set the cursors to select the entire screen automatically.
- Page 70 4.Advanced User Guidebook the USB memory device as an OTA file. Data format description of OTA waveform file If the source mode is set to Out1 or Out2, OTA file consists of two parts: the file header and the channel data. If the source mode is set to Out1&Out2, OTA file consists of three parts: file header, the first channel data, and the second channel data.
-
Page 71: Update Your Instrument Firmware
4.Advanced User Guidebook ADCB Parameter Meaning Value Comment name ADCB ADC bit, ADC 4 bytes int 8-bit or 12-bit resolution CHAN Parameter Meaning Value Comment name CHAN Number of 4 bytes int 1 or 2 channels VOL2 Parameter Meaning Value Comment name VOL2... - Page 72 4.Advanced User Guidebook to call up the menu panel. Click the Utility softkey on panel, 1. Click select Function in the bottom menu, select Configure in the left menu, select About in the bottom menu. View the model and the currently installed firmware version.
-
Page 73: Measure Automatically
4.Advanced User Guidebook Measure Automatically to call up the menu panel. Click the Measure softkey on panel to Click display the Measure menu. At most 8 types of measurements could be displayed on the bottom left of the screen. The oscilloscopes provide 39 parameters for auto measurement, including Period, Frequency, Mean, PK-PK, RMS, Max, Min, Top, Base, Amplitude, Overshoot, Preshoot, Rise Time, Fall Time, +PulseWidth, -PulseWidth, +Duty Cycle, -Duty Cycle, Screen Duty, FRR, FRF, FFR, FFF, LRR, LRF,... - Page 74 4.Advanced User Guidebook Measure Only if the waveform channel is in the ON state, the measurement can be performed. The automatic measurement cannot be performed in the following situation: 1) On the saved waveform. 2) On Waveform Math waveform. 3) On the Video trigger mode. On the Scan format, period and frequency cannot be measured.
- Page 75 4.Advanced User Guidebook Figure 4- 18 Mean: The arithmetic mean over the entire waveform. PK-PK: Peak-to-Peak Voltage. RMS: The true Root Mean Square voltage over the entire waveform. Max: The maximum amplitude. The most positive peak voltage measured over the entire waveform. Min: The minimum amplitude.
- Page 76 4.Advanced User Guidebook Figure 4- 19 Rise Time: Time that the leading edge of the first pulse in the waveform takes to rise from 10% to 90% of its amplitude. Fall Time: Time that the falling edge of the first pulse in the waveform takes to fall from 90% to 10% of its amplitude.
-
Page 77: Customize An Automatic Measurement
4.Advanced User Guidebook FFR: Time between Source A first falling edge and Source B first rising edge. FFF: Time between Source A first falling edge and Source B first falling edge. LRR: Time between Source A first rising edge and Source B last rising edge. LRF: Time between Source A first rising edge and Source B last falling edge. -
Page 78: Measure With Cursors
4.Advanced User Guidebook Screen menu button twice to set the cursor range. Statistics Select Statistics, you can choose On or Off to enable or disable statistics on the measurement value. Statistics reset: Restart statistics on statistics. Measure with Cursors to call up the menu panel. Click the Cursor softkey on panel to Click switch to the ON state and display the cursor menu. - Page 79 4.Advanced User Guidebook horizontal direction of the screen, two blue dotted lines displayed along the vertical direction of the screen. Cursor measure window at the left bottom of the screen shows the cursor readout. 4. In the bottom menu, select Line Type as Time to make the vertical cursors active.
- Page 80 4.Advanced User Guidebook Figure 4- 21 Auto Cursor The Cursor Measurement for FFT mode to call up the menu panel. Click the Cursor softkey on In FFT mode, click panel to switch to the ON state and display the cursor menu. The description of the cursor menu in FFT mode is shown as the following table: Function...
-
Page 81: Use Mathematical Manipulation Function
4.Advanced User Guidebook Perform the following operation steps for the amplitude and frequency cursor measurement of math FFT: to call up the menu panel. Click the FFT softkey on panel to 1. Click switch to the ON state and display the FFT menu. In the bottom menu, select Format. -
Page 82: Waveform Math
4.Advanced User Guidebook Vertical Click to adjust the vertical position of the (div) Math waveform Vertical Click to adjust the vertical division of the (V/div) Math waveform User Edit fun Intg, Diff, Sqrt, and user defined function Function Vertical Click to adjust the vertical position of the (div) Math waveform... -
Page 83: User Defined Function
4.Advanced User Guidebook waveform appears on the screen. 2.Select Waveform Math in the bottom menu. 3.In the right menu, select Factor1 as CH1. 4.Select Sign as + in the right menu. 5.In the right menu, select Factor2 as CH2. 6.Select Vertical (div) in the right menu, click to adjust the vertical position of Math waveform. -
Page 84: Use Autoscale Function
4.Advanced User Guidebook 4. In the right menu, select type, select the desired filter type. 5. In the right menu, select window, select the desired window. 6. When low-pass or high-pass type is selected, select cut-off fre in the right menu. When band-pass or band-reject type is selected, select upper or down in the right menu. -
Page 85: Use Hor Function
4.Advanced User Guidebook Figure 4- 22 Autoscale Horizontal-Vertical multi-period waveforms Note: 1. When entering into Autoscale function, a autoscale indicator will be flickering on the top left of the screen. 2. In the mode of Autoscale, the oscilloscope can self-estimate Trigger Mode (Edge, Video). - Page 86 4.Advanced User Guidebook The FFT menu: Function Menu Setting Description Source Select the FFT source. Hamming Rectangle Blackman Window Select window for FFT. Hanning Kaiser Bartlett V RMS V RMS and Decibels are amplitude Decibels Format units; Radian, Degrees are phase units. Radian Degrees Position value...
- Page 87 4.Advanced User Guidebook 4. In the bottom menu, select Format. In the right menu, select amplitude unit (V RMS, Decibels) or phase unit (Radian, Degrees). 5. In the bottom menu, select Display. In the right menu, select Hori (Hz); select repeatedly to make the symbol in front of the horizontal position value (the upper one), click to adjust the horizontal position of...
- Page 88 4.Advanced User Guidebook Best solution for magnitude, worst for frequency. Recommend to use for: Blackman Single frequency waveforms, to find higher order harmonics. Good for magnitude, but poorer frequency resolution than Hamming. Recommend to use for: Hanning Sine, periodic and narrow band random noise. ...
- Page 89 4.Advanced User Guidebook Figure 4- 23 Hamming window Figure 4- 24 Rectangle window...
- Page 90 4.Advanced User Guidebook Figure 4- 25 Blackman window Figure 4- 26 Hanning window...
- Page 91 4.Advanced User Guidebook Figure 4- 27 Kaiser window Figure 4- 28 Bartlett window...
-
Page 92: Use Xy Format
4.Advanced User Guidebook Notes for using FFT Use the default dB scale for details of multiple frequencies, even if they have very different amplitudes. Use the Vrms scale to compare frequencies. DC component or offset can cause incorrect magnitude values of FFT waveform. -
Page 93: Use Pass/Fail Function
4.Advanced User Guidebook Trigger control FFT Operation steps: 1. Click to call up the menu panel. Click the XY softkey on panel to switch to the ON state. 2. To make the XY view full screen, select Full Screen as ON in the bottom menu. -
Page 94: Use Executive Buttons
4.Advanced User Guidebook menu. Set Horizontal tolerance and Vertical tolerance in the right menu. Select Create in the right menu to create the rule. 3. Set output type: Select Output in the bottom menu to enter output option setting. Choose any one or two of the options "Pass", "Fail" or "Beep". "Pass"... - Page 95 4.Advanced User Guidebook When the horizontal time base is ≤50ms, the horizontal time base can be expanded for 4 divisions downwards. Single Push this button you can set the trigger mode as single directly, so when trigger occurs, acquire one waveform then stop. Autoset It's a very useful and quick way to apply a set of pre-set functions to the incoming signal, and display the best possible viewing waveform of the signal.
-
Page 96: Print The Screen Image
4.Advanced User Guidebook Note: When the autoscale is turned on and running, the Autoset button is invalid. Description for icon: Cancel Autoset: Go back to display the upper menu and waveform information. Note: The Autoset function requires that the frequency of signal should be no lower than 20Hz, and the amplitude should be no less than 5mv. -
Page 97: Use The Multimeter
5.Use the Multimeter 5. Use the Multimeter Input Terminals The input terminals are on the top of the oscilloscope, which marked as COM, V/Ω/C. Figure 5- 1 Multimeter Input Terminals DMM Menu Push DMM button on the front panel to enter/exit the multimeter function. The button backlight will be lighted when the multimeter function is enabled. -
Page 98: Dmm Information Window
5.Use the Multimeter Measuring capacitance Hold ON OFF Freeze the display during measurement. When making relative measurements, reading is Relative the difference between a stored reference value and the input signal. Configure Show Info Show/Hide the information window ON OFF Auto Range Select auto range mode Alte Range... -
Page 99: Making Multimeter Measurements
5.Use the Multimeter 7. The reference value of the relative measurement. 8. AC or DC when measuring current or voltage. Making Multimeter Measurements Measuring AC or DC Current (1) Push DMM button on the front panel. Select Current in the bottom menu, select it again to switch between ACA (AC current) or DCA (DC current). -
Page 100: Testing For Continuity
5.Use the Multimeter and the red test lead to the V/Ω/C terminal. (3) Connect the red test lead to the positive terminal (anode) of the diode and the black test lead to the negative terminal (cathode). The cathode of a diode is indicated with a band. -
Page 101: Information Display
5.Use the Multimeter Information Display Show/hide the information window on the top right of the display. (1) Select Configure in the bottom menu, select Show Info in the right menu as ON. The information window will be shown on the display. (2) Select OFF to hide. - Page 102 5.Use the Multimeter 1. Push DMM button on the front panel to enter the multimeter function. Select Current or Voltage in the bottom menu. If you want to enter the relative mode, select Configure in the bottom menu, select Relative in the right menu. to call up the menu panel.
- Page 103 5.Use the Multimeter 2. Select the data that you want to chart (see Figure 5- 4). 3. On the Insert tab, in the Charts group, click Line, and then click Line in 2-D Line (see Figure 5- 5). 4. The chart will be displayed (see Figure 5- 6). If you want to keep the chart, save the file to XLS format.
-
Page 104: Communication With Pc
6.Communication with PC 6. Communication with PC The oscilloscope supports communications with a PC through USB, LAN port. You can use the Oscilloscope communication software to store, analyze, display the data and remote control. To learn about how to operate the software, you can push F1 in the software to open the help document. -
Page 105: Using Lan Port
6.Communication with PC Using LAN Port Connect directly (1) Connection. Plug in the LAN cable to the LAN port in the right panel of the oscilloscope; plug the other end into the LAN interface of the computer. (2) Set the network parameters of the computer. Since the oscilloscope can not support obtaining an IP address automatically, you should assign a static IP address. -
Page 106: Connect Through A Router
6.Communication with PC Figure 6- 3 Set the network parameters of the Oscilloscope Software (4) Set the network parameters of the oscilloscope. In the oscilloscope, click icon, click Utility. Select Function in the bottom menu. Select LAN Set in the left menu. In the bottom menu, set the Type item as LAN, and select Set. - Page 107 6.Communication with PC IP address. The Default gateway and Subnet mask should be set according to the router. Here we set the IP address to 192.168.1.71, Subnet mask is 255.255.255.0, Default gateway is 192.168.1.1. Figure 6- 5 Set the network parameters of the computer (3) Set the network parameters of the Oscilloscope Software.
- Page 108 6.Communication with PC Figure 6- 6 Set the network parameters of the Oscilloscope Software (4) Set the network parameters of the oscilloscope. In the oscilloscope, click icon, click Utility. Select Function in the bottom menu. Select LAN Set in the left menu. In the bottom menu, set the Type item as LAN, and select Set.
-
Page 109: Demonstration
7.Demonstration 7. Demonstration Example 1: Measurement a Simple Signal The purpose of this example is to display an unknown signal in the circuit, and measure the frequency and peak-to-peak voltage of the signal. 1. Carry out the following operation steps for the rapid display of this signal: (1) Set the probe menu attenuation coefficient as 10X and that of the switch in the probe switch as 10X (see "How to Set the Probe Attenuation... -
Page 110: Example 2: Gain Of A Amplifier In A Metering Circuit
7.Demonstration Figure 7- 1 Measure period and frequency value for a given signal Example 2: Gain of a Amplifier in a Metering Circuit The purpose of this example is to work out the Gain of an Amplifier in a Metering Circuit. First we use Oscilloscope to measure the amplitude of input signal and output signal from the circuit, then to work out the Gain by using given formulas. -
Page 111: Example 3: Capturing A Single Signal
7.Demonstration bottom left of the screen (see Figure 7- 2). (11) Calculate the amplifier gain with the following formulas. Gain = Output Signal / Input signal Gain (db) = 20×log (gain) Figure 7- 2 Waveform of Gain Measurement Example 3: Capturing a Single Signal It's quite easy to use Digital Oscilloscope to capture non-periodic signal, such as a pulse and burr etc. - Page 112 7.Demonstration display the Acquire menu. (4) Select Acqu Mode in the bottom menu. Select Peak Detect in the right menu. to call up the menu panel. Click the Trig Menu softkey on panel (5) Click to display the Trigger menu. (6) Select the first menu item in the bottom menu.
-
Page 113: Example 4: Analyze The Details Of A Signal
7.Demonstration Example 4: Analyze the Details of a Signal Noise is very common inside most of the electronic signal. To find out what's inside the noise and reduce the level of noise is very important function our oscilloscope is capable to offer. Noise Analysis The level of noise sometime indicates a failure of electronic circuit. -
Page 114: Example 5: Application Of X-Y Function
7.Demonstration (2) Select Acqu Mode in the bottom menu. (3) Select Average in the right menu, select the average number in the left menu, observe the waveform obtained from averaging the waveforms of different average number. User would see a much-reduced random noise level and make it easy to see more details of the signal itself. - Page 115 7.Demonstration (3) Push the CH1 and CH2 button to turn on CH1 and CH2. (4) Push the Autoset button, with the oscilloscope turning on the signals of the two channels and displaying them in the screen. (5) Push CH1 button to select CH1, turn the lower knob, and then push CH2 button to select CH2, turn the lower knob, making the amplitudes of two signals equal in the rough.
-
Page 116: Example 6: Video Signal Trigger
7.Demonstration Example 6: Video Signal Trigger Observe the video circuit of a television, apply the video trigger and obtain the stable video output signal display. Video Field Trigger For the trigger in the video field, carry out operations according to the following steps: to call up the menu panel. -
Page 117: Troubleshooting
8.Troubleshooting 8. Troubleshooting 1. Oscilloscope is powered on but no Display. Check whether the power connection is connected properly. Restart the instrument after completing the checks above. If the problem persists, please contact us and we will be under your service. -
Page 118: Technical Specifications
9.Technical Specifications 9. Technical Specifications Unless otherwise specified, the technical specifications applied are for DSO-5000 dual-channel series only, and Probes attenuation set as 10X. Only if the oscilloscope fulfills the following two conditions at first, these specification standards can be reached. ... - Page 119 10.Appendix Performance Characteristics Instruction When two channels are turned on, the max Max Record length record length is 20M; and max 40M for one channel. Scanning speed (S/div) 2ns/div - 1000s/div, step by 1 – 2 - 5 Sampling rate / relay ±10 ppm max (Ta = +25℃) time accuracy Single:...
-
Page 120: Trigger
9.Technical Specifications Performance Characteristics Instruction Decoding Type UART, I C, SPI, CAN (optional) Waveform storage 100 waveforms Bandwidth Full bandwidth Lissajous Phase figure ±3 degrees difference Communication USB Host, USB Device; Trig Out(Pass/Fail); LAN port port Printer PictBridge Compatibility Counter Support Trigger Performance Characteristics... -
Page 121: Multimeter
9.Technical Specifications Edge Type Rising, Falling Timeout Trigger Idle Time 30 ns to 10 s Edge Type Rising, Falling Nth Edge Trigger Idle Time 30 ns to 10 s Edge Number 1 to 128 Logic Mode AND, OR, XNOR, XOR Input Mode H, L, X, Rising, Falling Logic Trigger... -
Page 122: General Technical Specifications
9.Technical Specifications DCV: 20mV, 200mV: ±(0.5%+10digit); 2V, 20V, 200V: ±(0.3%+5digit); 1000V: ±(0.5%+5digit) Max. input: DC 1000V Voltage ACV: 20mV, 200mV, 2V, 20V, 200V: ±(0.8%+10digit) 750V: ±(1%+10digit) Frequency: 40Hz-1000Hz, Max. input: AC 750V (virtual value) DCA: 10A: ±(2%+10digit) Current ACA: 10A: ±(2.5%+10digit) 200Ω: ±(0.8%+10digit) 2KΩ... -
Page 123: Appendix
10.Appendix 10. Appendix Appendix A: Enclosure (The accessories subject to final delivery.) Standard Accessories: Power Cord CD Rom Quick Guide Micro USB Cable Probes Current Ext Probe Adjust AC-DC Adapter Stand Holder BNC-SAM Module Multimeter Lead Safety hintsheet Options: Appendix B: General Care and Cleaning General Care Do not store or leave the instrument where the liquid crystal display will be exposed to direct sunlight for long periods of time. -
Page 124: Appendix C: Battery Using Guide
10.Appendix Inspect the instrument and probes as often as operating conditions require. To clean the instrument exterior, perform the following steps: 1. Wipe the dust from the instrument and probe surface with a soft cloth. Do not make any scuffing on the transparent LCD protection screen when clean the LCD screen. - Page 125 10.Appendix To avoid overheat of battery during charging, the ambient temperature is not allowed to exceed the permissible value given in technical specification. Replacing the Lithium Battery Unit It is usually not required to replace the battery unit. But when it is required to replace it, only qualified personnel can carry out this operation, and only use the same specification lithium battery.
Need help?
Do you have a question about the DSO-5072H and is the answer not in the manual?
Questions and answers