Table of Contents
Advertisement
Quick Links
Advertisement
Table of Contents

Subscribe to Our Youtube Channel
Related Manuals for VOLTCRAFT DSO-6102 WIFI


Summary of Contents for VOLTCRAFT DSO-6102 WIFI
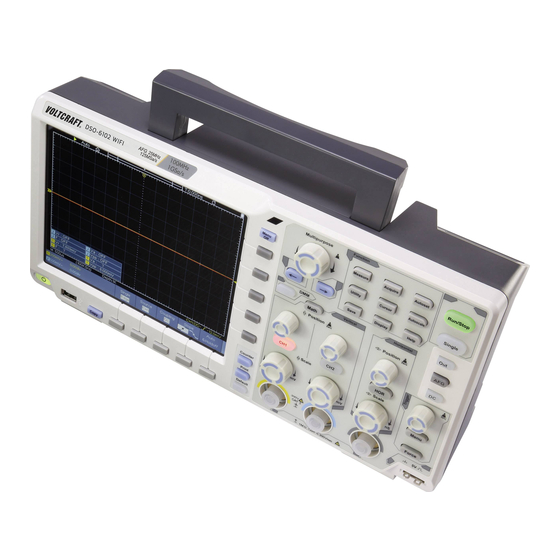
- Page 1 DSO-6102 WIFI Digital Storage Oscilloscope User Manual...
- Page 2 General Warranty We warrants that the product will be free from defects in materials and workmanship for a period of 3 years from the date of purchase of the product by the original purchaser from our company. The warranty period of accessories such as probe, battery is 12 months. This warranty only applies to the original purchaser and is not transferable to the third party.
-
Page 3: Table Of Contents
Table of Contents 1. General Safety Requirements ..................1 2. Safety Terms and Symbols ....................2 3. Junior User Guidebook ....................4 Introduction to the Structure of the Oscilloscope ..............5 Front Panel ............................... 5 Front Panel Menu Buttons ........................6 Rear Panel .............................. - Page 4 How to Set the Display System ......................50 How to Save and Recall a Waveform ..................... 53 How to Record/Playback Waveforms ....................60 How to Clone and Recall a waveform ....................64 How to Implement the Auxiliary System Function Setting ..............67 How to Update your Instrument Firmware.....................
- Page 5 Measuring Capacitance .......................... 94 Multimeter Features ........................95 Data Hold Mode ............................. 95 Making Relative Measurements ......................95 Information Display ..........................95 Auto or Manual Range ........................... 95 Multimeter Recorder......................... 95 7. Communication with PC ....................99 Using USB Port .......................... 99 Using LAN Port ........................
-
Page 6: General Safety Requirements
1.General Safety Requirements 1. General Safety Requirements Before any operations, please read the following safety precautions to avoid any possible bodily injury and prevent this product or any other products connected from damage. In order to avoid any contingent danger, this product is only used within the range specified. -
Page 7: Safety Terms And Symbols
2.Safety Terms and Symbols 2. Safety Terms and Symbols Safety Terms Terms in this manual. The following terms may appear in this manual: Warning: Warning indicates the conditions or practices that could result in injury or loss of life. Caution: Caution indicates the conditions or practices that could result in damage to this product or other property. - Page 8 2.Safety Terms and Symbols Warning The channels should adopt common basis during measuring. To prevent short circuits, the 2 probe ground must not be connected to 2 different non-isolated DC level. The diagram of the oscilloscope ground wire connection: Probe Oscilloscope Electrical Outlet Signal Input...
-
Page 9: Junior User Guidebook
3.Junior User Guidebook 3. Junior User Guidebook This chapter deals with the following topics mainly: Introduction to the structure of the oscilloscope Introduction to the user interface How to implement the general inspection How to implement the function inspection ... -
Page 10: Introduction To The Structure Of The Oscilloscope
3.Junior User Guidebook Introduction to the Structure of the Oscilloscope This chapter makes a simple description of the operation and function of the front panel of the oscilloscope, enabling you to be familiar with the use of the oscilloscope in the shortest time. -
Page 11: Front Panel Menu Buttons
3.Junior User Guidebook the oscilloscope regarded as "host device". For example: Saving the waveform to USB flash disk needs to use this port. 8. Power on/off Backlight of this button: Red light: The oscilloscope is turned off (connects with AC Power or battery); Green light: The oscilloscope is turned on (powered by AC Power or battery). -
Page 12: Control Area
3.Junior User Guidebook 6. Foot stool: Adjust the tilt angle of the oscilloscope. 7. LAN port: the network port which can be used to connect with PC. 8. USB Device port: It is used to transfer data when external USB equipment connects to the oscilloscope regarded as "slave device". -
Page 13: User Interface Introduction
3.Junior User Guidebook 6. Default: Call out the factory settings. 7. Print 8. Turn on/off the Counter. 9. DMM 10. Direction key: Move the cursor of the focused parameter. 11. M knob (Multipurpose knob): when a symbol appears in the menu, it indicates you can turn the M knob to select the menu or set the value. - Page 14 3.Junior User Guidebook Touchscreen" on P17) 5. The two blue dotted lines indicates the vertical position of cursor measurement. The T pointer indicates the horizontal position for the trigger. The pointer indicates the trigger position in the record length. It shows present triggering value and displays the site of present window in internal memory.
-
Page 15: How To Implement The General Inspection
3.Junior User Guidebook The icon shows the coupling mode of the channel. "—" indicates direct current coupling "~" indicates AC coupling " " indicates GND coupling 26. The reading shows the setting of main time base. 27. It is cursor measure window, showing the absolute values and the readings of the cursors. -
Page 16: How To Implement The Probe Compensation
3.Junior User Guidebook 1. Connect the power cord to a power source. Long press the button on the bottom left of the instrument. The instrument carries out all self-check items and shows the Boot Logo. Push the Utility button, select Function in the bottom menu. Select Adjust in the left menu, select Default in the bottom menu. -
Page 17: How To Set The Probe Attenuation Coefficient
3.Junior User Guidebook 1. Set the attenuation coefficient of the probe in the menu as 10X and that of the switch in the probe as 10X (see "How to Set the Probe Attenuation Coefficient" on P12), and connect the probe with the CH1 channel. If a probe hook tip is used, ensure that it keeps in close touch with the probe. -
Page 18: How To Use The Probe Safely
3.Junior User Guidebook Caution: The default attenuation coefficient of the probe on the instrument is preset to 10X. Make sure that the set value of the attenuation switch in the probe is the same as the menu selection of the probe attenuation coefficient in the oscilloscope. -
Page 19: How To Implement Self-Calibration
3.Junior User Guidebook Warning: To avoid electric shock, always keep your finger behind the safety guard ring of the probe during the operation. To protect you from suffering from the electric shock, do not touch any metal part of the probe tip when it is connected to the power supply. Before making any measurements, always connect the probe to the instrument and connect the ground terminal to the earth. -
Page 20: Introduction To The Horizontal System
3.Junior User Guidebook Measuring Skill If the channel is under the DC coupling mode, you can rapidly measure the DC component of the signal through the observation of the difference between the wave form and the signal ground. If the channel is under the AC mode, the DC component would be filtered out. This mode helps you display the AC component of the signal with a higher sensitivity. -
Page 21: Introduction To The Trigger System
3.Junior User Guidebook observe the consequent status information change. Turn the Horizontal Scale knob to change the horizontal time base, and it can be found that the Horizontal Time Base display in the status bar changes accordingly. Use the Horizontal Position knob to adjust the horizontal position of the signal in the waveform window. -
Page 22: Touchscreen Controls
3.Junior User Guidebook Touchscreen Controls You can control the oscilloscope by different gestures. The touchable icon at the top right of the screen is used to enable ( ) or disable ( the touchscreen controls. The instruction of touchscreen controls is as below. You can also use the buttons / knobs enclosed in brackets to do the same thing. - Page 23 3.Junior User Guidebook corresponding channel to make it in selected state. Set the vertical position of the selected channel (Vertical Position knob): Swipe up or down on the screen. Control the vertical position Touch to select the channel of the selected channel Selected Unselected ...
- Page 24 3.Junior User Guidebook Control the horizontal position Double Zoom and Single Zoom In touchable menu pane, if DoubleZoom is selected, in the display area, pinch and spread horizontally to change the time base; pinch and spread vertically to change the voltage division of current channel.
- Page 25 3.Junior User Guidebook Pinch and spread Pinch and spread vertically to change the voltage horizontally to change the time base division of current channel In touchable menu pane, if SingleZoom is selected, click anywhere on the Display area to show the touching control panel. Click to increase Click to increase the voltage...
-
Page 26: Gestures In Wave Zoom Mode
3.Junior User Guidebook the voltage division of CH1; click on the left lower area to decrease the voltage division of CH1. Click on the right upper area to increase the voltage division of CH2; click on the right lower area to decrease the voltage division of CH2. ... - Page 27 3.Junior User Guidebook Control the horizontal position of Zoom Window Pinch and spread Pinch and spread vertically horizontally to change to change the voltage the time base division of current channel of Zoom Window (Double Zoom)
-
Page 28: Other Operations Using Touchscreen
3.Junior User Guidebook Click to increase Click to increase the voltage division of CH1 the voltage division of CH2 Click to increase Click to decrease the time base of the time base of Zoom Window Zoom Window Click to decrease Click to decrease the voltage division of CH1 the voltage division of CH2... - Page 29 3.Junior User Guidebook Click to increase the value of cursor position Move the cursor Click to decrease the value of cursor position...
-
Page 30: Advanced User Guidebook
4.Advanced User Guidebook 4. Advanced User Guidebook Up till now, you have already been familiar with the basic operations of the function areas, buttons and knobs in the front panel of the oscilloscope. Based the introduction of the previous Chapter, the user should have an initial knowledge of the determination of the change of the oscilloscope setting through observing the status bar. -
Page 31: How To Set The Vertical System
4.Advanced User Guidebook How to Set the Vertical System The VERTICAL CONTROLS includes three menu buttons such as CH1, CH2 and Math, and four knobs such as Vertical Position, Vertical Scale for each channel. Setting of CH1 and CH2 Each channel has an independent vertical menu and each item is set respectively based on the channel. - Page 32 4.Advanced User Guidebook (3) Select DC in the right menu. Both DC and AC components of the signal are passed. (4) Select AC in the right menu. The direct current component of the signal is blocked. 2. To adjust the probe attenuation For correct measurements, the attenuation coefficient settings in the operating menu of the Channel should always match what is on the probe (see "How to Set the Probe Attenuation Coefficient"...
-
Page 33: Use Mathematical Manipulation Function
4.Advanced User Guidebook (4) Select 20M in the right menu. The bandwidth is limited to 20 MHz. The frequencies above 20MHz will be rejected. Use Mathematical Manipulation Function The Mathematical Manipulation function is used to show the results of the addition, multiplication, division and subtraction operations between two channels, or the FFT operation for a channel. -
Page 34: Using Fft Function
4.Advanced User Guidebook waveform appears on the screen. Select Dual Wfm Math in the bottom menu. In the right menu, select Factor1 as CH1. 4. Select Sign as + in the right menu. 5. In the right menu, select Factor2 as CH2. 6. - Page 35 4.Advanced User Guidebook Better solution for magnitude than Rectangle, and good for frequency as well. It has slightly better frequency resolution than Hanning. Recommend to use for: Hamming Sine, periodic and narrow band random noise. Transients or bursts where the signal levels before and after the event are significantly different.
-
Page 36: Use Vertical Position And Scale Knobs
4.Advanced User Guidebook The frequency resolution when using the Kaiser window is fair; the spectral leakage and amplitude accuracy are both good. The Kaiser window is best used when frequencies Kaiser are very close to the same value but have widely differing amplitudes (the side lobe level and shape factor are closest to the traditional Gaussian RBW). -
Page 37: How To Set The Horizontal System
4.Advanced User Guidebook Figure 4-1 Information about Vertical Position How to Set the Horizontal System The HORIZONTAL CONTROLS includes the Horizontal HOR button and such knobs as Horizontal Position and Horizontal Scale. Horizontal Position knob: this knob is used to adjust the horizontal positions of all channels (include those obtained from the mathematical manipulation), the analytic resolution of which changes with the time base. -
Page 38: How To Set The Trigger System
4.Advanced User Guidebook Selected portion Main Window Time base of Horizontal position of Zoom window Zoom window Zoom Window In normal mode, the Horizontal Position and Horizontal Scale knobs are used to adjust the horizontal position and time base of the Main window. In wave zoom mode, the Horizontal Position and Horizontal Scale knobs are used to adjust the horizontal position and time base of the Zoom window. -
Page 39: Single Trigger
4.Advanced User Guidebook Key operation: Press Trigger Menu panel button, then bottom menu Trigger Type, select Single, ALT, Logic or Bus Trigger on the popup right menus, rotate M knob to choose different trigger types. Touch operation: Click Main menu icon on the left top of the screen, select Trig Menu, click bottom button Trigger Type, choose Single, ALT, Logic or Bus Trigger on the popup right menus, click to choose different trigger types。... - Page 40 4.Advanced User Guidebook An edge trigger occurs on trigger level value of the specified edge of input signal. Select Edge trigger mode to trigger on rising edge or falling edge. In Edge Trigger mode, the trigger setting information is displayed on bottom right of ,indicates that trigger type is edge, the screen, for example, trigger source is CH1, coupling is DC, and trigger level is 0.00mV.
- Page 41 4.Advanced User Guidebook ,indicates that trigger type is Video, trigger the screen, for example, source is CH1, and Sync type is Even. Video Trigger menu list: MENU SETTING INSTRUCTION Single Mode Video Set vertical channel trigger type as video trigger Select CH1 as the trigger source Source Select CH2 as the trigger source...
- Page 42 4.Advanced User Guidebook Set slope condition; turn the M knob or click set slope time, press panel button or click to move cursor to choose which digit to be set. High level Adjust M knob to set the High level upper limit. Threshold Low level Adjust M knob to set Low level lower limit.
- Page 43 4.Advanced User Guidebook Select pulse width condition and adjust the M knob or click to set time, press panel button or click to move cursor to choose which digit to be set. Auto Acquire waveform even no trigger occurred Normal Acquire waveform when trigger occurred Single When trigger occurs, acquire one waveform then stop...
- Page 44 4.Advanced User Guidebook Select CH1 as the trigger source. Source Select CH2 as the trigger source. Adjust the M knob or click to set the up level Up Level threshold. Threshold Adjust the M knob or click to set the low level Low Level threshold.
- Page 45 4.Advanced User Guidebook windows, trigger source is CH1, polarity is positive, 0.00mV the differential between up level and low level threshold. Windows Trigger menu list: MENU SETTING INSTRUCTION Single Set vertical channel trigger type as Windows trigger. Windows Mode Select CH1 as the trigger source. Source Select CH2 as the trigger source.
- Page 46 4.Advanced User Guidebook 7.Timeout Trigger The oscilloscope triggers when the time interval from when the rising edge (or the falling edge) passes through the trigger level to when the neighbouring falling edge (or the rising edge) passes through the trigger level is greater than the timeout time set.
- Page 47 4.Advanced User Guidebook In Nth Edge Trigger mode, the trigger setting information is displayed on bottom right ,indicates that trigger type is Nth of the screen, for example, Edge, trigger source is CH1, -150V is up level or low level threshold. Nth Edge Trigger Nth Edge Trigger menu list: MENU...
-
Page 48: Alternate Trigger (Trigger Mode: Edge)
4.Advanced User Guidebook Auto Acquire waveform even no trigger occurred Normal Acquire waveform when trigger occurred Single When trigger occurs, acquire one waveform then stop Mode 100 ns - 10 s, adjust M knob or click to set time Holdoff Holdoff interval before another trigger occur, press panel button or click... -
Page 49: Bus Trigger
4.Advanced User Guidebook Logic Trigger menu list: MENU SETTING INSTRUCTION Single Set vertical channel trigger type as Logic trigger. Logic Mode Set logic mode as AND. Logic Set logic mode as OR. Mode XNOR Set logic mode as XNOR. Set logic mode as XOR. Set CH1 as High Level, Low level, high or low level, Rise and Fall. - Page 50 4.Advanced User Guidebook ,indicates that trigger type right of the screen, for example, is RS232, CH1 trigger level is 0.00mV. Format as shown in the figure below, RS232 Trigger RS232 Trigger menu list: MENU SETTING INSTRUCTION Bus Type RS232 Set vertical channel bus type as RS232 trigger. Sour CH1 Select CH1 as the trigger source.
- Page 51 4.Advanced User Guidebook Common Baud: adjust M knob to choose common baud. Custom Baud: adjust M knob to choose baud, ranges from 50 to 10,000,000. Data Bits:Set as 5、6、7、8 bits. Data Data: Set data according to data bits, ranges from 0-31, 0-63, 0-127 or 0-255.
- Page 52 4.Advanced User Guidebook Trigger when SDA data is high during any Ack Lost acknowledgement of SCL clock position. Trigger on the read or write bit when the preset Address address is met. Addr Set Address Bits to be “7”、“8”or“10”. Bits Addr Set address according to the preset address bits, address range is 0-127, 0-255, 0-1023 respectively.
-
Page 53: How To Operate The Function Menu
4.Advanced User Guidebook Set the minimum time that SCL must be idle, available range 100ns-10s. Time out means SCL keeps idle for a specified time before oscilloscope starts to search for the data(SDA) on which to trigger. adjust M knob or Time Out Time out click... - Page 54 4.Advanced User Guidebook Mode Use to capture maximal and minimal samples. Finding highest and lowest points Peak Detect over adjacent intervals. It is used for the detection of the jamming burr and the possibility of reducing the confusion. It is used to reduce the random and don't-care Average 4, 16, 64, 128 noises, with the optional number of averages.
-
Page 55: How To Set The Display System
4.Advanced User Guidebook Sine(x)/x interpolation Linear interpolation How to Set the Display System Push the Display button and the Display menu is shown as follows:... - Page 56 4.Advanced User Guidebook Function Menu Setting Description Dots Only the sampling points are displayed. Type Vect The space between the adjacent sampling points in the display is filled with the vector form. 1 Second Persist 2 Seconds Set the persistence time Persist 5 Seconds &Color...
- Page 57 4.Advanced User Guidebook Cold (1) Push the Display button. (2) Select Persist&Color in the bottom menu. (3) Select Color in the right menu, choose between ON/OFF. Figure 4-2 The color temperature function is on XY Format This format is only applicable to Channel 1 and Channel 2. After the XY display format is selected, Channel 1 is displayed in the horizontal axis and Channel 2 in the vertical axis;...
-
Page 58: How To Save And Recall A Waveform
4.Advanced User Guidebook Reference or digital wave form Cursor Trigger control FFT Operation steps: 1. Push the Display button. 2. Select XY Mode as ON or OFF in the bottom menu. Counter It is a 6-digit single-channel counter. The counter can only measure the frequency of the triggering channel. - Page 59 4.Advanced User Guidebook Choose the waveform to be saved. (If certain channel is off, the corresponding Math menu item will be disabled.) Source (Choose All to save all the waveforms that are turned on. You can save into the current internal object address, or into USB storage as a single file.) Choose the address which the waveform is Object...
- Page 60 4.Advanced User Guidebook Save the current display screen. The file can be only stored in a USB storage, so a Save USB storage must be connected first. The file name is editable. The file is stored in BMP format. Save and Recall the Waveform The oscilloscope can store 100 waveforms, which can be displayed with the current waveform at the same time.
- Page 61 4.Advanced User Guidebook 8. Recalling: The BIN waveform file could be open by waveform analysis software (on the supplied CD). Tip: Whatever the Type of save menu is set, you can save the waveform by just pressing the Copy panel button in any user interface. If the Storage of the save menu is set as "External", you should install the USB disk.
- Page 62 4.Advanced User Guidebook Figure 4-3: Disk Management of computer 4. Right click 1 or 2 red mark area, choose Format. And system will pop up a warning message, click Yes. Figure 4-4: Format the USB disk warning 5. Set File System as FAT32, Allocation unit size 4096. Check "Perform a quick format"...
- Page 63 4.Advanced User Guidebook Figure 4-5: Formatting the USB disk setting 6. Formatting process. Figure 4-6: Formatting the USB disk Check whether the USB disk is FAT32 with allocation unit size 4096 after formatting. Use Minitool Partition Wizard to format Download URL: http://www.partitionwizard.com/free-partition-manager.html Tip: There are many tools for the USB disk formatting on the market, just take Minitool Partition Wizard for example here.
- Page 64 4.Advanced User Guidebook 3. Click Reload Disk on the pull-down menu at the top left or push keyboard F5, and information about the USB disk will display on the right side with red mark 1 and 2. Figure 4-7: Reload Disk 4.
-
Page 65: How To Record/Playback Waveforms
4.Advanced User Guidebook 6. Click Apply at the top left of the menu. Then click Yes on the pop-up warning to begin formatting. Figure 4-10: Apply setting 7. Formatting process Figure 4-11: Format process Format the USB disk successfully Figure 4-12: Format successfully How to Record/Playback Waveforms Wave Record function can record the input current wave. - Page 66 4.Advanced User Guidebook Record, Playback and Storage. When storage medium is External, Wave Record contains two modes: OFF, Record. Record: To record wave according to the interval until it reaches the end frame set. Record menu (Internal Storage) shows as follows: Menu Setting Instruction...
- Page 67 4.Advanced User Guidebook Mode to store (1 - 1000) Frame Set Turn the M knob to select the number of end frame to End frame store (1 - 1000) Save Save the waveform record file to the internal memory Load Load the waveform record file from the memory To use wave record function, do as follows: (1) Push Save button.
- Page 68 4.Advanced User Guidebook Both of the waveforms of Channel 1 and Channel 2 will be recorded. If a Channel is turned off while recording, the waveform of the channel is invalid in the playback mode. To use wave record to external, do as follows: 1.
-
Page 69: How To Clone And Recall A Waveform
4.Advanced User Guidebook How to Clone and Recall a waveform You can clone the waveform of one channel between two cursors, and save it in the internal memory or on a USB memory device. You can save four cloned waveforms in the instrument internal memory. - Page 70 4.Advanced User Guidebook is 2M. Push the Acquire button, select Length in the bottom menu, and set the record length to a smaller value. (5) Select Save in the bottom menu. To save the waveform to internal memory, select Storage in the right menu as Internal.
- Page 71 4.Advanced User Guidebook desired waveform. (5) Select Clone in the bottom menu. (6) Select Clone in the right menu. The generator will output the waveform between two cursors. Move the cursors by gestures About the gestures for moving cursors, you can refer to "Other Operations Using Touchscreen"...
-
Page 72: How To Implement The Auxiliary System Function Setting
4.Advanced User Guidebook resolution CHAN Parameter name Meaning Value Comment CHAN Number of channels 4 bytes int 1 or 2 VOL2 Parameter name Meaning Value Comment VOL2 Voltage division, 4 bytes float The value indicates voltage divided by 400 is (the unit is mV), such as 200 ADC resolution. - Page 73 4.Advanced User Guidebook Function Menu Setting Description BackLight 0% - 100% Turn the M knob to adjust the backlight. Graticule Select the grid type Battery Turn on or off the battery display Menu Time OFF, 5s - 30s Set the disappear time of menu ●Adjust Push the Utility button, select Function in the bottom menu, select Adjust in the left menu.
- Page 74 4.Advanced User Guidebook 3. Select ProbeCh. in the bottom menu, tips about probe checking shows on the screen. 4. Select ProbeCh. again to begin probe checking and the checking result will occur after 3s; push any other key to quit. ●...
- Page 75 4.Advanced User Guidebook 5. Begin to test: Select Operate in the bottom menu, select Operate in the right menu as Start, the test will begin. 6. Save rule: Select SaveRule in the bottom menu. Select the save location in the left menu, and then select Save in the right menu to save the rules, which could be called up at once when need.
-
Page 76: How To Update Your Instrument Firmware
4.Advanced User Guidebook You can use the multimeter data recorder to record the measurements when measuring current/voltage by multimeter. Refer to "Multimeter Recorder" on page 95. How to Update your Instrument Firmware Use the front-panel USB port to update your instrument firmware using a USB memory device. -
Page 77: How To Measure Automatically
4.Advanced User Guidebook Long press the button to power on the instrument. How to Measure Automatically Push the Measure button to display the menu for the settings of the Automatic Measurements. At most 8 types of measurements could be displayed on the bottom left of the screen. - Page 78 4.Advanced User Guidebook Measure Only if the waveform channel is in the ON state, the measurement can be performed. The automatic measurement can not be performed in the following situation: 1) On the saved waveform. 2) On the Dual Wfm Math waveform. 3) On the Video trigger mode.
- Page 79 4.Advanced User Guidebook Figure 4-15 Mean: The arithmetic mean over the entire waveform. PK-PK: Peak-to-Peak Voltage. RMS: The true Root Mean Square voltage over the entire waveform. Max: The maximum amplitude. The most positive peak voltage measured over the entire waveform. Min: The minimum amplitude.
- Page 80 4.Advanced User Guidebook Figure 4-16 Rise Time: Time that the leading edge of the first pulse in the waveform takes to rise from 10% to 90% of its amplitude. Fall Time: Time that the falling edge of the first pulse in the waveform takes to fall from 90% to 10% of its amplitude.
-
Page 81: How To Measure With Cursors
4.Advanced User Guidebook reference value to the low reference value in the waveform. Area : The area of the whole waveform within the screen and the unit is voltage-second. The area measured above the zero reference (namely the vertical offset) is positive; the area measured below the zero reference is negative. The area measured is the algebraic sum of the area of the whole waveform within the screen. - Page 82 4.Advanced User Guidebook 2. In the bottom menu, select Source as CH1. Select the first menu item in the bottom menu, the Type menu will display at the right of the screen. In the right menu, select Time&Voltage for Type, two blue dotted lines displayed along the horizontal direction of the screen, two blue dotted lines displayed along the vertical direction of the screen.
- Page 83 4.Advanced User Guidebook Auto Cursor Move the cursors by gestures About the gestures for moving cursors, see "Other Operations Using Touchscreen" on P23. The Cursor Measurement for FFT mode In FFT mode, push the Cursor button to turn cursors on and display the cursor menu. The description of the cursor menu in FFT mode is shown as the following table: Function Setting...
-
Page 84: How To Use Autoscale
4.Advanced User Guidebook measurement of math FFT: Press the Math button to display the math menu in the bottom. Select FFT. Push Cursor to display the cursor menu. In the bottom menu, select Window as Extension. Select the first menu item in the bottom menu, the Type menu will display at the right of the screen. - Page 85 4.Advanced User Guidebook 1. Push the Autoscale button, the function menu will appear. 2. In the bottom menu, select ON in the Autoscale menu item. 3. In the bottom menu, Select Mode. In the right menu, select 4. In the bottom menu, Select Wave. In the right menu, select Then the wave is displayed in the screen, shown as Figure 4-18.
-
Page 86: How To Use Built-In Help
4.Advanced User Guidebook How to Use Built-in Help 1. Push Help button, the catalog will display in the screen. 2. In the bottom menu, press Prev Page or Next Page to choose help topic, or just turn the M knob to choose. 3. - Page 87 4.Advanced User Guidebook Square: ( Multi-period, Single-period, Rising Edge, Falling Edge, Cancel Autoset Video signal: DC level, Unknown signal: Description for some icons: Multi-period: To display multiple periods Single-period: To display single period FFT: Switch to FFT mode Rising Edge: Display the rising edge of square waveform Falling Edge:...
-
Page 88: How To Print The Screen Image
4.Advanced User Guidebook How to Print the Screen Image To print an image of what appears on the oscilloscope screen, do as the follows: (1) Connect the printer to the USB Device port on the rear panel of the oscilloscope. Note: The USB Device port supports PictBridge compatible printers. -
Page 89: Use The Arbitrary Function Generator
5.Use the Arbitrary Function Generator 5. Use the Arbitrary Function Generator The oscilloscope contains an integrated arbitrary function generator (25 MHz, single-channel). The function generator provides 4 basic waveforms (sine, square, ramp, and pulse) and 46 built-in arbitrary waveforms (Noise, Exponential rise, Exponential fall, Sin(x)/x, Staircase, etc.). -
Page 90: To Set The Period
5.Use the Arbitrary Function Generator M knob to move between the keys. Push the M knob to input the chosen key. Clear Units Use the touchscreen: Click to increase the value of cursor position Move the cursor Click to decrease the value of cursor position To Set the Period Select Period in the right menu (if Period is not displayed, select Frequency and select it... -
Page 91: To Set The High Level
5.Use the Arbitrary Function Generator To Set the High Level Select High Level in the right menu (if High Level is not displayed, select Amplitude and select it again to switch to High Level). Set the parameter in the right menu. To Set the Low Level Select Low Level in the right menu (if Low Level is not displayed, select Offset and select it again to switch to Low Level). -
Page 92: To Select The Built-In Waveform
5.Use the Arbitrary Function Generator The Arbitrary signal consists of two types: the system built-in waveform and the user-definable waveform. To Select the Built-in Waveform There are 46 built-in Arbitrary waveforms. Steps for selecting the built-in waveform: (1) Push button to show the bottom menu of generator. (2) Select Arb in the bottom menu, select Built-in on the right menu. -
Page 93: The User-Definable Waveform
5.Use the Arbitrary Function Generator NPulse Negative pulse Maths ExpRise Exponential rise function ExpFall Exponential fall function Sinc Sinc function Tangent Cotangent Sqrt Square root Square function HaverSine HaverSine function Lorentz Lorentz function Natural logarithm function Cubic Cubic function Cauchy Cauchy distribution Besselj BesselI function... - Page 94 5.Use the Arbitrary Function Generator device (USBDEVICE). How to Create a New Waveform (1) Enter the operation menu: Push button. Select Arb in the bottom menu, select Editable on the right menu, and select New. (2) Set the number of waveform points: Select Points in the right menu, turn the M knob to change the value, or use the input keyboard (push the M knob to show it) to input the value and choose the unit.
- Page 95 5.Use the Arbitrary Function Generator Enter the desired storage path, select Save in the right menu, an input keyboard pops up, input the file name, choose in the keyboard to confirm . The waveform is saved as BIN file in the folder. Note: The input length can have up to 35 characters.
-
Page 96: Use The Multimeter
6.Use the Multimeter 6. Use the Multimeter Input Terminals The input terminals are on the back of the oscilloscope, which marked as 10A, mA, COM, IEC II Overvoltage Protection. In order to prevent electric shock, the multimeter provides overvoltage protection for line-voltage mains connections meeting both of the following conditions: and COM input terminals are connected to the mains under Measurement Category II conditions, defined below. -
Page 97: Dmm Information Window
6.Use the Multimeter The bottom menu of multimeter is as below: Menu Setting Description Measuring AC current Current Measuring DC current Measuring AC voltage Voltage Measuring DC voltage Measuring resistance Testing diode Testing for continuity Measuring capacitance Hold ON OFF Freeze the display during measurement. -
Page 98: Making Multimeter Measurements
6.Use the Multimeter ------ Resistance measurement ------ Diode measurement ------ Continuity test ------ Capacitance measurement 3. Range. 4. Measurement display ("OL" is short for overload, indicates the reading exceeds the display range) 5. Data hold mode is enabled. 6. Multimeter recorder (See Multimeter Recorder "... -
Page 99: Measuring Ac Or Dc Voltage
6.Use the Multimeter multimeter. (6) Turn on the power of the measured circuit, and read the display. Turn off the power of the measured circuit and discharge all high-voltage capacitors. Remove the test leads and restore the circuit to the original condition. Measuring AC or DC Voltage (1) Push DMM button on the front panel. -
Page 100: Multimeter Features
6.Use the Multimeter (3) Insert the capacitance to the capacitance measurer, then screen shows the capacitance reading. Note: when measuring the capacitance which is less than 5 nF, please use relative value measuring mode to improve measuring precision. Multimeter Features Data Hold Mode You can freeze the display for any function. - Page 101 6.Use the Multimeter current/voltage by multimeter. Push the Utility button, select Function in the bottom menu, select DAQ in the left menu. The description of DAQ Menu is shown as the follows: Function Menu Setting Description Interval Set the record interval ( 0.5s - 10s, step by 0.5s) "d h m s"...
- Page 102 6.Use the Multimeter Record time, use the defined interval as its refresh interval Day H M S 10. When internal storage is selected: You can export the internal record file to a USB memory device. Insert the USB memory device into the front-panel USB port on your instrument.
- Page 103 6.Use the Multimeter 4. The chart will be displayed (see Figure 6-6). If you want to keep the chart, save the file to XLS format. Figure 6-4 Figure 6-3 Figure 6-5...
-
Page 104: Communication With Pc
7.Communication with PC 7. Communication with PC The oscilloscope supports communications with a PC through USB, LAN port or Wi-Fi. You can use the Oscilloscope communication software to store, analyze, display the data and remote control. To learn about how to operate the software, you can push F1 in the software to open the help document. -
Page 105: Using Lan Port
7.Communication with PC Using LAN Port Connect directly (1) Connection. Plug in the LAN cable to the LAN port in the back of the oscilloscope; plug the other end into the LAN interface of the computer. (2) Set the network parameters of the computer. Since the oscilloscope can not support obtaining an IP address automatically, you should assign a static IP address. -
Page 106: Connect Through A Router
7.Communication with PC Figure 7-3 Set the network parameters of the Oscilloscope Software (4) Set the network parameters of the oscilloscope. In the oscilloscope, push the Utility button. Select Function in the bottom menu. Select LAN Set in the left menu. In the bottom menu, set the Type item as LAN, and select Set. - Page 107 7.Communication with PC set the IP address to 192.168.1.71, Subnet mask is 255.255.255.0, Default gateway is 192.168.1.1. Figure 7-5 Set the network parameters of the computer (3) Set the network parameters of the Oscilloscope Software. Run the software on the computer;...
-
Page 108: Using Wi-Fi To Connect With Pc
7.Communication with PC (4) Set the network parameters of the oscilloscope. In the oscilloscope, push the Utility button. Select Function in the bottom menu. Select LAN Set in the left menu. In the bottom menu, set the Type item as LAN, and select Set. In the right menu, set IP and Port to the same value as the "Ports-settings"... -
Page 109: Connect With Pc As Wi-Fi Station
7.Communication with PC (6) Select Save set in the bottom menu to save current settings. (7) Set Wi-Fi connection on PC. Enter the WIFI settings on PC, select the oscilloscope access point to connect, enter the set password. (8) Set the network parameters of the Oscilloscope Software. Run the software on the computer;... - Page 110 7.Communication with PC Select LAN Set in the left menu. In the bottom menu, set the Type item as WIFI-STA, and select Set in the bottom menu. (2) In the right menu, select SSID, a keyboard will pop up. Input the name of the Wi-Fi hotspot.
- Page 111 7.Communication with PC Figure 7-9 Set the network parameters of the computer (8) Set the network parameters of the Oscilloscope Software. Run the software on the computer; choose the "Ports-settings" of the "Communications" menu item. Set "Connect using" to LAN. Set IP and Port to the same value in the oscilloscope. If you can get data normally, the connection is successful.
-
Page 112: Communication With Android Device Via Wi-Fi
8.Communication with Android Device via Wi-Fi 8. Communication with Android Device via Wi-Fi The oscilloscope supports communications with Android based smart device via Wi-Fi. You can use the free application software on the Android based smart devices to view the waveform synchronously, perform remote control, The waveform can be saved as image (BMP, PNG) or file (CSV, BIN), or shared via installed sharing apps. - Page 113 8.Communication with Android Device via Wi-Fi (6) Select Save set in the bottom menu to save current settings. (7) In Android device, enter the WIFI settings, select the oscilloscope access point to connect, enter the set password. (8) In Android device, launch the application. (9) Click connect on the left.
-
Page 114: Connect With App As Wi-Fi Station
8.Communication with Android Device via Wi-Fi Connect with APP as Wi-Fi Station (1) In the oscilloscope, push the Utility button. Select Function in the bottom menu. Select LAN Set in the left menu. In the bottom menu, set the Type item as WIFI-STA, and select Set in the bottom menu. - Page 115 8.Communication with Android Device via Wi-Fi (8) In Android device, launch the application. (9) Click connect on the left. (10) Set IP and Port to the same value as the setting in the oscilloscope. Click Confirm to connect. Click History to recall the history settings.
-
Page 116: User Interface
8.Communication with Android Device via Wi-Fi User Interface Horizontal Position Pointer Touch to enter Trigger Level (Selected) Voltage division of Touch to Show/hide Time Base & Voltage division of CH2 stop/continue to menu Horizontal (Touch to select CH2, (Colored indicates CH1 synchronize with touch again to turn CH2 (see below) - Page 117 8.Communication with Android Device via Wi-Fi Control Menu Touch to enter the control interface of the generator Control Interface of the Generator Turn on/off output Select Select of selected channel channel waveform Set the parameters of current waveform Display Menu Adjust the Set the auto The points will be...
-
Page 118: Gestures Control
8.Communication with Android Device via Wi-Fi Cursor Menu Check to Check to measure time measure voltage The cursor line can be dragged. Cursor Measurement Setting Menu APP Information Enter detail setting Gestures Control Show the vertical position when gesturing Control the Control the trigger vertical position level of the trigger... - Page 119 8.Communication with Android Device via Wi-Fi Control the horizontal position Pinch and spread vertically to change the voltage division of current channel Pinch and spread horizontally to change the time base...
-
Page 120: Demonstration
9.Demonstration 9. Demonstration Example 1: Measurement a Simple Signal The purpose of this example is to display an unknown signal in the circuit, and measure the frequency and peak-to-peak voltage of the signal. Carry out the following operation steps for the rapid display of this signal: (1) Set the probe menu attenuation coefficient as 10X and that of the switch in the probe switch as 10X (see "How to Set the Probe Attenuation Coefficient"... -
Page 121: Example 2: Gain Of A Amplifier In A Metering Circuit
9.Demonstration Figure 9-1 Measure period and frequency value for a given signal Example 2: Gain of a Amplifier in a Metering Circuit The purpose of this example is to work out the Gain of an Amplifier in a Metering Circuit. First we use Oscilloscope to measure the amplitude of input signal and output signal from the circuit, then to work out the Gain by using given formulas. -
Page 122: Example 3: Capturing A Single Signal
9.Demonstration Gain = Output Signal / Input signal Gain (db) = 20×log (gain) Figure 9-2 Waveform of Gain Measurement Example 3: Capturing a Single Signal It's quite easy to use Digital Oscilloscope to capture non-periodic signal, such as a pulse and burr etc. But the common problem is how to set up a trigger if you have no knowledge of the signal? For example, if the pulse is the logic signal of a TTL level, the trigger level should be set to 2 volts and the trigger edge be set as the rising edge trigger. -
Page 123: Example 4: Analyze The Details Of A Signal
9.Demonstration (9) Select Coupling in the bottom menu. Select DC in the right menu. (10) In the bottom menu, select Slope as (rising). (11) Turn the Trigger Level knob and adjust the trigger level to the roughly 50% of the signal to be measured. (12) Check the Trigger State Indicator on the top of the screen, if it is not Ready, push down the Run/Stop button and start acquiring, wait for trigger to happen. - Page 124 9.Demonstration (1) Push the Acquire button to display the Acquire menu. (2) Select Acqu Mode in the bottom menu. (3) Select Peak Detect in the right menu. The signal displayed on the screen containing some noise, by turning on Peak Detect function and changing time base to slow down the incoming signal, any peaks or burr would be detected by the function (see Figure 9-4).
-
Page 125: Example 5: Application Of X-Y Function
9.Demonstration Figure 9-5 Reduce Noise level by using Average function Example 5: Application of X-Y Function Examine the Phase Difference between Signals of two Channels Example: Test the phase change of the signal after it passes through a circuit network. X-Y mode is a very useful when examining the Phase shift of two related signals. -
Page 126: Example 6: Video Signal Trigger
9.Demonstration (8) With the elliptical oscillogram method adopted, observe and calculate the phase difference (see Figure 9-6). The signal must be centered and kept in the horizontal direction. Figure 9-6 Lissajous Graph Based on the expression sin (q) =A/B or C/D, thereinto, q is the phase difference angle, and the definitions of A, B, C, and D are shown as the graph above. - Page 127 9.Demonstration (3) In the left menu, select Video as the mode. (4) Select Source in the bottom menu. Select CH1 in the right menu. (5) Select Modu in the bottom menu. Select NTSC in the right menu. (6) Select Sync in the bottom menu. Select Field in the right menu. (7) Turn the Vertical Scale, Vertical Position and Horizontal Scale knobs to obtain a proper waveform display (see Figure 9-7).
-
Page 128: 10. Troubleshooting
10.Troubleshooting 10. Troubleshooting 1. Oscilloscope is powered on but no Display. Check whether the power connection is connected properly. Check whether the fuse which is beside the AC power input jack is blew (the cover can be pried open with a straight screwdriver). ... -
Page 129: 11. Technical Specifications
11.Technical Specifications 11. Technical Specifications Unless otherwise specified, the technical specifications applied are for DSO-6102 WIFI only, and Probes attenuation set as 10X. Only if the oscilloscope fulfills the following two conditions at first, these specification standards can be reached. ... - Page 130 11.Technical Specifications Performance Characteristics Instruction 2ns/div - 1000s/div, Scanning speed (S/div) step by 1 – 2 - 5 Sampling rate / relay ±1 ppm time accuracy Single: Interval(△T) accuracy ±(1 interval time+1 ppm×reading+0.6 ns); Average>16: (DC - 100MHz) ±(1 interval time +1 ppm×reading+0.4 ns) Sensitivity 1 mV/div~10 V/div ±2 V (1 mV/div –...
- Page 131 11.Technical Specifications Performance Characteristics Instruction Communication USB, USB Host (USB storage); Trig Out(P/F); LAN port port Counter Support Trigger: Performance Characteristics Instruction Internal ±5 div from the screen center Trigger level range ±2 V EXT/5 ±10 V Internal ±0.3 div Trigger level ±...
- Page 132 11.Technical Specifications Performance Characteristics Instruction Idle Time 30 ns to 10 s Edge Number 1 to 128 Logic Mode AND, OR, XNOR, XOR Input Mode H, L, X, Rising, Falling Logic Trigger Goes True, Goes False, Is True >, Output Mode Is True <, Is True = Polarity Normal, Inverted...
-
Page 133: General Technical Specifications
11.Technical Specifications ±(3%±3digit) 400Ω: ±(1%±3 digit), 4KΩ~40MΩ: ±(1%±1 digit) Resistance General Technical Specifications Display Display Type 8" Colored LCD (Liquid Crystal Display) Display Resolution 800 (Horizontal) × 600 (Vertical) Pixels Display Colors 65536 colors, TFT screen Output of the Probe Compensator Output Voltage About 5 V, with the Peak-to-Peak voltage ≥1 MΩ. -
Page 134: 12. Appendix
12.Appendix 12. Appendix Appendix A: Enclosure (The accessories subject to final delivery.) Standard Accessories: Power Cord CD Rom Quick Guide USB Cable Probe Probe Adjust Multimeter Capacitance Battery Lead Ext Module Appendix B: General Care and Cleaning General Care Do not store or leave the instrument where the liquid crystal display will be exposed to direct sunlight for long periods of time. -
Page 135: Appendix C: Battery Using Guide
12.Appendix Warning: Before power on again for operation, it is required to confirm that the instrument has already been dried completely, avoiding any electrical short circuit or bodily injury resulting form the moisture. Appendix C: Battery Using Guide Battery level indicator Figure 12-1 Battery level indicator Charging the oscilloscope There will have battery power indication show on the top of panel when oscilloscope... -
Page 136: Appendix E: Line Fuse Replacement
12.Appendix Push DMM button on the front panel. Select in the bottom menu, select R. Connect the red test lead to the terminal on the back of the oscilloscope. Touch the test prod to the 10A or mA terminal on the back of the oscilloscope to the tested. - Page 137 12.Appendix Replace the fuse with a new one, which should match with the rating; install it into the fuse box and then push the fuse box back on to the rear panel.
Need help?
Do you have a question about the DSO-6102 WIFI and is the answer not in the manual?
Questions and answers