Table of Contents
Advertisement
Quick Links
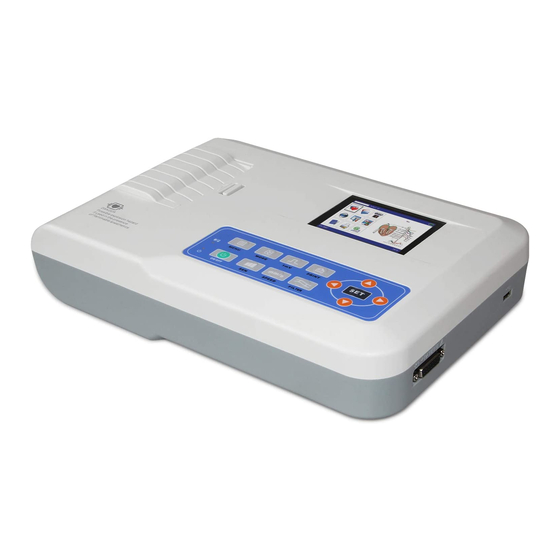
PROFESSIONAL MEDICAL PRODUCTS
300G CONTEC ECG
3 CHANNEL WITH MONITOR
ECG300G (33221)
CONTEC MEDICAL SYSTEMS CO., LTD
No. 112 Qinhuang West Street,
Economic & Technical Development Zone,
Qinhuangdao, Hebei Province,
PEOPLE'S REPUBLIC OF CHINA
Made in China
Shanghai International Holding Corp. GmbH (Europe)
Eiffestrasse 80, 20537, Hamburg, Germany
55°C
1060 hPa
-20°C
500 hPa
0123
95%
0%
Advertisement
Table of Contents
Troubleshooting

Related Manuals for CONTEC MEDICAL SYSTEMS GIMA ECG300G


Summary of Contents for CONTEC MEDICAL SYSTEMS GIMA ECG300G
- Page 1 PROFESSIONAL MEDICAL PRODUCTS 300G CONTEC ECG 3 CHANNEL WITH MONITOR 0123 ECG300G (33221) CONTEC MEDICAL SYSTEMS CO., LTD No. 112 Qinhuang West Street, Economic & Technical Development Zone, Qinhuangdao, Hebei Province, PEOPLE’S REPUBLIC OF CHINA Made in China Shanghai International Holding Corp. GmbH (Europe) 55°C...
- Page 2 Preface Please read the User Manual carefully before using this product. The operating procedures specified in this User Manual should be followed strictly.This manual describes in detail the operation steps which must be noted, the procedures which may result in abnormality, and possible damage to the product or users.
- Page 3 Ø The company performs device repair in warranty period (a year) and maintenance service after warranty period. Ø The company responds timely to the user's request. The user manual is written by Contec Medical Systems Co., Ltd. All rights reserved.
- Page 4 Statement Our company owns all rights to this unpublished work and intends to maintain it as confidential information. This user manual is used only for reference of operation, maintenance, or repair of our device. No part of this can be disseminated to others. And our company takes no responsibilities for any consequences and liabilities caused by using this user manual for other purposes.
-
Page 5: Table Of Contents
Contents Chapter1 Overview ........................1 1.1 Overview ........................1 1.2 Intended use .........................1 1.3 Main technical specifications ..................1 1.4 Main Characteristics ....................2 1.5 Software overview .......................3 Chapter2 Safety Precautions ......................4 Chapter3 Warranty ........................7 Chapter4 Working Principle and Structural Characteristics ............8 4.1 Working principle and its block diagram ..............8 4.2 Name of each part and its function ................9 Chapter 5 Operation Precautions ....................13 5.1 Precautions before use....................13... - Page 6 7.10 Analysis parameters setup ..................27 7.11 Print setup ........................28 7.12 Lead placement ......................30 7.13 About ........................30 Chapter 8 Troubleshooting......................31 8.1 Auto shutdown ......................31 8.2 AC interference......................31 8.3 EMG interference ......................31 8.4 Baseline drift ......................32 8.5 Troubleshooting list ....................32 Chapter 9 Maintenance.......................34 9.1 Battery ........................34 9.2 Recording paper ......................35 9.3 Maintenance after use....................35...
-
Page 7: Chapter1 Overview
Chapter1 Overview 1.1 Overview This product is a kind of electrocardiograph, which is able to sample 12 leads ECG signals simultaneously and print out the ECG waveform with thermal printing system. Its functions are as follows: recording and displaying ECG waveform in auto/manual mode; measuring ECG waveform parameters automatically, and automatic analysis;... -
Page 8: Main Characteristics
0.25 100Hz~150Hz, Sine wave +10 %, -30 % 150 Hz ~ 500 Hz, Sine wave +10 %, -100 % ≤1Hz,200ms, Triangle wave +0 %, -10 % relative to 10Hz relative to 200 ms 1.3.7 Time constant: ≥3.2s 1.3.8 CMRR: >105 dB 1.3.9 Filter: power frequency(AC50/60 Hz), myoelectricity(25 Hz/35 Hz (-3 dB)), baseline drift filter 1.3.10 Recording way: Thermal printing system... -
Page 9: Software Overview
1.4.2 Record clear and exact three channels ECG waveform and remarks in real-time and continuously. The remark includes: lead sign, sensitivity, paper speed, filter state, etc. 1.4.3 In auto mode, recording can be completed with one-button operation, which improves work efficiency. -
Page 10: Chapter2 Safety Precautions
Chapter2 Safety Precautions 2.1 Ensure that the device is placed on a flat level worktable. Avoid strong vibration or impact when moving it. 2.2 When working with AC power, the power cord must be 3-core, the frequency and voltage value of the AC power source must match the identification on the manual and have sufficient capacity. - Page 11 The device complies with the safety standards for medical electrical equipment or system electromagnetic compatibility in IEC60601-1-2. Electromagnetic environments exceeding the IEC60601-1-2 standard may cause harmful interference to the device or prevent the device from performing its intended function or degrade its performance. Therefore, if there is a phenomenon that does not match its function during use, be sure to confirm and eliminate adverse effects before continuing to use it.
- Page 12 sometimes not comply with the doctor’s diagnosis. Therefore, the final conclusion needs to be comprehensively analyzed by doctors in combination with analysis results, patient clinical characterization and other test results.
-
Page 13: Chapter3 Warranty
Chapter3 Warranty 3.1 In normal use, under strict observance of user manual and operation notes, in case of failure, please contact with our customer service department. Our company has the sales record and customer archives for each device. The customer has one year free warranty service from the date of shipping according to the following conditions. -
Page 14: Chapter4 Working Principle And Structural Characteristics
Chapter4 Working Principle and Structural Characteristics 4.1 Working principle and its block diagram 4.1.1 The power supply unit Principle of power supply After the AC power supply enters the switching power supply, it is converted to DC voltage and supplied to the DC-DC power unit, it also provides constant voltage current limiting charging for the rechargeable lithium battery in the device through the DC-DC circuit, and generates +5V and +8.5V voltage through the power conversion to supply power to the corresponding modules. -
Page 15: Name Of Each Part And Its Function
(2)Principle block diagram is shown in Figure 4-1. Signal acquisition Button system system Control system Display system Printing system Power module Figure 4-1 Block diagram of control unit 4.2 Name of each part and its function 4.2.1 Front view Figure 4-2 Front view 1. - Page 16 Ø Do not use sharp stuff to operate the buttons, otherwise it may case permanent damage to the buttons. 4.2.2 Side view Figure 4-3 Side view 5. Lead cable interface Connect with lead cables. 6. USB interface Communicate with the computer. The ECG data and analysis result can be transmitted to a computer, by using the computer, many functions can be achieved, such as archiving, managing, and analyzing ECG data, which facilitates clinical research, organization teaching and training, as well as program upgrade, case import and export, and connection with external printer.
- Page 17 4.2.4 Buttons Figure 4-5 Schematic diagram of buttons 1. Startup indicator It lights in green after turning on the device. 2. Power status indicator Green indicates that the AC power supply is used. At this time, there is no battery in the device or the battery is full.
- Page 18 When the device is turned on, short press this button, it will prompt whether to shut down the device, long press this button to turn off the device. 4.2.5 Symbols Alternating current Equipotentiality Caution: read instructions (warnings) carefully Defibrillation-proof type CF applied part USB interface Lead cable socket ...
-
Page 19: Chapter 5 Operation Precautions
Chapter 5 Operation Precautions 5.1 Precautions before use 5.1.1 For safe and effective use, please read the user manual carefully before operation. 5.1.2 Check to ensure that the device is in good condition. 5.1.3 The device shall be placed on a flat surface, and moves gently to avoid strong vibration or shock. -
Page 20: Chapter 6 Preparations Before Operation
Chapter 6 Preparations before Operation 6.1 Installation of recording paper 6.1.1 The device adopts high-speed recording paper, its specification is 80 mm(W)×20 m(L). 6.1.2 The installation method of recording paper is described as below: 1. As shown in Figure 6-1, open the paper cabinet cover, take out the paper axis, insert it into the roll paper as shown in the figure. -
Page 21: Power Supply Connection
6.2 Power supply connection 6.2.1 AC Insert one end of the provided three-core power cord into the device’s input socket, and insert the other end into a three-core power socket that meets the requirements. Ensure that the connection is secure and reliable, and the device is automatically grounded. When the device is used in conjunction with other medical equipment, use the supplied potential equalization wire to connect the equipotential terminal of the device to the equipotential terminal of the connected equipment to prevent leakage current and protect the device. - Page 22 The chest electrodes should be installed to the following parts: C1(Vl): the fourth intercostal space at the right sternal margin C2(V2): the fourth intercostal space at the left sternal margin C3(V3): between C2 and C4 C4(V4): the intersection between midclavicular line and the fifth intercostal space C5(V5): left anterior axillary line on the same plane as C4 C6(V6): left midaxillary line on the same plane as C4 Clean the chest skin where the electrodes to be installed with alcohol, and apply some...
- Page 23 Chest 3 Green Green Chest 4 Brown Blue Chest 5 Black Orange Chest 6 Purple Purple Note Ø It is recommended to install the lead cables after turning off the device. Ø Apply appropriate amount of conductive paste on the electrode when installing the electrode.
-
Page 24: Chapter 7 Operation Instructions And Parameter Setting
Chapter 7 Operation Instructions and Parameter Setting 7.1 Main Interface As shown in below figure: Storage memory use rate Current case amount Power status Function buttons Power status: refer to 9.1 Functional buttons: to enter the sampling interface, generally, the device will automatically enter this interface after powering on to enter the case management interface, in this interface, user can query, modify or delete case information... -
Page 25: Sampling Interface
to set the print mode, print style and print content, etc. to view the information about our company, software version. 7.2 Sampling interface Click on the main interface or press the button to enter the sampling interface. Note: There is input time of cases in the system setting, therefore, case information should be input before formal sampling. - Page 26 Rhythm 2. Gain (sensitivity): use the button to switch the gain between 5 mm/mV, 10 mm/mV and 20 mm/mV. The overall gain (sensitivity) can be checked by calibration function. Speed: use the button to switch the speed between 12.5 mm/s, 25 mm/s and 50 mm/s.
-
Page 27: Case Information Input Interface
In current interface, press to enter quick setup interface, shown as below: Click "OK" to apply new setup and return to sampling interface; while click"Cancel" not to apply and directly return to sampling interface. The optional content of each setting item and its description are shown in the following table: Item Options... -
Page 28: Case Management
After selecting a edit box, pressing button could pop up a soft keyboard shown as below. Clicking “Caps” can switch between numbers, lowercase letters, capital letters and symbols. “Space” is the space key, press it to enter a space; “Backspace” is the backspace key, press it to delete the last character entered. -
Page 29: Query
The above interface shows all medical records stored in the device. User can search necessary cases by the query function in the interface (refer to 7.5), modify or delete case information by edit function, and review stored case information (refer to 7.6). Click to jump to the first page of case list. -
Page 30: Review
Suggestion: When there are many cases, it would be better to input accurate query conditions and choose “Cond.And” to quickly find the case. 7.6 Review In the case management interface, select a case to be reviewed, click “Review” to enter the following dialog box, which displays the case information. -
Page 31: Date And Time Setup
In current interface, press to enter quick setup interface, shown as below: Click "OK" to apply new setup and return to review interface; while click"Cancel" not to apply and directly return to review interface. The optional content of each setting item and its description are shown in the following table: Item Options... -
Page 32: System Setup
In current interface, user can switch the items via buttons, and adjust the content of the item by buttons. 7.8 System setup In the main interface, click to enter the system setup interface, as shown below: After clicking “Default”, the system will restore all settings to default. The optional content of each setting item and its description are shown in the following table: Item Options... -
Page 33: Sampling Setup
If it is selected, the system will run in Demo Demo Mode on/off mode; otherwise, the system will run in sampling mode. 7.9 Sampling setup In the main interface, click to enter the sampling setup interface, as shown below: After clicking “Default”, the system will restore all settings to default. The optional content of each setting item and its description are shown in the following table: Item... -
Page 34: Print Setup
After clicking “Default”, the system will restore all settings to default. The optional content of each setting item and its description are shown in the following table: Item Description Rhythm Lead Set the rhythm lead that used for printing under rhythm mode Heartbeat Sound To turn on or off the heartbeat sound The system will use the input value as a standard of judging premature... - Page 35 Type Item Options Description [Auto 4×3]/[Auto 3×4+1]/[Auto 3×4]/[Auto 2×6+1]/[Auto Print The system takes the selected option 2×6]/[Auto 3-2+1]/[Auto Mode as default print mode. 3-2][Rhythm 4]/[Rhythm 3][/Rhythm 2]/[Manual] The option selected will be used as printing gain mode. "Smart" means Lead the system will adjust gain [Smart]/[Current] Gain...
-
Page 36: Lead Placement
Note 2: If print time length is less than 8s, the sampling and analysis time will be 8s; if the print time length is equal to or greater than 8s, the sampling and analysis time keeps the same with print time. 7.12 Lead placement In the main interface, click to view the schematic diagram of lead placement, the... -
Page 37: Chapter 8 Troubleshooting
Chapter 8 Troubleshooting 8.1 Auto shutdown Ø The battery is almost running out, which causes overdischarge protection circuit action. Ø The voltage of AC power supply is too high, which causes overvoltage protection circuit action. 8.2 AC interference Ø Whether the device is grounded reliably? Ø... -
Page 38: Baseline Drift
EMG filter. The ECG waveform recorded at this time will be slightly attenuated. 8.4 Baseline drift Ø Whether the electrode installation is stable? Ø Whether the connection of lead cables or electrodes is reliable? Ø Whether the electrodes and patient skin are cleaned and are daubed with enough conductive paste? Ø... - Page 39 5. Bad connection between electrodes and lead cables. 1. Low power. 1. Charge the battery. Baseline draft 2. Patient movement. 2. Keep patient still. 1. Low battery. 1. Charge the battery. 2. The printer head surface is 2. Cut off the power, clean the dirty.
-
Page 40: Chapter 9 Maintenance
Chapter 9 Maintenance 9.1 Battery 9.1.1 The device is designed with built-in full-sealed and maintenance-free rechargeable lithium battery, also equipped with perfect auto-charging-discharging monitor system. When the device is connected to AC power supply, the battery will be charged automatically. Battery status will be displayed on right edge of LCD screen in powering on state, as shown in Table 9-1. -
Page 41: Recording Paper
otherwise there is a danger of fire. Do not use the battery near fire sources or in environments where the temperature exceeds 60°C. Do not heat the battery or throw it into fire, water and avoid splashed by water. Do not puncture, hammer or strike the battery or destroy it by other ways, otherwise it will cause battery overheat, smoke, deform or burn dangers. -
Page 42: Lead Cables And Electrodes
9.4 Lead cables and electrodes 9.4.1 The connectivity of the lead cable can be detected by the multimeter. Check whether each wire of the lead cable is in good contact according to the following table. The resistance of each wire from the electrode plug to the corresponding pin in the lead cable plug should be less than 10Ω. -
Page 43: Others
9.8 Others 9.8.1 Do not open the device enclosure to avoid electric shock danger. 9.8.2 The device associated circuit schematics and critical parts list are only available to authorized service station or maintenance personnel, who is responsible for maintenance of the device. -
Page 44: Chapter 10 Packing List And Accessories
Chapter 10 Packing List and Accessories 10.1 Accompanying accessories When the device is shipped from the factory, the intact packaging should contain the following contents, as shown in Table 10-1: Table 10-1 Packing list and accessories Name Quantity Electrocardiograph 1 pc Chest electrodes (suction cup/electrode slice) 1 set (6 pcs) Limb electrodes (limb clip) -
Page 45: Appendix I Ecg Automated Measurement&Interpretation Guide
Appendix I ECG Automated Measurement&Interpretation Guide 1. Preface The appendix describes the functions of ECG automated measurement and automated interpretation. It explains the specific implementation method, algorithm and formulas related to these two functions, as well as the content output by the automated measurement and automated interpretation. - Page 46 Left axis deviation Right axis deviation Completeness Right Bundle branch block Completeness Left Bundle branch block No Completeness Right Bundle branch block No Completeness Left Bundle branch block V1 shows RSR' type Left anterior fascicular block Left posterior fascicular block Left ventricular hypertrophy Right ventricular hypertrophy I atrioventricular block...
- Page 47 ST depression, mild anterior myocardial ischemia ST depression, mild extensive anterior myocardial ischemia ST depression, mild apical myocardial ischemia ST depression, mild anterolateral myocardial ischemia ST depression, mild high lateral myocardial ischemia ST depression, mild inferior myocardial ischemia ST depression, mild inferolateral myocardial ischemia ST depression, anteroseptal myocardial ischemia ST depression, anterior myocardial ischemia ST depression, extensive anterior myocardial ischemia...
- Page 48 The workflow is shown as below: Start ECG waveform sampling Recognize all R points by slope method Waveform superposition taking R point as center Determine the positions of each wave Calculate the amplitudes of each wave Get measurement parameter, interpretation item 3.1 Find the cardiac impulse location 1) Data preprocessing, obtain the absolute value trend of slope for each lead;...
- Page 49 point and end point in the ecg original data, mark the point as cardiac impulse location. 5) Dynamically threshold adjustment: after found the cardiac impulse location, use the value at the cardiac impulse location for the dynamically adaptive adjustment of the threshold value.
- Page 50 4) If the found P-wave is narrow, research the P-wave according to the following steps. 5) Change the searching range of 30ms-100ms to 100ms-350ms in step 1, repeat step 1-4. 6) If the found P-wave is still narrow, it means that P-wave doesn’t exist. 4.
- Page 51 baseline from the start point of Q wave to the end point of S wave. Each adjacent two boundary points forms a sub-wave. Determine whether each sub-wave is a recognizable minimum wave (see the definition below). If it is a recognizable minimum wave, first identify its direction. If it is above the QRS baseline, it is R wave, if it is below the baseline, it is Q wave or S wave.
- Page 52 ④ ③ P-duration - Ps ⑤ QRS-duration - Qs ‚ ⑦ ⑥ T-duration - Ts ⑦ - Qs ‚ Electric axis formula: ´ ´ ´ arctan(2.0 ⑧ P electric axis: : voltage sum from the beginning point to the end point of P-wave on lead III : voltage sum from the beginning point to the end P/QRS/T electric...
- Page 53 ③ Ps: beginning of the P-wave ④ Pe: end of the P-wave ⑤ Se: end of the S-wave ⑥ Ts: beginning of the T-wave ⑦ Te: end of the T-wave ⑧ PI: 3.1415926 3.5 Interpretations judgment based on parameters Item Rule of interpretation No any abnormal are detected No abnormal...
- Page 54 Q-wave duration<20ms, lead II, III and aVF are rS type. QRS-duration<110ms, QRS-axis >90 degree, lead I and lead aVL are rS type, lead Left posterior fascicular block II, III and aVF are qR type, and Q-wave of lead II and III <20ms. R amplitude of lead I >1.5mV, R amplitude of lead V5 >2.5mV, R amplitude of lead aVL >1.2mV, R amplitude of lead...
- Page 55 V4, V5, no change of leads V1, V2, V3. Acute myocardial infarction change of leads Acute apical MI V4, V5, no change of leads V1, V2, V3. Old myocardial infarction change of leads Old apical MI V4, V5, no change of leads V1, V2, V3. Early myocardial infarction change of leads I, Early anterolateral MI aVL, V4, V5, V6...
- Page 56 V3, V4, V5. anterior myocardial ischemia Mild ST-segment depression of leads V4, V5, ST depression, mild apical and no change of leads V1, V2, V3. myocardial ischemia Mild ST-segment depression of leads I, aVL, ST depression, mild anterolateral V4, V5, V6. myocardial ischemia Mild ST-segment depression of leads I, aVL, ST depression, mild high lateral...
- Page 57 For leads I, II, III, avR, avL, avF, V4, V5, V6, the voltage of ST segment at 60ms point >0.1mV, and for leads V1, V2, V3, the voltage at 60ms point >0.3mV. ST slope elevation: Voltage of ST segment at 20ms point>=voltage of J point, voltage at 40ms point >= the one at 20ms, voltage at 60ms point >= the one at 40ms, with change of ST elevation.
- Page 58 12-lead measurement database contains 250 groups of interference data; Diagnostic database contains 1220 cases of short-term ECG recording. The primary development purpose of using 12-lead or 15-lead is to evaluate the performance of the automatic ECG analyzer. In addition to the normal data, the database also includes clinically confirmed ECGs of variety cases, such as left ventricular hypertrophy, right ventricular hypertrophy, every part of myocardial infarction and ventricular hypertrophy accompanying myocardial infarction.
- Page 59 catheterization and ultrasonic examination, and the result that judged as normal in physical examination. 2) Atrium hypertrophy Determined by the diagnostic results of ultrasonic examination. 3) Myocardial infarction and myocardial ischemia Determined by the physician diagnostic results of cardiac catheterization. 4) Tachycardia, bradycardia, low voltage, axis Determined by the diagnostic results of ultrasonic examination.
- Page 60 Note: The heart abnormalities such as posterior myocardial ischemia, early posterior MI and old posterior MI are not included in the database. These abnormalities and other heart disorders not contained in above sheet won’t be regarded as the judgment object for the verification of automated interpretation accuracy.
- Page 61 shall be used for the following verification of automated measurement parameters, and the case of D_0001~D_1220 shall be used for the following verification of automated interpretation. 4.6.3 Customized data preprocessing The customized initial case files shall be processed for voltage conversion and frequency conversion for resampling as the applicable format in the system.
- Page 62 5.1.2 Verification and Process for CSE measurement database Import the converted case files into the device, add appropriate database records, then waveform for all case files can be reviewed in the device, therefore the automated measurement parameters can be obtained. Eliminate the cases existing obvious error for the diagnostic parameters (P-wave location is wrong) from the CSE database.
- Page 63 Start Read expert diagnostic marks Eliminate obvious unfit cases Read initial case of DCD file Frequency conversion Voltage conversion Get ECG data file Automated measurement parameters Compare automated measurement parameter and expert diagnostic mark Conclude mean value of comparison Eliminate the four largest deviations from the mean Recalculate the mean value and variation of comparison result Summarize the comparison results...
- Page 64 5.1.3 Verification results 5.1.3.1 Accuracy of amplitude measurements Calibration and analytical ECGs shall be used to measure the amplitude value, the summary as follows: Amplitude Mean difference (uV) Standard deviation (uV) P-wave -1.70 5.72 Q-wave 7.51 18.07 R-wave -18.05 21.70 S-wave 7.77 18.58...
- Page 65 The biological ECGs are fed into the device in form of digital signals, then the measurement value can be obtained by calculation. Test condition: a) without NOISE b)with 25uV high frequency c) with 50uV peak to valley 50Hz/60Hz sinusoidal line frequency NOISE d) with 1mV peak to valley 0.3Hz sinusoidal base-line NOISE For each NOISE level above, the differences of measurements between the NOISE-free ECGs and the ECGs with NOISE shall be determined.
- Page 66 5.2.1.2 Customized database Start Initial case data ecg format as system required Import to device Expert diagnosis Draw ECG waveform Identify QRS-complex QRS-complex superposition Auto measurement parameter Conclude automated interpretation items Start comparing Summarize the global statistical results of comparison for each case...
- Page 67 5.2.2 Verification results Positive ECGs Sensitivit Specific Item predictive number ity % value % No abnormal 92.01 79.16 97.38 Sinus mode Bradycardia 96.68 99.73 98.64 Sinus mode Tachycardia 97.44 96.49 96.90 Left atrium Hypertrophy 51.09 99.89 81.82 Right atrium Hypertrophy 42.64 99.66 50.00...
- Page 68 Old extensive anterior MI 90.91 88.05 37.04 Early apical MI 88.32 87.21 88.54 Acute apical MI 78.12 78.66 53.85 Old apical MI 79.63 89.94 80.00 Early anterolateral MI 77.51 79.94 83.33 Possible acute anterolateral MI 28.57 99.77 33.33 Old anterolateral MI 70.00 93.60 50.00...
- Page 69 ST depression, extensive anterior 84.78 98.04 67.75 myocardial ischemia ST depression, apical myocardial 79.95 99.14 55.12 ischemia ST depression, anterolateral 87.42 98.97 59.09 myocardial ischemia ST depression, high lateral 90.06 99.31 57.14 myocardial ischemia ST depression, inferior myocardial 89.88 99.13 40.08 ischemia ST depression, inferolateral...
-
Page 70: Appendix Ii Emc Guidance And Manufacturer Declaration
Appendix II EMC Guidance and Manufacturer Declaration Table 1: Guidance and manufacturer’s declaration –electromagnetic emission The Infrared Thermometer is intended for use in the electromagnetic environment specified below. The purchaser or the user of the device should assure that it is used in such environment. - Page 71 Table 3: Guidance and manufacturer’s declaration – electromagnetic immunity The Infrared Thermometer is intended for use in the electromagnetic environment specified below. The customer the user of the Infrared Thermometer should assure that it is used in such environment. Immunity test IEC 60601 test level Compliance level Conducted RF...
- Page 72 217 Hz wireless communic 800/900, ations TETRA equipment 800, Pulse – iDEN 820, modulation b) CDMA 18 Hz 850, LTE Band 1720 1800; 1845 CDMA 1900; Pulse 1 700 – 1900; modulation b) 1 990 DECT; 217 Hz 1970 LTE Band 1, 3, UMTS Bluetooth,...
- Page 73 The MANUFACTURER should consider reducing the minimum separation distance, based on RISK MANAGEMENT, and using higher IMMUNITY TEST LEVELS that are appropriate for the reduced minimum separation distance. Minimum separation distances for higher IMMUNITY TEST LEVELS shall be calculated using the following equation: Where P is the maximum power in W, d is the minimum separation distance in m, and E is the IMMUNITY TEST LEVEL in V/m.
Need help?
Do you have a question about the GIMA ECG300G and is the answer not in the manual?
Questions and answers