Table of Contents
Advertisement
Quick Links
Advertisement
Table of Contents

Related Manuals for Vitrek Xitron 2801


Summary of Contents for Vitrek Xitron 2801
- Page 1 USER GUIDE 2801/2802 Advanced Single and Dual-Channel Power Analyzers...
- Page 2 2801/2802 Power Analyzer User Guide...
- Page 3 Warranty The Vitrek instrument is warranted against defects in material and workmanship for a period of two years after the date of purchase. Vitrek agrees to repair or replace any assembly or component (except batteries) found to be defective, under normal use, during the warranty period. Vitrek’s obligation under this warranty is limited solely to repairing any such instrument, which in Vitrek’s...
- Page 4 All rights reserved. No part of this publication may be reproduced, transmitted, transcribed, stored in a retrieval system, or translated into any language in any form without prior written consent from Vitrek. This product manual is copyrighted and contains proprietary information, which is subject to change without notice.
-
Page 5: Table Of Contents
Contents Contents INTRODUCTION ____________________________________________________ 15 Scope _________________________________________________________ 15 Features _______________________________________________________ 16 FUNCTIONAL DESCRIPTION _________________________________________ 17 Theory of Operation ______________________________________________ 17 Analog Channel Board ________________________________________ 18 Interfaces ______________________________________________________ 23 Front Panel _________________________________________________ 23 IEEE488 ___________________________________________________ 23 USB Device_________________________________________________ 23 USB Host __________________________________________________ 24 RS-232 ____________________________________________________ 24 Digital I/O __________________________________________________ 24 Ethernet____________________________________________________ 24... - Page 6 2801/2802 Power Analyzer User Guide 2802 Rear Panel Connections ______________________________________ 39 Measurements of a Power Source: Connection Method 1 _____________ 39 Measurements of a Power Source: Connection Method 1 _____________ 40 Measurements of a Power Source: Connection Method 2 _____________ 41 Measurements of a Load: Connection Method 1 ____________________ 42 Measurements of a Load: Connection Method 2 ____________________ 43 Measurements of a Power Source and Load: Method 1, Two Ind.
- Page 7 Introduction PRINTING RESULTS ________________________________________________ 99 Sample Printouts ________________________________________________ 99 SENDING COMMANDS AND INTERROGATIVES ________________________ 108 Operating using Multiple Interfaces _________________________________ 108 Interrogatives __________________________________________________ 108 USB______________________________________________________ 109 RS232 ____________________________________________________ 109 IEEE488 __________________________________________________ 109 Remote / Local Operation ________________________________________ 109 Resetting the Instrument _________________________________________ 110 Initializing an Interface ___________________________________________ 110 Identifying the Instrument _________________________________________ 110 Querying the Date or Time________________________________________ 110...
- Page 8 2801/2802 Power Analyzer User Guide DCDNRANGEDLY – User Set Minimum Downrange Delay __________ 120 VRANGE – Select a Voltage Input Range ________________________ 120 AINPUT – Select the Current Input Mode_________________________ 120 ARANGE – Select a Current Input Range (Shunt Input Only) _________ 121 TRANGE –...
- Page 9 Introduction Altitude Equivalent __________________________________________ 146 Warm Up __________________________________________________ 146 Accuracy __________________________________________________ 146 APPENDIX B - MEASUREMENT SPECIFICATIONS_______________________ 148 Autorange _________________________________________________ 148 Ranging___________________________________________________ 148 Input Filtering ______________________________________________ 148 Low Frequencies____________________________________________ 148 Measurement Rate Frequency _________________________________ 148 Non-Harmonics _____________________________________________ 149 Harmonics _________________________________________________ 149 DC Input Offset Compensation _________________________________ 149 Frequency Measurements ____________________________________ 149 Harmonic Analysis __________________________________________ 149...
- Page 10 2801/2802 Power Analyzer User Guide...
- Page 11 Introduction Figures Figure 1. Overall Block Diagram ____________________________________ 17 Figure 2. Voltage Input Attenuator Block Diagram_______________________ 19 Figure 3. Transducer Input Attenuator Block Diagram____________________ 20 Figure 4. Current and Line Switch Block Diagram _______________________ 21 Figure 5. Benchtop Version of 2801 Power Analyzer ____________________ 25 Figure 6.
- Page 12 2801/2802 Power Analyzer User Guide Figure 26. Main Menu Screen ______________________________________ 51 Figure 27. Measurement Configuration Screen _________________________ 56 Figure 28. Measurement Configuration Screen _________________________ 56 Figure 29. Wiring Adjustments Menu Screen___________________________ 63 Figure 30. System Menu Screen ____________________________________ 72 Figure 31.
- Page 13 Introduction Figure 60. Startup, Partial, Extents __________________________________ 95 Figure 61. Startup in Zoom Mode ___________________________________ 96 Figure 62. Range Change _________________________________________ 97 Figure 63. Amps Inrush in Normal Mode ______________________________ 98 Figure 64. Inrush in Zoom Mode ____________________________________ 98 Figure 65. Inrush in Zoom Mode, Additional Zoom Level _________________ 98 Figure 66.
- Page 14 2801/2802 Power Analyzer User Guide Figure 93 VAR vs. Frequency _____________________________________ 180 Figure 94. Watts vs. Frequency ____________________________________ 181 Figure 95. Power Factor vs. Frequency ______________________________ 182...
-
Page 15: Introduction
Introduction Introduction The purpose of this user guide is to describe the use and capabilities of the 2801/2802 Advanced Single and Dual-Channel Power Analyzers. Scope The 2801/2802 Advanced Single and Dual-Channel Power Analyzers incorporate the ideal combination of precision, speed and ease-of-use in instruments so economical they can be on every bench. -
Page 16: Features
2801/2802 Power Analyzer User Guide Features The 2801/2802 Power Analyzer’s features include the following— • Highest Performance-to-Cost ratio in the industry • Up to 2000V peak and 150A peak measurable internally (also external CT capable) • Base accuracy <0.08%. Current and voltage accuracies specified to less than 1mArms and 1Vrms respectively (<0.2%) •... -
Page 17: Functional Description
Functional Description Functional Description This chapter describes the circuitry and interfaces of the 2801/2802 Power Analyzer. Theory of Operation OVERALL BLOCK DIAGRAM Figure 1. Overall Block Diagram... -
Page 18: Analog Channel Board
2801/2802 Power Analyzer User Guide Analog Channel Board The 2801 is built with one and the 2802 is built with two Analog Channel Boards fitted. The block diagrams of this circuitry are shown below. Voltage Input Attenuator Notes The primary voltage-reducing element formed by the 1 Mohm portion of the attenuator is comprised of several lesser value resistors in series: a) To assure the input remains safe when a single resistor fails to a short circuit;... -
Page 19: Figure 2. Voltage Input Attenuator Block Diagram
Functional Description Voltage Input Attenuator Figure 2. Voltage Input Attenuator Block Diagram... -
Page 20: Figure 3. Transducer Input Attenuator Block Diagram
2801/2802 Power Analyzer User Guide Transducer Input Attenuator Figure 3. Transducer Input Attenuator Block Diagram... -
Page 21: Figure 4. Current And Line Switch Block Diagram
Functional Description Current and Line Switch Figure 4. Current and Line Switch Block Diagram Line Switch Notes The TRIAC and relay are controlled directly by the Channel MCU as commanded by the DSP. The timing of the turn on sequence when operating with AC voltages is accomplished by the MCU delaying turning on the TRIAC (after being commanded to do so by the DSP) by an amount commanded by the DSP from the active edge of the “squared”... - Page 22 2801/2802 Power Analyzer User Guide Other than the delay noted above, the turn on sequence in either AC or DC voltage modes is the same and is timed by the Channel MCU. Nominally 50ms after the TRIAC is turned on, the parallel relay is engaged, and then nominally 20ms after that the TRIAC has its control signal removed.
-
Page 23: Interfaces
Functional Description Isolation (all inputs except the Transducer input) The digital signals are all passed through digital isolation barriers. This provides the required isolation between the measurement circuitry and the chassis ground of the product. A further area of isolation, not specifically shown on the block diagrams is that of power to the analog circuitry in each input. -
Page 24: Usb Host
2801/2802 Power Analyzer User Guide Driver provided with instrument is for PC compatible computers running Windows 2000 or later USB Host USB 2.0 compliant, low or full-speed (as selected by the device). Compatible with all printers supporting either the PCL3 (or higher) language or supporting unformatted text transfers. -
Page 25: Using The Power Analyzer
Using the Power Analyzer Using the Power Analyzer The purpose of this chapter is to describe how to set up and use the 2802. This chapter covers— • Setting up the analyzer • Using the front panel interface • Rear panel connections •... -
Page 26: Using The Front Panel Interface
Rotate the handle until it clicks into place. WARNING: IF THE POWER ANALYZER IS USED IN A MANNER NOT SPECIFIED BY VITREK, THE PROTECTION PROVIDED BY THE EQUIPMENT MAY BE IMPAIRED. Using the Front Panel Interface Use the 2801/2802 front panel interface to select and setup the desired tests and to read the test results. -
Page 27: Figure 7. 2801 Front Panel Interface Detail
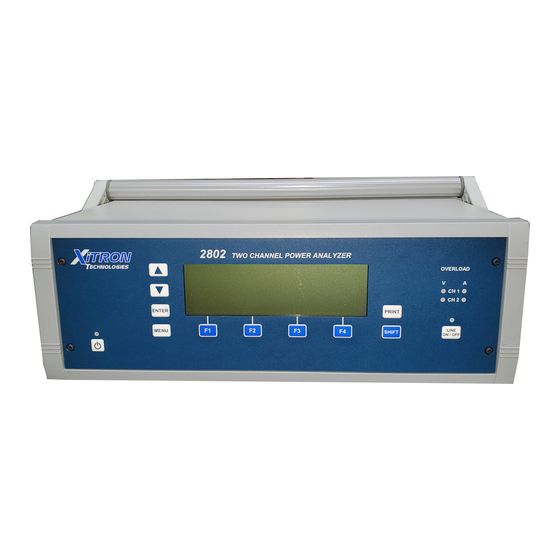
Using the Power Analyzer Figure 7. 2801 Front Panel Interface Detail Figure 8. 2802 Front Panel Interface Detail The highlighted menu item will be initiated by pressing the ENTER key. Figure 9. Sample Display... - Page 28 2801/2802 Power Analyzer User Guide The display is used to view and select the various menu options and to review the power measurement results numerically and graphically, as shown in the section on Viewing Results. The display contains helpful navigational symbols, such as, the softkey labels; and on the right there may be an arrow pointing either up or down, if additional line items are available.
-
Page 29: Grounding Of The Analyzer
Using the Power Analyzer The LEDs designated OVERLOAD V and A indicate the OVERLOAD selected current/voltage threshold has been exceeded, such as, an input signal is greater than the selected range value, above strict ranging or the selected maximum range. Note CH 1 that when either of these LEDs remains lighted, changes to CH 2... - Page 30 2801/2802 Power Analyzer User Guide for all interface signals within the interface connectors except for the Ethernet connections (which are transformer isolated according to the applicable Ethernet standards). This area is electrically connected to the negative side of the DC power input via an RF pi filter network having a low DC resistance. Notes on Grounding: Between the two ground areas there is a 50ohm (1%) power resistor in parallel with a 1000pF/50V ceramic capacitor for RF filtering.
-
Page 31: Rear Panel Connections - 2801 And 2802
PRODUCT, WHICH IS NOT ISOLATED FROM THE MAINS SUPPLY. When used with the external power supply provided with the product by Vitrek, the ground is supplied via the negative DC power input. If the product is powered by any other equivalent grounded output DC power supply, then the ground is supplied via that power supply. -
Page 32: 2801 Rear Panel Connections
TERMINAL IS CONNECTED TO EARTH GROUND WHEN THE SIGNALS BEING MEASURED ARE REFERENCED TO EARTH GROUND. CAUTION: THE USE OF THE T5 CHARGER FROM VITREK OR A VITREK RECOMMENDED REPLACEMENT MUST BE USED TO ENSURE THAT THE UNIT GROUND IS NOT COMPROMISED. -
Page 33: Figure 10. Rear Connection Panel
Using the Power Analyzer Power Line Connection T- Connector Optional Current Input Ground Terminal Line In Voltage Input Figure 10. Rear Connection Panel... -
Page 34: Single-Channel Measurements Of A Power Source: Connection Method 1
2801/2802 Power Analyzer User Guide Single-Channel Measurements of a Power Source: Connection Method 1 Optional Line Switch Wiring Loss ohms Source Load Wiring Loss ohms Figure 11. Measuring a Power Source, Method 1 Configure the channel as follows - • This connection method is suitable for most applications. -
Page 35: Single-Channel Measurements Of A Power Source: Connection Method 2
Using the Power Analyzer Single-Channel Measurements of a Power Source: Connection Method 2 Wiring Loss ohms Source Load Wiring Loss ohms Figure 12. Measuring a Power Source, Method 2 Configure the channel as follows - • Method 2 may provide improved results for applications with very low voltage and very high current, when using the internal shunt. -
Page 36: Single-Channel Measurements Of A Load: Connection Method 1
2801/2802 Power Analyzer User Guide Single-Channel Measurements of a Load: Connection Method 1 Optional Line Switch Wiring Loss ohms Source Load Wiring Loss ohms Figure 13. Measuring a Load, Method 1 Configure the channel as follows - • This connection method is suitable for most applications. •... -
Page 37: Single-Channel Measurements Of A Load: Connection Method 2
Using the Power Analyzer Single-Channel Measurements of a Load: Connection Method 2 Wiring Loss ohms Source Load Wiring Loss ohms Figure 14. Measuring a Load, Method 2 Configure the channel as follows - • Method 2 may provide improved results for applications with very low voltage and very high current, when using the internal shunt. -
Page 38: Measurements Of A Power Source:connection Method 1 - Ext Ct
2801/2802 Power Analyzer User Guide Measurements of a Power Source:Connection Method 1 – Ext CT Optional Wiring Loss ohms Source Load A or T Wiring Loss ohms Figure 15. Measuring a Source Using a CT, Method 1 Configure the channel as follows – •... -
Page 39: 2802 Rear Panel Connections
TERMINAL IS CONNECTED TO EARTH GROUND WHEN THE SIGNALS BEING MEASURED ARE REFERENCED TO EARTH GROUND. CAUTION: THE USE OF THE T5 CHARGER FROM VITREK OR A VITREK RECOMMENDED REPLACEMENT MUST BE USED TO ENSURE THAT THE UNIT GROUND IS NOT COMPROMISED. -
Page 40: Measurements Of A Power Source: Connection Method 1
2801/2802 Power Analyzer User Guide Measurements of a Power Source: Connection Method 1 Optional Line Switch Wiring Loss ohms Source Load Wiring Loss ohms Figure 17. Measuring a Power Source, Method 1 Configure the channel as follows - • This connection method is suitable for most applications. •... -
Page 41: Measurements Of A Power Source: Connection Method 2
Using the Power Analyzer Measurements of a Power Source: Connection Method 2 Wiring Loss ohms Source Load Wiring Loss ohms Figure 18. Measuring a Power Source, Method 2 Configure the channel as follows - • Method 2 may provide improved results for applications with very low voltage and very high current, when using the internal shunt. -
Page 42: Measurements Of A Load: Connection Method 1
2801/2802 Power Analyzer User Guide Measurements of a Load: Connection Method 1 Optional Line Switch Wiring Loss ohms Source Load Wiring Loss ohms Figure 19. Measuring a Load, Method 1 Configure the channel as follows - • This connection method is suitable for most applications. •... -
Page 43: Measurements Of A Load: Connection Method 2
Using the Power Analyzer Measurements of a Load: Connection Method 2 Wiring Loss ohms Source Load Wiring Loss ohms Figure 20. Measuring a Load, Method 2 Configure the channel as follows - • Method 2 may provide improved results for applications with very low voltage and very high current, when using the internal shunt. -
Page 44: Measurements Of A Power Source And Load: Method 1, Two Ind. Chnls
2801/2802 Power Analyzer User Guide Measurements of a Power Source and Load: Method 1, Two Ind. Chnls Wiring Loss W 1 ohms Source Load Channel 2 (Load Connection) Wiring Loss W 2 ohms Optional Line Switch Wiring Loss W 1 ohms Source Load Channel 1... -
Page 45: Measurement: 3P-3W 2 Meter Connection, Method 1
Using the Power Analyzer • Optionally, set Wiring Impedance to (W1 + W2) ohms. Include all wiring resistances between the source and the points at which the voltage is measured in the entered value for wiring impedance. • Set V Burden Compensation to YES. •... - Page 46 2801/2802 Power Analyzer User Guide The above diagram is applicable when there are 3 wires connecting to the Load. For ease, we have used X, Y and Z instead of A, B and C. The phase rotation of the Channels must be opposite of each other and the current measurement is made in the line phase connected to the corresponding voltage HI terminal.
-
Page 47: Measurements Of A Power Source: Connection Method 1 - Ext Ct
Using the Power Analyzer Measurements of a Power Source: Connection Method 1 – Ext CT Optional Wiring Loss ohms Source Load A or T Wiring Loss ohms Figure 23. Measuring a Source Using a CT, Method 1 Configure the channel as follows – •... -
Page 48: Using An External Current Transducer
2801/2802 Power Analyzer User Guide Using an External Current Transducer When using the external current transducer, access the MAIN MENU by pressing the MENU key. The analyzer can be configured for two types of transducers, the Current-to-Current or the Current-to-Voltage type. The Current-to-Current type will be connected to the current input receptacles on the rear panel. - Page 49 Using the Power Analyzer depending on the type of current transducer being used. Use the ARROW keys to highlight the choice and press ENTER to select Internal Shunt (A terminals) External CT (Current Out, A Terminals) External CT (Voltage Out, T Connector) The ENTER CURRENT RATIO 1 will now be displayed.
-
Page 50: Starting The Analyzer
The use of flexible coaxial cable is recommended for the current transducer output wiring. Starting the Analyzer The following startup display will show for a few seconds and then return to the measurement display last used. Xitron 2801 SERIAL NUM BER: MAIN v2.12/v1.01 ANALOG v2.11/v1.02/v1.02... -
Page 51: Configuring The Power Analyzer 2801/2802
Using the Power Analyzer Configuring the Power Analyzer 2801/2802 The MAIN MENU screen gains access to the areas for setting up the instrument. You will find the menus for the following routines – 2801 GETTING STARTED SETUP MEASUREMENTS SETUP SYSTEM CONFIGURATION STORAGE PERFORM DC ZERO DIAGNOSTICS... -
Page 52: Getting Started
2801/2802 Power Analyzer User Guide Important Note: We recommend the GETTING STARTED setup described below when setting up the 2801/2802 Power Analyzer for the first-time. Getting Started The first item listed is GETTING STARTED. This is a listing of the preset applications and predefined measurement settings that can be selected to configure the 2801/2802. -
Page 53: Channel Configuration (2802 Only)
Using the Power Analyzer 2802 APPLICATIONS 3Φ3w 2Φ3w 1Φ3w DC:DC DC:LINE DC:HF LINE:DC LINE:LINE (SYNC) LINE:LINE (ASYNC) LINE:HF DUAL:LINE (ASYNC) DUAL HF (ASYNC) 2. Press the up or down arrow key to highlight the application that best fits your intended use, press the ENTER key to select your choice Channel Configuration (2802 Only) The second item listed is CHANNEL CONFIGURATION, this is used to set how the channels will be used within the application. -
Page 54: Configuring The Analyzer Measurement Results
2801/2802 Power Analyzer User Guide CHANNEL CONFIGURATION 3Φ3w 2Φ3w 1Φ3w IN:OUT (ASYNC) IN:OUT (SYNC) INDEP CHANNELS 2. Press the up or down arrow key to highlight the application that fits your intended use, press the ENTER key to select your choice Configuring the Analyzer Measurement Results This section gives a brief description of the menu selections from which to define the desired measurements. - Page 55 Using the Power Analyzer If the application is setup for DC:LINE, DC:HF, LINE:DC then the menu choice is SETUP INPUT MEASUREMENTS SETUP OUTPUT MEASUREMENTS If the application is setup for LINE:LINE (sync) then the menu choice is SETUP OVERALL MEASUREMENTS SETUP INPUT MEASUREMENTS SETUP OUTPUT MEASUREMENTS If the application is setup for LINE:LINE (async), LINE:HF then the menu...
-
Page 56: Setting Up The Measurement Configuration
2801/2802 Power Analyzer User Guide Figure 27. Measurement Configuration Screen To Select SETUP MEASUREMENTS 2802: 3. Press the MENU key to bring up the MAIN MENU. The third selection is SETUP Ch1 MEASUREMENTS… from which Channel One’s measurement settings are accessible. 4. - Page 57 Using the Power Analyzer RESULTS AVERAGING: MEASUREMENT TYPE: RANGING AND SCALING … WIRING ADJUSTMENTS … LINE SWITCH & INRUSH DETECTION … WAVEFORM CAPTURE … RESULTS AVERAGING All displayed measurements can be averaged using a two-pole filter having a user-selected time constant. This setting only affects the displayed measurement results, it does not affect any charted measurement results.
- Page 58 2801/2802 Power Analyzer User Guide HIGH FREQ (>40Hz) Configures the analyzer to make the optimal signal measurements at frequencies higher than line frequency, in the range 40Hz to above 100kHz. The analyzer – 1) Synchronizes on the voltage waveform with frequencies in the range of 40Hz to above 100kHz;...
- Page 59 Using the Power Analyzer cycle of the entered base ripple frequency. All harmonic data is measured over the longer of 5ms (rounded upwards to the nearest integer number of cycles) or four cycles of the entered base ripple frequency. Frequency is not measured.
- Page 60 2801/2802 Power Analyzer User Guide 2) Tracks the input signals using a fixed low-pass filter where the filter corner frequency is set to maintain better than 5% accuracy at 10kHz. Note: When you enable autoranging and a downrange is required, the analyzer downranges at the rate of 10s per range.
- Page 61 Using the Power Analyzer signal content of the applied voltage signal. To measure the fundamental in the applied voltage signal, enter both a maximum fundamental frequency and a trigger level. FROM CURRENT This is similar to the FROM VOLTAGE selection, however, uses the selected current input signal as the source of fundamental frequency measurements.
- Page 62 2801/2802 Power Analyzer User Guide VOLTAGE RANGE This option allows the user to select AUTO (ranging) or a fixed range to measure the voltage signal. When auto-range has been selected, the actual range being used is displayed in parentheses after AUTO. Selections: AUTO;...
-
Page 63: Figure 29. Wiring Adjustments Menu Screen
Using the Power Analyzer the scale factor of an external current transducer. CT RATIO SETTING Press the DOWN arrow key to highlight CT RATIO, press the ENTER key. You can move the cursor in the window by using the F1 or F2 keys, these keys will move the cursor left or right. - Page 64 2801/2802 Power Analyzer User Guide from the analyzer. LOAD or SOURCE o WIRING COMPENSATE: Setting this to YES enables the analyzer to adjust for any external or internal wiring losses in the measurement of the voltage signal. When set to YES an additional option becomes available – WIRING LOSS.
- Page 65 Using the Power Analyzer LINE SWITCH & INRUSH DETECTION This option allows the user to define what type of signal is being controlled by the internal line switch: o NONE If this is selected, the internal line switch is continuously held in the ON state.
- Page 66 2801/2802 Power Analyzer User Guide INRUSH CURRENT RANGE (Shows when INTERNAL is selected) This option allows the user to select a fixed range to be used for measurements of the selected current signal. 65A; 20A; 6.5A; 2A; 0.65A; 300mA; 100mA; 30mA; 10mA INRUSH CURRENT TRIGGER ENABLE •...
- Page 67 Using the Power Analyzer user also has to configure the inrush current trigger level (INRUSH DETECT LEVEL). Inrush & Startup capture is triggered when the Line Switch is turned on and then waits for an inrush current detection. o Note: The inrush waveforms (voltage and current signals) are always captured for a period of approximately 3ms before and 65ms after the trigger event.
- Page 68 2801/2802 Power Analyzer User Guide fundamental component. The CAPTURE FILTERED WAVEFORM setting selects whether the captured waveform is to be filtered or not - The Menu choices are NO and YES. These are set by pressing the ENTER key when the CAPTURE FILTERED WAVEFORM is highlighted, use the up and down arrow keys to select NO or YES, press ENTER to select.
- Page 69 Using the Power Analyzer • MEASUREMENT TYPE = 0.02-5Hz : Uses an Adaptive HF Cutoff filter with an upper cutoff (5% down) of the lower of 4kHz or 100 times the measured fundamental frequency. STARTUP (NOT SHOWN in the menus, this is for information only) To enable the STARTUP graph you must enable either the Line Switch or turn on INRUSH CURRENT TRIGGER ENABLE to YES and set the...
- Page 70 2801/2802 Power Analyzer User Guide Press ENTER to zoom into the data. The data that is between the two cursors will fill the screen. This can be repeated to zoom in further by repeating the above steps. Note: that the cursors will be at the edge of the display windows each time you enter back into the cursor window.
-
Page 71: Setting Up The Ch2 Measurement Configuration (2802 Only)
Using the Power Analyzer When the highlighted cursor is in the correct position, use the UP or DOWN ARROW keys to change the highlighted number or symbol Press the ENTER key when finished. Note: You can press the CLEAR (F3) key to start over, or clear the screen. -
Page 72: Figure 30. System Menu Screen
2801/2802 Power Analyzer User Guide The initial setup includes setting the correct date and time in the desired format; adjusting the contrast and turning on the backlight, if necessary. Also use this menu to configure the IEEE488 address, RS232 baud rate and configure the DIGITAL I/O ports. - Page 73 Using the Power Analyzer IEEE488 Address Setting Select the appropriate IEEE-488 (GPIB) address from zero to 31 in accordance with IEEE-488. The factory default setting is address 2. RS232 Baud Rate Setting Select the appropriate baud rate (RS-232). The choices that are available are 9600, 19200, 38400.57600, 115200 and 230400.
-
Page 74: Configuration Storage
2801/2802 Power Analyzer User Guide Configuration Storage Access the LOAD/SAVE CONFIGURATION from the MAIN MENU. Press ENTER at highlighted item to access. There are 6 storage locations available. They are numbered 1 through 6. SAVE To save configuration changes, highlight SAVE, press ENTER, scroll to the configuration location in which you want to save your configuration and press ENTER. -
Page 75: Perform Dc Zero
Using the Power Analyzer ERASE To ERASE a previously saved configuration, press the ARROW key to select ERASE and then press the ENTER key. The screen will change to ERASE as shown below. Press the ARROW keys to scroll up or down the choices. Figure 33 Erase Configuration Selection Screen Perform DC Zero To initiate a DC ZERO, press the MENU key. -
Page 76: Figure 35. Diagnostic Menu Screen
2801/2802 Power Analyzer User Guide key to select from the choices LCD TEST; LED TEST; KEYPAD TEST; PERFORMANCE. The LCD TEST scans the pixels. This will continue until any one of the keys is pressed, with exception of the LINE SWITCH key which is disabled while in this menu. -
Page 77: About
Using the Power Analyzer Figure 36. Performance Screen About The ABOUT screen displays the current firmware revisions and the serial number of the unit. Figure 37. About Screen... -
Page 78: Default Settings
2801/2802 Power Analyzer User Guide Default Settings The following default settings for the 2801/2802 analyzer support the rear panel’s wiring connection Method 1. Access the SETUP MEASUREMENTS MENU from the MAIN MENU. SETUP CHANNEL MEASUREMENT TYPE LINE FREQ (<1kHz) VOLTAGE INPUT AUTO CURRENT INPUT DIRECT (A INPUT) -
Page 79: Using The Line Switch And Inrush Capabilities
Using the Power Analyzer SETUP SYSTEM MENU CONTRAST BACKLIGHT DIGITAL I/O IEEE-488 ADDRESS RS-232 BAUD RATE 115200 SET DATE 8/1/06 SET TIME 09:01:36AM DATE FORMAT MM/DD/YY TIME FORMAT 12 HOUR AM/PM LANGUAGE ENGLISH Using the Line Switch and Inrush Capabilities The following terms describe available settings for the Line Switch (Channel 1 only) and commands that can be initiated. - Page 80 2801/2802 Power Analyzer User Guide circuits. It is best to use the A+ terminal only. The bolded items are default settings. Table 1 Line Switch Options Line Switch Inrush On/Off Menu Control Trigger Detection Disabled Line Lighted Enabled Switch AC (Phase PRESET Disabled Programmable)
- Page 81 Using the Power Analyzer Inrush Enable A setting that allows for the collection of Inrush waveforms and Startup data. This setting can be disabled. Inrush Period Covers the first 65ms (nominally) after Inrush detection. Inrush Range A setting that allows the user to set a different current input range during the Inrush Period than the one used when not in the Inrush Period.
-
Page 82: Display Screens
2801/2802 Power Analyzer User Guide Display Screens Viewing Measurement Results This section describes the various Measurement Results display screens available on the 2801/2802 Power Analyzer. Numeric Display Screens In a numeric display the labels for F1 (starting left) and F2 show the measurement selection. -
Page 83: Figure 39. Acdc Inrush
Display Screens (b) Inrush Figure 39. ACDC Inrush (c) Integrated Figure 40. ACDC Integrated (d) Integrated Average (e) Integrated Maximum (f) Integrated Minimum (2) AC(rms) (a) Normal (b) Inrush (c) Integrated (d) Integrated Average (e) Integrated Maximum (f) Integrated Minimum... -
Page 84: Figure 41. Dc Normal
2801/2802 Power Analyzer User Guide (3) DC (a) Normal Figure 41. DC Normal (b) Inrush (c) Integrated (d) Integrated Average (e) Integrated Maximum (f) Integrated Minimum (4) Rectified (a) Normal Figure 42. Rectified Normal (b) Inrush (c) Integrated (d) Integrated Average (e) Integrated Maximum (f) Integrated Minimum... -
Page 85: Figure 43. Fundamental Normal
Display Screens (5) Fundamental (a) Normal Figure 43. Fundamental Normal (b) Integrated (c) Integrated Average (d) Integrated Maximum (e) Integrated Minimum (f) Load (6) ΣHarmonics (a) Normal Figure 44. ΣHarmonics Normal (7) DC Charge & Discharge (a) Integrated Figure 45. DC Charge & Discharge... -
Page 86: Figure 46. Dc Charge & Discharge
2801/2802 Power Analyzer User Guide (8) LOAD Figure 46. DC Charge & Discharge ii) Harmonics Bar Charts (1) Volts (a) Percent Log (b) Percent Linear (c) Absolute Log (d) Absolute Linear (2) Amps (a) Percent Log (b) Percent Linear (c) Absolute Log (d) Absolute Linear Figure 47. -
Page 87: Figure 48. Harmonics Absolute In List Form
Display Screens iii) Harmonics Listing (1) Absolute Use F2 and F3 to scroll from the Fundamental Harmonic to the 100 Figure 48. Harmonics Absolute in List Form (2) Percent (3) Phase iv) Waveforms (1) Real-time Figure 49. Real-time Waveform (2) Distortion Figure 50. -
Page 88: Chart Displays
2801/2802 Power Analyzer User Guide Chart Displays Starting Startup and Inrush Charts As previously described, the Startup and Inrush charts are initiated by the detection of an Inrush current and/or the turning on of the internal line switch. Note that the reported Inrush Numeric Measurement results are the maximal results collected during the period defined by the Startup chart. -
Page 89: Line Switch Enabled And Inrush Detection Enabled
Display Screens off the line switch at any time; this has no affect on the collection of data for the Startup and Inrush Charts. In this mode, if the user has selected to use the Internal Line Switch (either DC or AC mode), and the user has enabled auto-range on the current input, then the 2801/2802 automatically selects the uppermost range of the selected current input just before it actually turns on the line switch. - Page 90 2801/2802 Power Analyzer User Guide Pressing F2 when viewing a chart display will enter you into the Inspect Mode and enable the cursors for inspecting the data.. Normal viewing mode: In this mode the selected data covers a time span equal to the extent of the data collected.
-
Page 91: Figure 51. No Inrush Detected
Display Screens and minimum for each measurement period and the TREND is the averaged or smoothed data. This is selected by pressing the F1 key and moving the cursor to EXTENTS OR TREND. Press the ENTER key and use the UP or DOWN arrow key to select EXTENTS or TREND. -
Page 92: Figure 52. History Of Amps Acdc, Trend In Full View
2801/2802 Power Analyzer User Guide For the History chart in Normal viewing mode, all of the available history data is shown. Note that the right end of the scale shows the most recent data and the left end value of the x-axis is fixed at the time at which the data collection was started. -
Page 93: Figure 56. History Of Amps Acdc, Extents In Zoom Mode
Display Screens Figure 56. History of Amps ACDC, Extents in Zoom Mode The following is a list of available data for the History charts. The data to be displayed is selected by pressing the F1 key which will enter you into the HISTORY CHART DATA menu. Use the UP or DOWN arrow key to highlight MEASUREMENT if it is not highlighted, press the ENTER key to view the available display types, use the UP or DOWN arrow keys to scroll through... - Page 94 2801/2802 Power Analyzer User Guide ACDC FUNDAMENTAL PERCENT THD PEAK PEAK AC Startup Charts The Startup chart maintains a record of the same set of measurement results as the History chart, but is started and stopped depending on the detection of an Inrush current and/or by turning on the internal Line Switch (depending on configuration).
-
Page 95: Figure 57. Startup In Full View, Trend
Display Screens Figure 57. Startup in Full View, Trend Figure 58. Startup in Full View, Extents Figure 59. Startup, Partial, Extents Figure 60. Startup, Partial, Extents... -
Page 96: Figure 61. Startup In Zoom Mode
2801/2802 Power Analyzer User Guide Figure 61. Startup in Zoom Mode The following is a list of available data for the STARTUP charts. The data to be displayed is selected by pressing the F1 key which will enter you into the HISTORY CHART DATA menu. Use the UP or DOWN arrow key to highlight MEASUREMENT if it is not highlighted, press the ENTER key to view the available display types, use the UP or DOWN arrow keys to scroll through... -
Page 97: Figure 62. Range Change
Display Screens FUNDAMENTAL PERCENT THD PEAK PEAK AC Inrush Charts The Inrush chart maintains a record of the actual current and voltage waveforms from a time nominally 3ms prior to the detection of an Inrush current and/or by the turning on of the internal line switch (depending on configuration) to nominally 65ms afterwards. -
Page 98: Figure 63. Amps Inrush In Normal Mode
2801/2802 Power Analyzer User Guide Figure 63. Amps Inrush in Normal Mode Figure 64. Inrush in Zoom Mode Figure 65. Inrush in Zoom Mode, Additional Zoom Level The following is a list of available data for the INRUSH charts. The data to be displayed is selected by pressing the F1 key which will enter you into the INRUSH CHART DATA menu. -
Page 99: Printing Results
Calibrated date • Time in hours : minutes : seconds • Elapsed time Vitrek 2801 or 2802 model number • • Firmware Version number The samples provided have been printed from each of the display groups Basics, Harmonics, Waveforms, and History. - Page 100 2801/2802 Power Analyzer User Guide • The Harmonics BARGRAPH data will print separate bar charts for ABS, %, Lin or Log for current or voltage. • For the Waveforms group, volts, amps and power waveforms will print together if a graphical print is selected. If a text only printer is selected, then volts and amps will print together.
-
Page 101: Figure 66. Configuration Printout
Printing Results Figure 66. Configuration Printout... -
Page 102: Figure 67. Waveform Channel 1 Real-Time
2801/2802 Power Analyzer User Guide Figure 67. Waveform Channel 1 Real-time... -
Page 103: Figure 68. Waveform Channe1 Distortion
Printing Results Figure 68. Waveform Channe1 Distortion... -
Page 104: Figure 69. History Chart Volts Acdc, Trends View
2801/2802 Power Analyzer User Guide Figure 69. History Chart VOLTS ACDC, Trends View... -
Page 105: Figure 70. History Chart Amps Percent Thd Extents View
Printing Results Figure 70. History Chart AMPS PERCENT THD Extents View... -
Page 106: Figure 71. Harmonics Listing Page 1
2801/2802 Power Analyzer User Guide Figure 71. Harmonics Listing page 1... -
Page 107: Figure 72. Harmonics Listing Page 2
Printing Results Figure 72. Harmonics Listing page 2... -
Page 108: Sending Commands And Interrogatives
2801/2802 Power Analyzer User Guide Sending Commands and Interrogatives All commands are sent to the 2801/2 using standard ASCII characters. In general, the user may freely use upper- or lower-case characters within commands. A command is actioned when the Line Feed ASCII character is received (or when a character is received with EOI asserted over the IEEE488 interface). -
Page 109: Usb
Sending Commands and Interrogatives The user should read the reply to an interrogative from the “interrogative” response linkage to the driver DLL. See the driver DLL documentation for details regarding this. RS232 The 2801/2 automatically transmits the response over the RS232 Note: For RS232 after sending the READ = command, you must send the character “... -
Page 110: Resetting The Instrument
2801/2802 Power Analyzer User Guide The user can interrogate the unit regarding the remote state of that particular interface by using the REMOTE? interrogative, the response will be 0 if in local, or 1 if in remote. Resetting the Instrument The entire instrument can be reset, as if the power was cycled at the front panel, by using the *RST command. -
Page 111: Setting The Date Or Time
Sending Commands and Interrogatives Setting the Date or Time DATEFORMAT=0 – sets that all dates will use the MM/DD/YY format over the interfaces and on the display DATEFORMAT=1 – sets that all dates will use the DD/MM/YY format over the interfaces and on the display DATEFORMAT=2 –... -
Page 112: Ieee488 Status Byte Commands
2801/2802 Power Analyzer User Guide RECALL=value – recalls and executes the configuration from store # set by value ERASE=value – erases any configuration stored in the store # set by value IEEE488 Status Byte Commands The IEEE488 interface has an SRQ capability which is controlled by a status byte internal to the 2801/2. - Page 113 Sending Commands and Interrogatives WAVECAPTURE=1 – enables waveform capture (if otherwise enabled by configuration and signal input). WAVECAPTURE? – queries the present WAVECAPTURE setting CLR-HISTORY – this command clears the history collection process and restarts it. HISTORY=0 – disables history chart collection HISTORY=1 –...
- Page 114 2801/2802 Power Analyzer User Guide measurement results for channel 2 (when configured for 2ch (Async) applications only) STOP-INTEGRATION - this command stops the integration of measurement results. If the 2801/2 was already not integrating then this command has no affect. This command does not affect any integrated measurement results. STOP-INTEGRATION(CH2) - this command stops the integration of measurement results for channel 2 (when configured for 2ch (Async) applications only).
-
Page 115: Commanding And Controlling A Dc Zero
Sending Commands and Interrogatives is integrating. This is for the state of channel 2 integration when the 2802 is configured for 2ch (Async) applications. Note : When the 2802 is configured for 2ch (Async) applications the commands without the (CH2) portion only affect channel 1, in all other applications they affect both channels results. -
Page 116: Configuring Measurements
2801/2802 Power Analyzer User Guide BACKLIGHT? – queries the present BACKLIGHT setting. CONTRAST=value – sets the display contrast to ‘value’ which must be an integer in the range 1 to 10. CONTRAST? – queries the present CONTRAST setting. Configuring Measurements Many commands can have either (CH1) or (CH2) added to the keyword to allow for control and queries of channel 1 and 2 settings independently, when allowed by the overall configuration of the 2802. -
Page 117: Resultavg - Result Averaging Period
Sending Commands and Interrogatives APPLICATION=5 – (2802 only) sets the configured application type selection to 2ch (Async) APPLICATION? – (2802 only) queries the present APPLICATION setting RESULTAVG – Result Averaging Period RESULTAVG=n – sets the result averaging period (see the table below for the values of n) no result averaging 10ms result averaging... -
Page 118: Filtertype - Hf Cutoff Filter
2801/2802 Power Analyzer User Guide MSRTYPE=6 – sets the measurement type to the VLF selection (0.02Hz to 5Hz) MSRTYPE? – queries the present MSRTYPE setting FILTERTYPE – HF Cutoff Filter This is only effective when MSRTYPE=4. FILTERTYPE=0 – sets for no HF filter cutoff FILTERTYPE=1 –... -
Page 119: Maxfund - Maximum Fundamental Frequency
Sending Commands and Interrogatives MINFUND=value – sets that the highest fundamental frequency to which the 2801/2 will synchronize is that given by value (in Hz). MINFUND? – queries the present MINFUND setting MAXFUND – Maximum Fundamental Frequency This is only effective when MSRTYPE=4 MAXFUND=value –... -
Page 120: Ripplefreq - Dc Ripple Base Frequency
2801/2802 Power Analyzer User Guide RIPPLEFREQ – DC Ripple Base Frequency This is only effective when MSRTYPE=3 and MSRDCRIPPLE=1 RIPPLEFREQ=value – sets that the base frequency for “harmonic” DC ripple measurement should be value (in Hz). RIPPLEFREQ? – queries the present RIPPLEFREQ setting. DCDNRANGEDLY –... -
Page 121: Arange - Select A Current Input Range (Shunt Input Only)
Sending Commands and Interrogatives AINPUT? – queries the present AINPUT settings ARANGE – Select a Current Input Range (Shunt Input Only) This is only effective when AINPUT=0 or AINPUT=1 ARANGE=value – sets the A input range to be used to that associated with the value as shown below –... -
Page 122: Shuntratio1 And Shuntratio2 - Sets A Input Ct Ratio
2801/2802 Power Analyzer User Guide STRICTRANGING=0 – enables the 2801/2 to select a higher full-scale range than set by the VRANGE, ARANGE or TRANGE command if needed to correctly measure the actual input signal. STRICTRANGING=1 – forces the 2801/2 to select the range selected by the VRANGE, ARANGE or TRANGE setting under all circumstances. -
Page 123: Msrsource - Sets Whether The Pwr Source / Load Is To Be Meas
Sending Commands and Interrogatives MSRSOURCE – Sets Whether the Pwr Source / Load is to be Meas. MSRSOURCE=0 – sets that the Load is to be measured (i.e. the measurement is downstream from the 2801/2). MSRSOURCE=1 – sets that the Source is to be measured (i.e. the measurement is upstream from the 2801/2). -
Page 124: Vburdencomp - Enables Voltage Burden Compensation
2801/2802 Power Analyzer User Guide VBURDENCOMP – Enables Voltage Burden Compensation (Effects Channel 1 or None Only) VBURDENCOMP=0 – disables V input burden compensation VBURDENCOMP=1 – enables V input burden compensation VBURDENCOMP? – queries the present VBURDENCOMP setting REVERSEV – Enables Reversal of Voltage Measurement Polarities REVERSEV=0 –... -
Page 125: Inrusharng - Sets The A Input Inrush Range
Sending Commands and Interrogatives LINEPHASE? – queries the present LINEPHASE setting INRUSHARNG – Sets the A input Inrush Range This is only effective if LINECONTROL=1 and AINPUT=0 or 1 INRUSHARNG=value – sets the A input range to select immediately prior to and for 150ms following turning on the internal line switch. -
Page 126: Trigvolts - Sets The Voltage For Waveform Capture Triggering
2801/2802 Power Analyzer User Guide WAVETRIG=1 – enables detection of peak voltages to trigger a waveform capture WAVETRIG=2 – enables detection of glitch voltages to trigger a waveform capture WAVETRIG=3 – enables detection of peak currents to trigger a waveform capture WAVETRIG=4 –... -
Page 127: Read And Update Commands
Sending Commands and Interrogatives READ and UPDATE commands These commands are used to control obtaining measurement data from the 2801/2 in the normal manner. UPDATE=value – sets the rate at which new measurement data becomes available to this interface to ‘value’ milliseconds. If UPDATE=0 is specified then the measurement results are only updated each time that a new READ=data command is received, but not at any other time. - Page 128 2801/2802 Power Analyzer User Guide Channel Specification (defaults to CH1) Channel 1 data Channel 2 data Channel 1 data Channel 2 data Channel 1 data Channel 2 data TOTAL Combined Channel 1 & 2 data Combined Channel 1 & 2 data Measurement Collection Type Specification (defaults to normal) INRUSH INTEG...
-
Page 129: Normal Results
Sending Commands and Interrogatives Normal Results – These return a single floating point value. AMPS[chnl] or AMPS[chnl,ACDC] AMPS[chnl,AC] AMPS[chnl,DC] AMPS[chnl,FUND] A-CF[chnl] or A-CF[chnl,ACDC] A-CF[chnl,AC] A-FF[chnl] A-PK[chnl] or A-PK[chnl,ACDC] A-PK[chnl,AC] A-HIPK[chnl] or A-HIPK[chnl,ACDC] A-HIPK[chnl,AC] A-LOPK[chnl] or A-LOPK[chnl,ACDC] A-LOPK[chnl,AC] A-PKPK[chnl] A-RECT[chnl] FREQ[chnl] LOADR[chnl,FUND] LOADR[chnl,DC] LOADZ[chnl,FUND]... - Page 130 2801/2802 Power Analyzer User Guide V-CF[chnl,AC] V-FF[chnl] V-PK[chnl] or V-PK[chnl,ACDC] V-PK[chnl,AC] V-HIPK[chnl] or V-HIPK[chnl,ACDC] V-HIPK[chnl,AC] V-LOPK[chnl] or V-LOPK[chnl,ACDC] V-LOPK[chnl,AC] V-PKPK[chnl] V-RECT[chnl] V-WYE WATTS[chnl] or WATTS[chnl,ACDC] WATTS[chnl,AC] WATTS[chnl,DC] WATTS[chnl,FUND] LOSS EFFY TEMPERATURE The following all return a single floating point, computed as a total over all harmonics between harmonic # ‘start’...
- Page 131 Sending Commands and Interrogatives V-HARMS[chnl,start,end,step] V-THD-HARMS[chnl,start,end,step] A-HARMS[chnl,start,end,step] A-THD-HARMS[chnl,start,end,step] W-HARMS[chnl,start,end,step] PF-HARMS[chnl,start,end,step] VA-HARMS[chnl,start,end,step] VAR-HARMS[chnl,start,end,step] The following return ‘npoints’ pairs of values (max followed by min) if EXTENTS is included, or a single value if MEDIAN is included. The points are equally spread over the inclusive phase range 0 thru’ 360° of a single cycle.
- Page 132 2801/2802 Power Analyzer User Guide A-HIST[chnl,ACDC,MEDIAN,TRENDS,npoints,t_start,t_span] A-HIST[chnl,AC,EXTENTS,LIMITS,npoints,t_start,t_span] A-HIST[chnl,AC,MEDIAN,LIMITS,npoints,t_start,t_span] A-HIST[chnl,AC,EXTENTS,TRENDS,npoints,t_start,t_span] A-HIST[chnl,AC,MEDIAN,TRENDS,npoints,t_start,t_span] A-HIST[chnl,DC,EXTENTS,LIMITS,npoints,t_start,t_span] A-HIST[chnl,DC,MEDIAN,LIMITS,npoints,t_start,t_span] A-HIST[chnl,DC,EXTENTS,TRENDS,npoints,t_start,t_span] A-HIST[chnl,DC,MEDIAN,TRENDS,npoints,t_start,t_span] A-HIST[chnl,FUND,EXTENTS,LIMITS,npoints,t_start,t_span] A-HIST[chnl,FUND,MEDIAN,LIMITS,npoints,t_start,t_span] A-HIST[chnl,FUND,EXTENTS,TRENDS,npoints,t_start,t_span] A-HIST[chnl,FUND,MEDIAN,TRENDS,npoints,t_start,t_span] A-PK-HIST[chnl,ACDC,EXTENTS,LIMITS,npoints,t_start,t_span] A-PK-HIST[chnl,ACDC,MEDIAN,LIMITS,npoints,t_start,t_span] A-PK-HIST[chnl,ACDC,EXTENTS,TRENDS,npoints,t_start,t_span] A-PK-HIST[chnl,ACDC,MEDIAN,TRENDS,npoints,t_start,t_span] A-PK-HIST[chnl,AC,EXTENTS,LIMITS,npoints,t_start,t_span] A-PK-HIST[chnl,AC,MEDIAN,LIMITS,npoints,t_start,t_span] A-PK-HIST[chnl,AC,EXTENTS,TRENDS,npoints,t_start,t_span] A-PK-HIST[chnl,AC,MEDIAN,TRENDS,npoints,t_start,t_span] A-THD-HIST[chnl,EXTENTS,LIMITS,npoints,t_start,t_span] A-THD-HIST[chnl,MEDIAN,LIMITS,npoints,t_start,t_span] A-THD-HIST[chnl,EXTENTS,TRENDS,npoints,t_start,t_span] A-THD-HIST[chnl,MEDIAN,TRENDS,npoints,t_start,t_span] FREQ-HIST[chnl,,EXTENTS,LIMITS,npoints,t_start,t_span] FREQ-HIST[chnl,,MEDIAN,LIMITS,npoints,t_start,t_span] FREQ-HIST[chnl,,EXTENTS,TRENDS,npoints,t_start,t_span] FREQ-HIST[chnl,,MEDIAN,TRENDS,npoints,t_start,t_span] PF-HIST[chnl,ACDC,EXTENTS,LIMITS,npoints,t_start,t_span] PF-HIST[chnl,ACDC,MEDIAN,LIMITS,npoints,t_start,t_span] PF-HIST[chnl,ACDC,EXTENTS,TRENDS,npoints,t_start,t_span] PF-HIST[chnl,ACDC,MEDIAN,TRENDS,npoints,t_start,t_span] PF-HIST[chnl,AC,EXTENTS,LIMITS,npoints,t_start,t_span] PF-HIST[chnl,AC,MEDIAN,LIMITS,npoints,t_start,t_span] PF-HIST[chnl,AC,EXTENTS,TRENDS,npoints,t_start,t_span] PF-HIST[chnl,AC,MEDIAN,TRENDS,npoints,t_start,t_span] PF-HIST[chnl,FUND,EXTENTS,LIMITS,npoints,t_start,t_span]...
- Page 133 Sending Commands and Interrogatives VA-HIST[chnl,ACDC,EXTENTS,LIMITS,npoints,t_start,t_span] VA-HIST[chnl,ACDC,MEDIAN,LIMITS,npoints,t_start,t_span] VA-HIST[chnl,ACDC,EXTENTS,TRENDS,npoints,t_start,t_span] VA-HIST[chnl,ACDC,MEDIAN,TRENDS,npoints,t_start,t_span] VA-HIST[chnl,AC,EXTENTS,LIMITS,npoints,t_start,t_span] VA-HIST[chnl,AC,MEDIAN,LIMITS,npoints,t_start,t_span] VA-HIST[chnl,AC,EXTENTS,TRENDS,npoints,t_start,t_span] VA-HIST[chnl,AC,MEDIAN,TRENDS,npoints,t_start,t_span] VA-HIST[chnl,DC,EXTENTS,LIMITS,npoints,t_start,t_span] VA-HIST[chnl,DC,MEDIAN,LIMITS,npoints,t_start,t_span] VA-HIST[chnl,DC,EXTENTS,TRENDS,npoints,t_start,t_span] VA-HIST[chnl,DC,MEDIAN,TRENDS,npoints,t_start,t_span] VA-HIST[chnl,FUND,EXTENTS,LIMITS,npoints,t_start,t_span] VA-HIST[chnl,FUND,MEDIAN,LIMITS,npoints,t_start,t_span] VA-HIST[chnl,FUND,EXTENTS,TRENDS,npoints,t_start,t_span] VA-HIST[chnl,FUND,MEDIAN,TRENDS,npoints,t_start,t_span] VAR-HIST[chnl,AC,EXTENTS,LIMITS,npoints,t_start,t_span] VAR-HIST[chnl,AC,MEDIAN,LIMITS,npoints,t_start,t_span] VAR-HIST[chnl,AC,EXTENTS,TRENDS,npoints,t_start,t_span] VAR-HIST[chnl,AC,MEDIAN,TRENDS,npoints,t_start,t_span] VAR-HIST[chnl,FUND,EXTENTS,LIMITS,npoints,t_start,t_span] VAR-HIST[chnl,FUND,MEDIAN,LIMITS,npoints,t_start,t_span] VAR-HIST[chnl,FUND,EXTENTS,TRENDS,npoints,t_start,t_span] VAR-HIST[chnl,FUND,MEDIAN,TRENDS,npoints,t_start,t_span] V-HIST[chnl,ACDC,EXTENTS,LIMITS,npoints,t_start,t_span] V-HIST[chnl,ACDC,MEDIAN,LIMITS,npoints,t_start,t_span] V-HIST[chnl,ACDC,EXTENTS,TRENDS,npoints,t_start,t_span] V-HIST[chnl,ACDC,MEDIAN,TRENDS,npoints,t_start,t_span] V-HIST[chnl,AC,EXTENTS,LIMITS,npoints,t_start,t_span] V-HIST[chnl,AC,MEDIAN,LIMITS,npoints,t_start,t_span] V-HIST[chnl,AC,EXTENTS,TRENDS,npoints,t_start,t_span] V-HIST[chnl,AC,MEDIAN,TRENDS,npoints,t_start,t_span] V-HIST[chnl,DC,EXTENTS,LIMITS,npoints,t_start,t_span] V-HIST[chnl,DC,MEDIAN,LIMITS,npoints,t_start,t_span] V-HIST[chnl,DC,EXTENTS,TRENDS,npoints,t_start,t_span] V-HIST[chnl,DC,MEDIAN,TRENDS,npoints,t_start,t_span] V-HIST[chnl,FUND,EXTENTS,LIMITS,npoints,t_start,t_span] V-HIST[chnl,FUND,MEDIAN,LIMITS,npoints,t_start,t_span] V-HIST[chnl,FUND,EXTENTS,TRENDS,npoints,t_start,t_span]...
- Page 134 2801/2802 Power Analyzer User Guide V-PK-HIST[chnl,ACDC,MEDIAN,LIMITS,npoints,t_start,t_span] V-PK-HIST[chnl,ACDC,EXTENTS,TRENDS,npoints,t_start,t_span] V-PK-HIST[chnl,ACDC,MEDIAN,TRENDS,npoints,t_start,t_span] V-PK-HIST[chnl,AC,EXTENTS,LIMITS,npoints,t_start,t_span] V-PK-HIST[chnl,AC,MEDIAN,LIMITS,npoints,t_start,t_span] V-PK-HIST[chnl,AC,EXTENTS,TRENDS,npoints,t_start,t_span] V-PK-HIST[chnl,AC,MEDIAN,TRENDS,npoints,t_start,t_span] V-THD-HIST[chnl,EXTENTS,LIMITS,npoints,t_start,t_span] V-THD-HIST[chnl,MEDIAN,LIMITS,npoints,t_start,t_span] V-THD-HIST[chnl,EXTENTS,TRENDS,npoints,t_start,t_span] V-THD-HIST[chnl,MEDIAN,TRENDS,npoints,t_start,t_span] V-WYE-HIST[chnl,EXTENTS,LIMITS,npoints,t_start,t_span] V-WYE-HIST[chnl,MEDIAN,LIMITS,npoints,t_start,t_span] V-WYE-HIST[chnl,EXTENTS,TRENDS,npoints,t_start,t_span] V-WYE-HIST[chnl,MEDIAN,TRENDS,npoints,t_start,t_span] W-HIST[chnl,ACDC,EXTENTS,LIMITS,npoints,t_start,t_span] W-HIST[chnl,ACDC,MEDIAN,LIMITS,npoints,t_start,t_span] W-HIST[chnl,ACDC,EXTENTS,TRENDS,npoints,t_start,t_span] W-HIST[chnl,ACDC,MEDIAN,TRENDS,npoints,t_start,t_span] W-HIST[chnl,AC,EXTENTS,LIMITS,npoints,t_start,t_span] W-HIST[chnl,AC,MEDIAN,LIMITS,npoints,t_start,t_span] W-HIST[chnl,AC,EXTENTS,TRENDS,npoints,t_start,t_span] W-HIST[chnl,AC,MEDIAN,TRENDS,npoints,t_start,t_span] W-HIST[chnl,DC,EXTENTS,LIMITS,npoints,t_start,t_span] W-HIST[chnl,DC,MEDIAN,LIMITS,npoints,t_start,t_span] W-HIST[chnl,DC,EXTENTS,TRENDS,npoints,t_start,t_span] W-HIST[chnl,DC,MEDIAN,TRENDS,npoints,t_start,t_span] W-HIST[chnl,FUND,EXTENTS,LIMITS,npoints,t_start,t_span] W-HIST[chnl,FUND,MEDIAN,LIMITS,npoints,t_start,t_span] W-HIST[chnl,FUND,EXTENTS,TRENDS,npoints,t_start,t_span] W-HIST[chnl,FUND,MEDIAN,TRENDS,npoints,t_start,t_span] TEMP-HIST[chnl,EXTENTS,LIMITS,npoints,t_start,t_span] TEMP-HIST[chnl,MEDIAN,LIMITS,npoints,t_start,t_span] TEMP-HIST[chnl,EXTENTS,TRENDS,npoints,t_start,t_span] TEMP-HIST[chnl,MEDIAN,TRENDS,npoints,t_start,t_span] LOSS-HIST[chnl,EXTENTS,LIMITS,npoints,t_start,t_span] LOSS-HIST[chnl,MEDIAN,LIMITS,npoints,t_start,t_span] LOSS-HIST[chnl,EXTENTS,TRENDS,npoints,t_start,t_span]...
- Page 135 Sending Commands and Interrogatives EFFY-HIST[chnl,EXTENTS,TRENDS,npoints,t_start,t_span] EFFY-HIST[chnl,MEDIAN,TRENDS,npoints,t_start,t_span] A-STARTUP[chnl,ACDC,EXTENTS,LIMITS,npoints,t_start,t_span] A- STARTUP [chnl,ACDC,MEDIAN,LIMITS,npoints,t_start,t_span] A- STARTUP [chnl,ACDC,EXTENTS,TRENDS,npoints,t_start,t_span] A- STARTUP [chnl,ACDC,MEDIAN,TRENDS,npoints,t_start,t_span] A- STARTUP [chnl,AC,EXTENTS,LIMITS,npoints,t_start,t_span] A- STARTUP [chnl,AC,MEDIAN,LIMITS,npoints,t_start,t_span] A- STARTUP [chnl,AC,EXTENTS,TRENDS,npoints,t_start,t_span] A- STARTUP [chnl,AC,MEDIAN,TRENDS,npoints,t_start,t_span] A- STARTUP [chnl,DC,EXTENTS,LIMITS,npoints,t_start,t_span] A- STARTUP [chnl,DC,MEDIAN,LIMITS,npoints,t_start,t_span] A- STARTUP [chnl,DC,EXTENTS,TRENDS,npoints,t_start,t_span] A- STARTUP [chnl,DC,MEDIAN,TRENDS,npoints,t_start,t_span] A- STARTUP [chnl,FUND,EXTENTS,LIMITS,npoints,t_start,t_span] A- STARTUP [chnl,FUND,MEDIAN,LIMITS,npoints,t_start,t_span] A- STARTUP [chnl,FUND,EXTENTS,TRENDS,npoints,t_start,t_span]...
- Page 136 2801/2802 Power Analyzer User Guide PF- STARTUP [chnl,AC,MEDIAN,TRENDS,npoints,t_start,t_span] PF- STARTUP [chnl,FUND,EXTENTS,LIMITS,npoints,t_start,t_span] PF- STARTUP [chnl,FUND,MEDIAN,LIMITS,npoints,t_start,t_span] PF- STARTUP [chnl,FUND,EXTENTS,TRENDS,npoints,t_start,t_span] PF- STARTUP [chnl,FUND,MEDIAN,TRENDS,npoints,t_start,t_span] VA- STARTUP [chnl,ACDC,EXTENTS,LIMITS,npoints,t_start,t_span] VA- STARTUP [chnl,ACDC,MEDIAN,LIMITS,npoints,t_start,t_span] VA- STARTUP [chnl,ACDC,EXTENTS,TRENDS,npoints,t_start,t_span] VA- STARTUP [chnl,ACDC,MEDIAN,TRENDS,npoints,t_start,t_span] VA- STARTUP [chnl,AC,EXTENTS,LIMITS,npoints,t_start,t_span] VA- STARTUP [chnl,AC,MEDIAN,LIMITS,npoints,t_start,t_span] VA- STARTUP [chnl,AC,EXTENTS,TRENDS,npoints,t_start,t_span] VA- STARTUP [chnl,AC,MEDIAN,TRENDS,npoints,t_start,t_span] VA- STARTUP [chnl,DC,EXTENTS,LIMITS,npoints,t_start,t_span] VA- STARTUP [chnl,DC,MEDIAN,LIMITS,npoints,t_start,t_span]...
- Page 137 Sending Commands and Interrogatives V- STARTUP [chnl,FUND,EXTENTS,LIMITS,npoints,t_start,t_span] V- STARTUP [chnl,FUND,MEDIAN,LIMITS,npoints,t_start,t_span] V- STARTUP [chnl,FUND,EXTENTS,TRENDS,npoints,t_start,t_span] V- STARTUP [chnl,FUND,MEDIAN,TRENDS,npoints,t_start,t_span] V-PK- STARTUP [chnl,ACDC,EXTENTS,LIMITS,npoints,t_start,t_span] V-PK- STARTUP [chnl,ACDC,MEDIAN,LIMITS,npoints,t_start,t_span] V-PK- STARTUP [chnl,ACDC,EXTENTS,TRENDS,npoints,t_start,t_span] V-PK- STARTUP [chnl,ACDC,MEDIAN,TRENDS,npoints,t_start,t_span] V-PK- STARTUP [chnl,AC,EXTENTS,LIMITS,npoints,t_start,t_span] V-PK- STARTUP [chnl,AC,MEDIAN,LIMITS,npoints,t_start,t_span] V-PK- STARTUP [chnl,AC,EXTENTS,TRENDS,npoints,t_start,t_span] V-PK- STARTUP [chnl,AC,MEDIAN,TRENDS,npoints,t_start,t_span] V-THD- STARTUP [chnl,EXTENTS,LIMITS,npoints,t_start,t_span] V-THD- STARTUP [chnl,MEDIAN,LIMITS,npoints,t_start,t_span] V-THD- STARTUP [chnl,EXTENTS,TRENDS,npoints,t_start,t_span]...
-
Page 138: Highest Measurement During An Inrush & Startup
2801/2802 Power Analyzer User Guide Highest Measurement During an Inrush & Startup These all return a single floating point value. AMPS[chnl,INRUSH] or AMPS[chnl,ACDC,INRUSH] AMPS[chnl,AC,INRUSH] AMPS[chnl,DC,INRUSH] AMPS[chnl,FUND,INRUSH] A-CF[chnl,INRUSH] or A-CF[chnl,ACDC,INRUSH] A-CF[chnl,AC,INRUSH] A-FF[chnl,INRUSH] A-PK[chnl,INRUSH] or A-PK[chnl,ACDC,INRUSH] A-PK[chnl,AC,INRUSH] A-HIPK[chnl,INRUSH] or A-HIPK[chnl,ACDC,INRUSH] A-HIPK[chnl,AC,INRUSH] A-LOPK[chnl,INRUSH] or A-LOPK[chnl,ACDC,INRUSH] A-LOPK[chnl,AC,INRUSH] A-PKPK[chnl,INRUSH] A-RECT[chnl,INRUSH]... -
Page 139: Integrated Results (Scaling In Unit.hours)
Sending Commands and Interrogatives V-LOPK[chnl,INRUSH] or V-LOPK[chnl,ACDC,INRUSH] V-LOPK[chnl,AC,INRUSH] V-PKPK[chnl,INRUSH] V-RECT[chnl,INRUSH] V-WYE[INRUSH] WATTS[chnl,INRUSH] or WATTS[chnl,ACDC,INRUSH] WATTS[chnl,AC,INRUSH] WATTS[chnl,DC,INRUSH] WATTS[chnl,FUND,INRUSH] Integrated Results (scaling in unit.Hours) These all return a single floating point value. AMPS[chnl,INTEG] or AMPS[chnl,ACDC,INTEG] AMPS[chnl,AC,INTEG] AMPS[chnl,DC,INTEG] AMPS[chnl,FUND,INTEG] A-RECT[chnl,INTEG] VA[chnl,INTEG] or VA[chnl,ACDC,INTEG] VA[chnl,AC,INTEG] VA[chnl,DC,INTEG] VA[chnl,FUND,INTEG]... -
Page 140: Measurement Extents During Integration
2801/2802 Power Analyzer User Guide AMPS[chnl,AC,INTEG-AVG] AMPS[chnl,DC,INTEG-AVG] AMPS[chnl,FUND,INTEG-AVG] A-RECT[chnl,INTEG-AVG] VA[chnl,INTEG-AVG] or VA[chnl,ACDC,INTEG-AVG] VA[chnl,AC,INTEG-AVG] VA[chnl,DC,INTEG-AVG] VA[chnl,FUND,INTEG-AVG] PF[chnl,INTEG-AVG] or VA[chnl,ACDC,INTEG-AVG] PF[chnl,AC,INTEG-AVG] PF[chnl,FUND,INTEG-AVG] VAR[chnl,INTEG-AVG] or VAR[chnl,AC,INTEG-AVG] VAR[chnl,FUND,INTEG-AVG] VOLTS[chnl,INTEG-AVG] or VOLTS[chnl,ACDC,INTEG-AVG] VOLTS[chnl,AC,INTEG-AVG] VOLTS[chnl,DC,INTEG-AVG] VOLTS[chnl,FUND,INTEG-AVG] WATTS[chnl,INTEG-AVG] or WATTS[chnl,ACDC,INTEG-AVG] WATTS[chnl,AC,INTEG-AVG] WATTS[chnl,DC,INTEG-AVG] WATTS[chnl,FUND,INTEG-AVG] Measurement Extents during Integration These all return a single floating point value. - Page 141 Sending Commands and Interrogatives A-RECT[chnl,INTEG-MAX] FREQ[chnl,INTEG-MAX] PF[chnl,INTEG-MAX] or PF[chnl,ACDC,INTEG-MAX] PF[chnl,AC,INTEG-MAX] PF[chnl,FUND,INTEG-MAX] DPF[chnl,INTEG-MAX] VA[chnl,INTEG-MAX] or VA[chnl,ACDC,INTEG-MAX] VA[chnl,AC,INTEG-MAX] VA[chnl,DC,INTEG-MAX] VA[chnl,FUND,INTEG-MAX] VAR[chnl,INTEG-MAX] or VAR[chnl,AC,INTEG-MAX] VAR[chnl,FUND,INTEG-MAX] VOLTS[chnl,INTEG-MAX] or VOLTS[chnl,ACDC,INTEG-MAX] VOLTS[chnl,AC,INTEG-MAX] VOLTS[chnl,DC,INTEG-MAX] VOLTS[chnl,FUND,INTEG-MAX] V-CF[chnl,INTEG-MAX] or V-CF[chnl,ACDC,INTEG-MAX] V-CF[chnl,AC,INTEG-MAX] V-FF[chnl,INTEG-MAX] V-PK[chnl,INTEG-MAX] or V-PK[chnl,ACDC,INTEG-MAX] V-PK[chnl,AC,INTEG-MAX] V-HIPK[chnl,INTEG-MAX] or V-HIPK[chnl,ACDC,INTEG-MAX] V-HIPK[chnl,AC,INTEG-MAX] V-LOPK[chnl,INTEG-MAX] or V-LOPK[chnl,ACDC,INTEG-MAX] V-LOPK[chnl,AC,INTEG-MAX]...
- Page 142 2801/2802 Power Analyzer User Guide A-PK[chnl,AC,INTEG- MIN] A-HIPK[chnl,INTEG- MIN] or A-HIPK[chnl,ACDC,INTEG- MIN] A-HIPK[chnl,AC,INTEG- MIN] A-LOPK[chnl,INTEG- MIN] or A-LOPK[chnl,ACDC,INTEG- MIN] A-LOPK[chnl,AC,INTEG- MIN] A-PKPK[chnl,INTEG- MIN] A-RECT[chnl,INTEG- MIN] FREQ[chnl,INTEG- MIN] PF[chnl,INTEG- MIN] or PF[chnl,ACDC,INTEG- MIN] PF[chnl,AC,INTEG- MIN] PF[chnl,FUND,INTEG- MIN] DPF[chnl,INTEG- MIN] VA[chnl,INTEG- MIN] or VA[chnl,ACDC,INTEG- MIN] VA[chnl,AC,INTEG- MIN] VA[chnl,DC,INTEG- MIN] VA[chnl,FUND,INTEG- MIN]...
-
Page 143: Charge & Discharge Data (Scaled In Unit.hours)
Sending Commands and Interrogatives Charge & Discharge data (scaled in unit.Hours) These all return a single floating point value. AMPS[chnl,DC,CHARGE] AMPS[chnl,DC,DISCHARGE] VA[chnl,DC,CHARGE] VA[chnl,DC,DISCHARGE] VOLTS[chnl,DC,CHARGE] VOLTS[chnl,DC,DISCHARGE] WATTS[chnl,DC,CHARGE] WATTS[chnl,DC,DISCHARGE] Special Data The following all return a special format data, specific to each keyword. TIME Returns the present time of day DATE... - Page 144 2801/2802 Power Analyzer User Guide INRUSH-SPAN Returns the time span of the full inrush waveform chart (in floating point seconds) INRUSH-TIME Returns the start time of day for the inrush waveform chart INRUSH-DATE Returns the start date for the inrush waveform chart NHARMS[chnl] Returns the integer number of valid...
- Page 145 Sending Commands and Interrogatives...
-
Page 146: Appendix A - Physical Specifications
2801/2802 Power Analyzer User Guide Appendix A - Physical Specifications General Note: Specifications subject to change without notice. Environment Operating: 0°C to 55°C, <95% RH non-condensing Storage: -20°C to 70°C, non-condensing. Altitude Equivalent Atmospheric pressures and air densities from 1000ft below sea level to 15000ft above sea level. - Page 147 Appendix A - Physical Specifications...
-
Page 148: Appendix B - Measurement Specifications
Appendix B - Measurement Specifications Appendix B - Measurement Specifications Autorange When enabled, continuously automatically selects the best range to produce the highest accuracy results for the applied signal on each input independently. Changes to a higher range take <10ms per range, changes to a lower range take less than 1 cycle of the minimum frequency per range. -
Page 149: Non-Harmonics
Appendix B - Measurement Specifications Non-Harmonics Made over the greater of 5ms or 1 cycle of input signal. Measurements are made without intervening non-measurement periods of time between measurements (except when making a range change or when making a significant change to the sampling rate). Harmonics Made over the greater of 5ms or 4 cycles of input signal (2 cycles for fundamental frequencies less than 5Hz). -
Page 150: Result Averaging
2801/2802 Power Analyzer User Guide Result Averaging All final results may be averaged using a 2-pole filter with a user selectable time constant of between 10ms and 5s. Input Sampling All inputs within same channel are always sampled simultaneously. Sampling is short-term quasi-randomly dithered by up to 0.5% and long-term synchronized to the selected input signal to within 0.001%. -
Page 151: Startup Charts
Appendix B - Measurement Specifications Startup Charts Most results are available as a startup chart. The chart data is collected at intervals of 1/1024 of the user set overall startup period. Data is combined into the startup chart as the average or the maximum value (as applicable) between each collection interval. - Page 152 2801/2802 Power Analyzer User Guide Turn On Phase : Within 1° + 20us of the commanded turn on phase (if applicable). On Voltage Loss : <0.1Ω after the defined inrush period, <3Vpk during the defined inrush period. Off Leakage :...
- Page 153 Appendix B - Measurement Specifications...
-
Page 154: Appendix C-Input & Target Specifications
2801/2802 Power Analyzer User Guide Appendix C-Input & Target Specifications Voltage Input Specifications Ω || 25pF Input Burden 1MΩ || 10pF between terminals, >10 Voltage Lo terminal to ground Ranges 850V (2000Vpk) 450V (675Vpk 135V (200Vpk) 50V (80Vpk) 20V (30Vpk) Max. - Page 155 Appendix C-Input & Target Specifications Peak Accuracy Filtered (20kHz) : RMS accuracy + 50mV + 0.01% of peak range Unfiltered : RMS accuracy + 200mV + 0.02% of peak range. Crest Factor Accuracy Filtered (20kHz) : (50mV + 0.01% of peak range) /RMS value.
- Page 156 2801/2802 Power Analyzer User Guide Scaling Measurements may be scaled by a user-entered factor of between 0.001 and 10000. Max. External Offsets of up to 1A may be compensated for on the DC Offset 1A - 100A ranges, 20mA on the 15mA - 500mA ranges, compensation is performed at the input prior to range selection.
-
Page 157: Transducer (15V) Input Specifications
Appendix C-Input & Target Specifications Transducer (15V) Input Specifications Input Burden 50kΩ || 10pF, shield grounded via 50Ω Ranges 15V (35Vpk) 5V (12.5Vpk) 1.5V (3.5Vpk) 0.5V (1.25Vpk) 0.15V (0.35Vpk) Max. Input 70Vrms, 200Vpk continuous (any range) Scaling Measurements may be scaled by a user entered factor of between 0.001 and 10000. -
Page 158: Power Factor Specifications
2801/2802 Power Analyzer User Guide Temperature Effects Add 0.0065% of reading per °C when operating more than 5°C from the calibration temperature (no effect on relative harmonics). Power Factor Specifications Non-Harmonic (Watts Error) + 0.01% + (Voltage Accuracy) + Accuracy (Current Accuracy) –... - Page 159 Appendix C-Input & Target Specifications Factor caused by distortion and noise has negligible affect on the accuracy of Watts. Temperature Effects Add the Voltage temperature effects and the current temperature effects for the required input method (see above). Use as a percentage of Watts. VAR Specifications Accuracy Add Power Accuracy (% of VAR) and VAR Error...
-
Page 160: Figure 73. Ac Voltage, Autorange
2801/2802 Power Analyzer User Guide Figure 73. AC Voltage, Autorange... -
Page 161: Figure 74. Ac Voltage, Fixed Range, Low Frequency
Appendix C-Input & Target Specifications Figure 74. AC Voltage, Fixed Range, Low Frequency... -
Page 162: Figure 75. Ac Voltage, Autorange, High Frequency
2801/2802 Power Analyzer User Guide Figure 75. AC Voltage, Autorange, High Frequency... -
Page 163: Figure 76. Ac Voltage, Fixed Range, High Frequency
Appendix C-Input & Target Specifications Figure 76. AC Voltage, Fixed Range, High Frequency... -
Page 164: Figure 77. Ac Current, Autorange, Low Frequency
2801/2802 Power Analyzer User Guide Figure 77. AC Current, Autorange, Low Frequency... -
Page 165: Figure 78. Ac Current, Fixed Range, Low Frequency
Appendix C-Input & Target Specifications Figure 78. AC Current, Fixed Range, Low Frequency... -
Page 166: Figure 79. Ac Current, Autorange, High Frequency
2801/2802 Power Analyzer User Guide Figure 79. AC Current, Autorange, High Frequency... -
Page 167: Figure 80. Ac Current, Fixed Range, High Frequency
Appendix C-Input & Target Specifications Figure 80. AC Current, Fixed Range, High Frequency... -
Page 168: Figure 81. Dc Voltage, Autorange
2801/2802 Power Analyzer User Guide Figure 81. DC Voltage, Autorange... -
Page 169: Figure 82. Dc Voltage, Fixed Range
Appendix C-Input & Target Specifications Figure 82. DC Voltage, Fixed Range... -
Page 170: Figure 83. Dc Current, Autorange
2801/2802 Power Analyzer User Guide Figure 83. DC Current, Autorange... -
Page 171: Figure 84. Dc Current, Fixed Range
Appendix C-Input & Target Specifications Figure 84. DC Current, Fixed Range... -
Page 172: Figure 85. Ac Voltage (Transducer), Autorange, Line Or Lf Measurements
2801/2802 Power Analyzer User Guide Figure 85. AC Voltage (Transducer), Autorange, Line or LF Measurements... - Page 173 Appendix C-Input & Target Specifications Figure 86. AC Voltage, (Transducer), Fixed Range, Line or LF Measurements...
-
Page 174: Figure 87. Ac Voltage, (Transducer), Autorange, Hf Measurements
2801/2802 Power Analyzer User Guide Figure 87. AC Voltage, (Transducer), Autorange, HF Measurements... -
Page 175: Figure 88. Ac Voltage, (Transducer), Fixed Range, Hf Measurements
Appendix C-Input & Target Specifications Figure 88. AC Voltage, (Transducer), Fixed Range, HF Measurements... -
Page 176: Figure 89. Dc Voltage, (Transducer), Autorange
2801/2802 Power Analyzer User Guide Figure 89. DC Voltage, (Transducer), Autorange... -
Page 177: Figure 90. Dc Voltage, (Transducer), Fixed Range
Appendix C-Input & Target Specifications Figure 90. DC Voltage, (Transducer), Fixed Range... -
Page 178: Figure 91. Power, Autorange
2801/2802 Power Analyzer User Guide Figure 91. Power, Autorange... -
Page 179: Figure 92. Power, Fixed Range
Appendix C-Input & Target Specifications Figure 92. Power, Fixed Range... - Page 180 2801/2802 Power Analyzer User Guide Figure 93 VAR vs. Frequency...
- Page 181 Appendix C-Input & Target Specifications Figure 94. Watts vs. Frequency...
- Page 182 2801/2802 Power Analyzer User Guide Figure 95. Power Factor vs. Frequency...
Need help?
Do you have a question about the Xitron 2801 and is the answer not in the manual?
Questions and answers