
Related Manuals for TSI Quest EDGE EG-4P


Summary of Contents for TSI Quest EDGE EG-4P
- Page 1 THE EDGE PERSONAL NOISE DOSIMETER MODEL EG-4P WITH (OPTIONAL) BLUETOOTH WIRELESS USER MANUAL...
- Page 2 The Edge Personal Noise Dosimeter Model EG-4P User Manual...
-
Page 3: Manual History
Manual History Revision Date July 2019... - Page 4 (This page intentionally left blank) The Edge Personal Noise Dosimeter Model EG-4P User Manual...
-
Page 5: Warranty
Warranty Part Number 6013118 / Revision A ©TSI Incorporated / 2019 / All rights reserved. Copyright Address TSI Incorporated / 500 Cardigan Road / Shoreview, MN 55126 / USA Fax No. 651-490-3824 technical.services@tsi.com E-mail Address Limitation of Warranty Seller warrants the goods, excluding software, sold hereunder, under normal use and service as described in the operator's manual, to be free from defects in workmanship and material for and Liability 12 months, or if less, the length of time specified in the operator's manual, from the date of... - Page 6 Knowing that inoperative or defective instruments are as detrimental to TSI as they are to our Service Policy customers, our service policy is designed to give prompt attention to any problems. If any malfunction is discovered, please contact your nearest sales office or representative, or call TSI’s Customer Service department at 1-800-680-1220 (USA) or (651) 490-2860.
-
Page 7: Table Of Contents
Contents MANUAL HISTORY ................. III WARRANTY ..................... V CONTENTS .................... VII SAFETY INFORMATION ................ XI Labels ....................xi Description of Caution/Warning Symbols ......... xii Caution ..................xii Warning ..................xii Caution or Warning Symbols ............xii Getting Help ..................xiii CHAPTER 1 INTRODUCTION ............. - Page 8 Views on the Edge ................3-3 Definitions of Data Log Values and Views ........3-4 Edge Measurement Descriptors/Variants ........3-6 Docking ................... 3-7 Communicating and Downloading Data ........3-7 Customizing Set-Up Parameters in Detection Management Software ..................3-9 Dosimeter Setting ................ 3-9 Display Setting ................
- Page 9 User Interface ................. A-3 Display ..................A-3 Keypad ..................A-3 EdgeDock1 and EdgeDock5 ............A-3 Physical Attributes of EdgeDock1 and EdgeDock5 ..... A-4 Measurements ................A-4 Edge Block Diagram ............... A-7 APPENDIX B GLOSSARY OF TERMS..........B-1 APPENDIX C MEASUREMENT EQUATIONS ........C-1 APPENDIX D RADIO APPROVALS PAGE .........
- Page 10 (This page intentionally left blank) The Edge Personal Noise Dosimeter Model EG-4P User Manual...
-
Page 11: Safety Information
Safety Information This section gives instructions to promote safe and proper handling of The Edge Personal Noise Dosimeter Model EG-4P. W A R N I N G Protection provided by the equipment will be impaired if not used in a manner specified by the manufacturer. -
Page 12: Description Of Caution/Warning Symbols
D e s c r i p t i o n o f C a u t i o n / W a r n i n g S y m b o l s Appropriate caution/warning statements are used throughout the manual and on the instrument that require you to take cautionary measures when working with the instrument. -
Page 13: Getting Help
G e t t i n g H e l p To obtain assistance with this product or to submit suggestions, please contact Customer Service: TSI Incorporated 500 Cardigan Road Shoreview, MN 55126 U.S.A. Fax: (651) 490-3824 (USA) Fax: 001 651 490 3824 (International) Telephone: 1-800-680-1220 (USA) or (651) 490-2860 International: 001 651 490 2860 E-mail Address:... - Page 14 (This page intentionally left blank) The Edge Personal Noise Dosimeter Model EG-4P User Manual...
-
Page 15: Chapter 1 Introduction
C H A P T E R 1 Introduction D o s i m e t r y Measuring noise in the workplace is an important element of hearing conservation programs and noise reduction programs. With a noise dosimeter, you can assess and determine a worker’s daily exposure to noise levels. -
Page 16: Noise Dosimeter
N o i s e D o s i m e t e r What is a noise dosimeter and how does it compute measurements? Essentially, a noise dosimeter is composed of the following: a microphone with a preamplifier, a weighted network, fast or slow response time, an internal clock, calculator, and memory to store logged data. -
Page 17: Range Of Sound
R a n g e o f S o u n d Sound pressure is measured in decibels, or tenths of a Bel. Sound pressure level is indicated as dB SPL. Since the human ear can detect sounds with an extensive range of amplitude, a decibel scale is used to simplify the measurement results. -
Page 18: Applications Of The Edge
A p p l i c a t i o n s o f t h e E d g e The Edge has a cable-free, mounted microphone that converts sound pressure into an electrical signal. This signal is conditioned, monitored, and integrated over time in order to provide a host of automatically calculated values that can be used in occupational and environmental noise assessments. -
Page 19: Noise Assessment Steps
N o i s e A s s e s s m e n t S t e p s 1. Perform a task-based work flow analysis of unacceptable “noisy” areas and list regulations/codes you will follow. Observe facility/areas and jot down areas of concern ... -
Page 20: The Edge Model
T h e E d g e M o d e l The “EG-4P” model features two virtual dosimeters with data logging. Once the parameters are set and saved in the dosimeter, you can monitor two different dosimeters by a single press of the Enter key. This will toggle you between the two dosimeters. -
Page 21: Chapter 2 Getting Started
C H A P T E R 2 Getting Started This chapter is designed to guide you through basic information to begin logging your studies. C h e c k i n g t h e E q u i p m e n t If your instrument was sent to you in a storage case, you will want to remove all the packaging and acquaint yourself with the following equipment so you can quickly get started with your noise studies. -
Page 22: Turning On
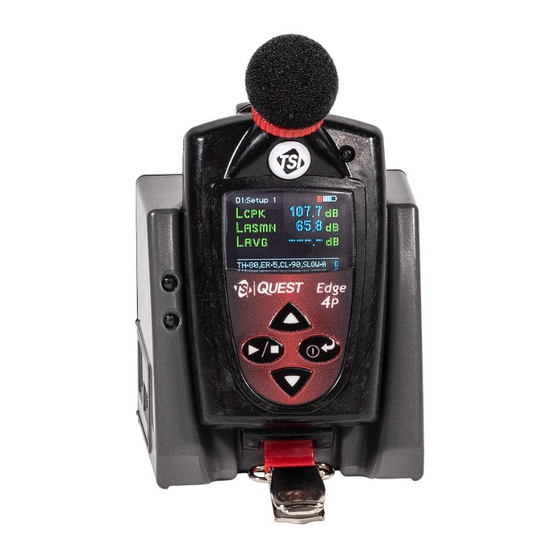
T u r n i n g O n 1. To turn on the Edge, press the on/off and enter button. The Edge splash screen (see Figure 2-3 for an example) will appear indicating the model (i.e. “EG-4P”) and firmware version. The screen will be in the measurement view. -
Page 23: Led Indicator
LED Indicator There is a three-color LED indicator on the Edge, located to the right of the TSI logo which includes Red, Amber, and Green. Table 2-1 identifies when and why the LED indicator color will appear. NO T E The LED indicator can be disabled via DMS (see section, “Dose indicator... -
Page 24: Turning Off
T u r n i n g O f f 1. Press and hold the on/off and enter button. “3, 2, and 1” countdown will appear as the dosimeter is powered off. NO T E To halt the power off mode, let go of the on/off enter button. D i s p l a y a n d K e y p a d The keypad is used to run and stop your studies, view your measurement values, and power on and off the dosimeter. -
Page 25: Tsi Detection Management Software
T S I D e t e c t i o n M a n a g e m e n t S o f t w a r e TSI Detection Management Software (DMS) is a software application ® designed by TSI that runs under the Windows operating system. -
Page 26: Docking Station Components
Docking Station Components The table below explains the EdgeDock1 or EdgeDock5 LED indicators, power connector, USB connector, and contact pins. Table 2-2 EdgeDock1 and EdgeDock5 components Docking station components Explanation Identifies if the dosimeter is “charging” or “fully Charging indicator charged”. -
Page 27: Powering Edgedock1 Or Edgedock5
Powering EdgeDock1 or EdgeDock5 Powering EdgeDock1 or EdgeDock5 1. Assemble the charger adapter and plug adapter as illustrated in Figure 2-6. (It will be the same process for an EdgeDock5.) 2. Plug the charger adapter directly into the wall (electrical wall plate). 3. -
Page 28: Mounting The Docking Station To A Wall
Backside of Edge EdgeDock1 Open cavity & Hook contacts Contacts Slides into “Hook” of EdgeDock. The Dosimeter LED contacts will align to dock each other. Docking station Docked Figure 2-8 Docking the Edge with a Single and 5-bay Docks Mounting the Docking Station to a Wall The docking station is equipped with two single screw slots in case you wish to mount the docking station to the wall. -
Page 29: Storing The Dosimeter
Storing the Dosimeter The best place to keep the dosimeter is on a powered ON docking station. You may safely leave it docked there indefinitely. You may disconnect the computer USB cable to move your laptop or computer any time you are not using the DMS software. Additionally, if the dosimeter is docked and stored on the docking station when the docking station is powered off, it will still draw a small amount of battery power from the dosimeter. - Page 30 (This page intentionally left blank) 2-10 The Edge Personal Noise Dosimeter Model EG-4P User Manual...
-
Page 31: Chapter 3 Setting Up The Edge Via Detection Management Software
C H A P T E R 3 Setting up the Edge via Detection Management Software N o i s e S t u d i e s The EG-4P model comes equipped with two customizable user setups. You have the option to customize the parameters for threshold values, exchange rate values, an upper limit value, and a criterion level. -
Page 32: Understanding What Data Is Stored
U n d e r s t a n d i n g W h a t D a t a i s S t o r e d When you are running noise dosimetry studies, there are two types of data stored on the dosimeter which include the summary data and time history (or Logged) data. -
Page 33: Logging
Logging EG-4P model only logs at one minute intervals and includes the following measurements: Meter 1 logs Lavg/Leq, Lcpk, and L ASMX Meter 2 logs Lavg/Leq If the dosimeter runs for one hour, then it will log 60 Lavg/Leq results, and 60 L /Lcpk levels. -
Page 34: Views On The Edge
Definitions of Data Log Values and Views To set up the Edge and work with noise-level data, you will want to have a good understanding of the terms listed in Table 3-1. NO T E The following table is based on A-weighted, slow measurements. Thus, if you choose A or C-weighted with Fast or Slow response the measurement values will change on the display (i.e., you selected sound pressure level with C-weighting with Fast response, it will... - Page 35 Views on the EDGE Explanation Time-weighted average—is the sound level (in dB) that is accumulated for any time period but with its average level computed over an 8-hour period. TWA is usually measured with A-weighting, Slow response, and a 5 dB exchange rate.
-
Page 36: Edge Measurement Descriptors/Variants
Views on the EDGE Explanation Memory storage symbol— EG-4P: The EG-4P model displays the total memory storage remaining in hours and minutes. For example, if it displays the memory symbol 181:50 this represents 181 hours and 50 minutes of memory storage remaining on the dosimeter. -
Page 37: Docking
D o c k i n g Communicating and Downloading Data By using your docking station, USB cable, software, and your dosimeter, you can quickly communicate between the software and the dosimeter. There are two methods for communicating which are: ... - Page 38 4. For first time use of a docking station, Welcome to the found new hardware wizard will appear (see Figure 3-6). Select No and press Next through the remaining wizard. At the end of the wizard, press Finish. This will install the hardware components associated with your EdgeDock1 and/or EdgeDock5.
-
Page 39: Customizing Set-Up Parameters In Detection Management Software
C u s t o m i z i n g S e t - U p P a r a m e t e r s i n D e t e c t i o n M a n a g e m e n t S o f t w a r e Customizing and saving setups are performed via Detection Management Software (DMS). - Page 40 2. When Meter 1 and Meter 2 settings are “enabled”, this will log (for EG-4P model only) two different setups simultaneously. Typically, users will set the meter 1 and meter 2 with different regulatory or local standards (such as EU directive and OSHA). 3.
-
Page 41: Display Setting
Dosimeter Name Field settings for the *Note: Refer to Glossary for more detailed Edge information. Setup name (Optional field) A setup name may be entered into the Meter 1 and/or Meter 2 fields. When set, it appears on the top of Edge’s display (example setup names: OHSHA, MSHA, EU directive). -
Page 42: Security Setting
NO T E “OFF” indicates that no item/parameter is selected. 4. To set the display features (see 5), save and send to the Edge (for “Saving and Sending/Setting more details see Configurations” saving and sending configurations”.) Figure 3-9 Edge Display Screen Security Setting The security setting is a type of “locking”... -
Page 43: Auto Run Setting
Figure 3-10 Edge Security Setting Screen Auto Run Setting With the Edge auto run setting, you may program up to two auto start and auto stop configurations when start date and duration parameters are enabled. This may be useful if you want to pre-set the instruments to run and stop for a specific time period, such as a week-long study. -
Page 44: Firmware Update
Figure 3-11 Edge Auto Run Screen Firmware Update Edge firmware updates are performed in DMS when the instruments are docked, communicating, and the update key is selected. Please follow the steps below prior to updating your Edge(s). NO T E This feature enables you to update all of your docked Edges (when powered on and not in run mode). -
Page 45: Saving And Sending/Setting Configurations
Figure 3-12 Edge Firmware Update Screen Saving and Sending/Setting Configurations With the Edge, there are saved setup profiles used to quickly access and apply to The Edge(s). Below explains how to save configuration settings in DMS and how to send/set to the instrument. NO T E If you want to only send the setup, skip to step 3. - Page 46 Figure 3-13 Saving and Sending Edge Setups Screen 3-16 The Edge Personal Noise Dosimeter Model EG-4P User Manual...
-
Page 47: Chapter 4 Running And Operating Your Dosimeter
C H A P T E R 4 Running and Operating your Dosimeter The focus of this chapter is to discuss the procedures for running and operating the Edge and includes positioning, calibrating, and viewing the Edge measurements. O v e r v i e w o f R u n n i n g a S t u d y The list below is a brief overview of the steps for running a study. -
Page 48: Positioning The Edge On Your Shirt
Positioning the Edge on your Shirt Depending on what accessories you ordered with the Edge, you may have either clips on the top and bottom of the dosimeter or some other “Technical type of mounting device. (Refer to Chapter 6, Support”). -
Page 49: Calibrating
Checking Battery Power 1. The battery indicator icon (located at the top right of your screen) gives an approximation of battery life and is always present. If the battery indicator is half shaded, this illustrates you have approximately 30 hours of battery life remaining. ... - Page 50 NO T E Ensure the adapter ring is inserted into the mouth of the calibrator before you slide the Edge into the cavity. 4. Turn on the calibrator and ensure parameters are set to 114 dB and 1000 Hz. (See calibration manual for operation details.) CAL”...
-
Page 51: Resetting The Dosimeter
Resetting the Dosimeter The Edge can be reset through the dosimeter keypad or via Detection Management Software. The steps below outline how to reset your dosimeter. Reset 1. Ensure the meter is Off. 2. Turn the meter on by pressing the on/off enter button. -
Page 52: Setting Contrast On Dosimeter
Setting Contrast on Dosimeter Contrast 1. Ensure the meter is Off. 2. Turn the meter on by pressing the on/off/enter button. 3. When the splash screen appears, press and hold the run/stop and on/off enter buttons (see Figure 4-5 for splash screen). 4. -
Page 53: Running Studies
R u n n i n g S t u d i e s With a couple pushes on the keypad buttons, you will be running and viewing your study(ies). Following your study(ies), you can load the data/files into DMS to manipulate, analyze, save, and create reports (See Chapter 5 for viewing your logged data in Detection Management... -
Page 54: Indicators/Icons On The Display
Indicators/Icons on the Display The Edge is equipped to notify you of operational/status updates. These indicators (or alert notices) are located on the top right-hand side of the screen. Table 4-1 explains the function of each indicator. Table 4-1 Indicators (i.e., run, stop, battery, and overload) Indicator Icon Explanation... -
Page 55: Locking Or Securing Your Dosimeter During Run
Locking or Securing your Dosimeter During Run As explained previously under DMS set-up parameters, the security or lock feature is designed to lock the meter during run to ensure the study will not be stopped unless the lock feature is disabled. (Setting this “Security feature is programmed via DMS. - Page 56 (This page intentionally left blank) 4-10 The Edge Personal Noise Dosimeter Model EG-4P User Manual...
-
Page 57: Chapter 5 Viewing Your Studies In Detection Management Software
C H A P T E R 5 Viewing your Studies in Detection Management Software The focus of this chapter is to discuss how to view your studies with the TSI Detection Management Software (DMS). The first section explains how to retrieve your studies from the dosimeter, and the subsequent sections will then walk you through viewing, organizing, and customizing your studies. - Page 58 3. Power on the Edge by pressing the button. NO T E The Edge will only download and communicate when stopped, as indicated by icon on the top of the screen. 4. In DMS software’s start screen, choose Download Figure 5-2 Detection Management Software Start Screen 5.
-
Page 59: Viewing Data And Data Finder Page
7. Click button. In the status field, it will state download is successful. Then, a clear the memory prompt will appear. Click yes to clear the memory or click no if you want to save the data on the dosimeter. -
Page 60: Report View
Figure 5-5 Data Finder Page with the Downloaded Data R e p o r t V i e w button provides a quick link to view/print the Edge data. To customize the data, refer to the next session, panel view page. ... -
Page 61: Panel Layout View (Charts/Graphs)
P a n e l L a y o u t V i e w ( c h a r t s / g r a p h s ) When you are in the data finder page (see above), select either the Analyze button or double-click on a session/study to view the data in charts and graphs as displayed in Figure 5-7. -
Page 62: Quick Tips With Panels (Charts/Graphs)
Quick Tips with Panels (charts/graphs) To stretch the graph, click on one the corner’s edge of a chart or table and drag the mouse. The graph will expand and widen (depending on how you drag your mouse). To move the graph, click drag and drop to the appropriate panel position. -
Page 63: Chapter 6 Additional Product Support
C H A P T E R 6 Additional Product Support L E D I n d i c a t o r : D i s a b l e / E n a b l e Follow the instructions below to turn off the LED indicator. ... - Page 64 Attaching/Detaching the Windscreen and Microphone 1. First, unscrew the windscreen by turning the red ring (not the foam!) in a counterclockwise direction. NO T E Be careful not to remove the microphone or the microphone grid which can damage the microphone. 2.
-
Page 65: Chapter 7 Maintenance And Service
C H A P T E R 7 Maintenance and Service Maintenance and Service requires a service technician with skills in both electronics and mechanics. Contact an applications engineer with technical or applications questions according to the Technical Contacts section below. T e c h n i c a l C o n t a c t s ... -
Page 66: Returning For Service
R e t u r n i n g f o r S e r v i c e and complete the on-line “Service Visit our website at http://rma.tsi.com Request” form or call TSI at 1-800-680-1220 (USA) or (651) 490-2860, or 001 651 490-2860 (International) for specific return instructions. -
Page 67: Appendix A Specifications
A P P E N D I X A Specifications **All specifications are subject to change without notice. S t a n d a r d s Meets requirements of: ANSI S1.25, IEC61252 Standards for Personal Sound Exposure Meters. ... -
Page 68: Electrical Characteristics
(perpendicular to diaphragm) Note this is about 8.3 dB below the linearity range lower limit of 70 dB. There are no limitations on the use of the Edge EG-4P personal sound exposure meter due to vibration. Magnetic Field... -
Page 69: User Interface
EMC & ESD The sound level at which the personal sound level Immunity meter conforms to the Electromagnetic and electrostatic compatibility requirements and test procedures is 85 dBA, with no cables used or needed. On the docking station(s), it also conforms. -
Page 70: Physical Attributes Of Edgedock1 And Edgedock5
Physical Attributes of EdgeDock1 and EdgeDock5 Indicates EdgeDock1 or EdgeDock5 is “powered LED amber on”. (Lower of the two shown LEDs). indicator Signifies status of charging. Flashing red indicates LED Red indicator and charging. Solid green indicates charging is complete. LED Green indicator 2.75”... - Page 71 Measurement Parameters and Specs Exchange Rate 3 dB, 4 dB, or 5 dB (ER) Peak Range 110 dB to 143 dB C or Z weighting Peak Weighting Pulse Range @ 1 ms 4 kHz tone-burst: 53 dB @ ±1.5 dB Tolerance: 10 ms 4 kHz tone-burst: 53 dB @ ±0.7 dB...
- Page 72 Measurement Parameters and Specs Acoustic test To determine the relative frequency response the method sound exposure meter was suspended from the ceiling using strings with the microphone face perpendicular to the sound source. (Field) Calibration When performed, valid prior to the start of the Pre-calibration study.
-
Page 73: Edge Block Diagram
E d g e B l o c k D i a g r a m Analog Board Specifications... - Page 74 (This page intentionally left blank) The Edge Personal Noise Dosimeter Model EG-4P User Manual...
-
Page 75: Appendix B Glossary Of Terms
A P P E N D I X B Glossary of Terms Background Noise, Background noise can cause considerable error in measurement when its level is high relative to the level of a noise source of interest. If you can make effects of measurements both with and without the contribution of a noise source of interest, you can mathematically subtract the background noise from the combined... - Page 76 Combining Noise Because sound levels are measured in decibels they cannot be simply added sources together. A sound level of 90 dB plus 90 dB does not yield 180 dB but rather 93 dB. The procedure for mathematically determining a combined level of sound from independent measurements made for two noise sources is given below.
- Page 77 Dose Related to the Criterion Level, a dose reading of 100% is the maximum allowable exposure to accumulated noise. For OSHA, 100% dose occurs for an average sound level of 90 dB over an 8 hour period (or any equivalent exposure). By using a TWA reading rather than the average sound level, the time period is no longer explicitly needed.
- Page 78 Lavg (Average Lavg is the average sound level measured over the run time. This becomes a bit Level) confusing when thresholds are used. Any sound below the threshold is not included in this average. Remember that sound is measured in the logarithmic scale of decibels therefore the average cannot be computed by simply .adding the levels and dividing by the number of samples.
- Page 79 Random Incidence This only applies to Class/Type 1 microphones. Measurements made in an area (microphone) where sound waves are coming from all directions, including reflections and diffractions. When the dosimeter is being used as a sound level meter in an area where reflections and diffractions from nearby objects are present, use the Random Incidence Corrector with the microphone, and angle the microphone at approximately 70 degrees.
- Page 80 TWA (Time The time weighted average always averages the sampled sound over an 8-hour Weighted Average) period. TWA starts at zero and grows. The TWA is less than the Lavg for a duration of less than eight hours, exactly equal to the Lavg at eight hours, and grows higher than Lavg after eight hours.
-
Page 81: Appendix C Measurement Equations
A P P E N D I X C Measurement Equations The following equations are used in the Edge calculations. Some of the terms used in these equations are explained above in the “Glossary of Terms” appendix. RTIME ... - Page 82 (This page intentionally left blank) The Edge Personal Noise Dosimeter Model EG-4P User Manual...
-
Page 83: Appendix D Radio Approvals Page
A P P E N D I X D Radio Approvals Page E u r o p e This device meets the requirements of the Telecommunications Directive RED. 2014/53/EU: EN 300 328 v2.2.1 EN 301 489-1 v2.2.0 EN 301 489-17 v3.1.1 EN 62311:2008 U S A Contains Transmitter Module FCC ID: VPYLBZFY... -
Page 84: Industry Canada (Ic
I n d u s t r y C a n a d a ( I C ) W A R N I N G This device complies with Industry Canada license-exempt RSS standard(s). Operation is subject to the following two conditions: (1) this device may not cause interference, and (2) this device must accept any interference, including interference that may cause undesired operation of the device. -
Page 85: Index
Index Definition of data log value, 3-4 Download, 3-7 Definition of data log view, 3-4 Downloading data, 5-1 Attaching Detection management software, 1-2 charger adapter with plug adapter, Display, 2-4 Display screen, 3-12 Edge dosimeter, 4-2 Display setting, 3-11 positioning, 4-2 Auto run Display view Edge Dock... - Page 86 Run mode, 4-8 Run time, 3-5 Hearing conservation, B-3 On/Off, 2-4 Running a study Heartbeat, 6-1 Options menu, 4-5, 4-6 overview, 4-1 Heartbeat enable, 3-10 Overload, 4-8 Running studies, 4-7 Help, xiii Hertz, B-3 Packing instructions, 7-2 I–J Safety, xi Panel layout view, 5-5 Saving configurations, 3-15 Indicators on display, 4-8...
- Page 87 User interface Viewing studies in DMS, 5-1 Warranty, v display, A-3 Views, 3-3 Weighting, 3-5 keypad, A-3 Virtual dosimeters, 1-6 Weighting (A, C, Z, etc.), B-6 Windscreen, 2-1, 2-4, 4-2, B-6 W–X–Y–Z replacing, 6-1 View, 2-2 Warning, xi Viewing data, 5-3 description, xii Viewing measurements on display, description of symbol, xii...
- Page 88 TSI Incorporated – Visit our website www.tsi.com for more information. Tel: +1 800 680 1220 India Tel: +91 80 67877200 Tel: +44 149 4 459200 China Tel: +86 10 8219 7688 France Tel: +33 1 41 19 21 99 Singapore Tel: +65 6595 6388 Germany Tel: +49 241 523030...
Need help?
Do you have a question about the EDGE EG-4P and is the answer not in the manual?
Questions and answers
what is the LAS set point
The LAS set point for the TSI EDGE EG-4P is the sound pressure level, which is the basic measure of noise loudness expressed in decibels. It is based on A-weighted, slow measurements.
This answer is automatically generated