Table of Contents
Advertisement
Quick Links
Advertisement
Table of Contents

Related Manuals for TSI Quest Soundpro SE Series


Summary of Contents for TSI Quest Soundpro SE Series
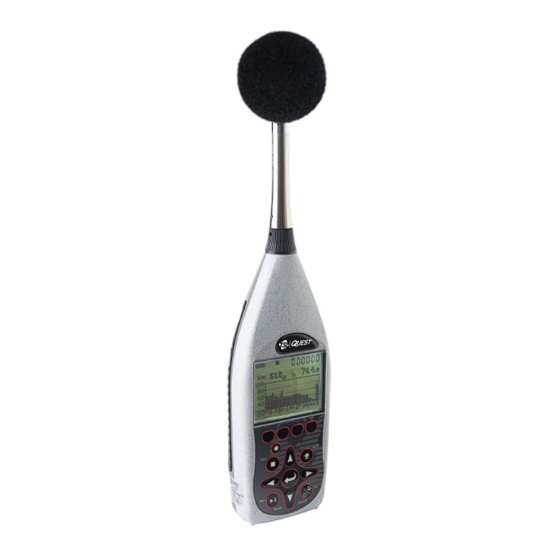
- Page 1 SOUNDPRO ® SOUND LEVEL METERS SERIES SE/DL USER MANUAL...
-
Page 3: Dangers, Warnings, Cautions & Battery
SOUNDPRO ® SOUND LEVEL METERS SERIES SE/DL Dangers, Warnings, Cautions & Battery DANGER! Failure to observe the following procedures may result in serious personal injury Not for use in explosive or hazardous locations. This product is not intrinsically safe. WARNING! Failure to observe the following procedures could damage the instrument ... - Page 4 Intended Use: Octave bands (This page intentionally left blank)
-
Page 5: Table Of Contents
Table of Contents TABLE OF CONTENTS Navigating ............. 18 Dangers, Warnings, Cautions & Battery ....i Turning off ............... 18 Intended Use: ............. i Basic setups ............19 Introduction ............... 1 Changing microphone settings ......20 Models and options ..........1 Time and date ............ - Page 6 Table of Contents Communications ............ 46 Additional options ..........69 DMS/Serial ............47 Reverberation ............69 Mass Storage ............47 Reverberation time (RT60) ........ 69 Viewing real-time measurements remotely ..48 Reverberation (RT60) methods ......71 GPS ..............49 Interrupted noise ..........71 Impulse noise ............
- Page 7 Table of Contents Storing background noise/capture curve .... 96 Instrument noise ..........118 Applying captured curves for STI-PA testing ..98 Environmental effects .......... 118 Viewing Past Measurements ....... 101 Temperature ............118 Humidity .............. 118 Files ............... 101 User interface ............119 File directories ............
- Page 8 Table of Contents FIGURES 1-1: SoundPro Models SE and DL and Option 1 4-13: Digital-Out screen ........... 45 nd Option 2 ............1 4-14: QSP/Serial ............47 1-2: Octave bands............ 2 4-15: Mass Storage ..........47 1-3: Third Octave bands .......... 3 4-16: Log to Port ............
- Page 9 Table of Contents 6-16: Audiometric booth setup in the curves 7-3: File menu screen ........... 103 screen ............. 86 7-4: Data File screen ..........103 6-17: Curve results........... 88 7-5: Selecting past study data (review mode) ..104 6-18: Measurement type selection (STIPA) ..... 92 7-6: Viewing past data example ......
- Page 10 viii Table of Contents (This page intentionally left blank) SoundPro ® Sound Level Meters Models SE and DL...
-
Page 11: Introduction
CHAPTER Introduction Models and options Introduction The SoundPro SE and DL series of Sound Level Meters (SLM) from TSI are advanced instruments with highly adaptable characteristics. This manual explains the features and functions of all models in the series and points out distinctions between the models. Models and options There are twelve models in the SoundPro SE and DL series meters. -
Page 12: Frequency Resolution
Frequency resolution Octave bands Frequency resolution The sounds we hear are rarely pure tones at a single frequency but rather a mixture of frequencies of varying amplitudes. Some sounds, such as a whistle or a horn, have frequencies concentrated in relatively narrow regions of the audio spectrum, which ranges from approximately 20 Hz to 20,000 Hz. -
Page 13: Third-Octave Bands
Frequency resolution Third-octave bands Third-octave bands Each octave band can be divided into three adjacent bands called third-octave band. Because of the logarithmic relationship between adjacent bands, the center frequencies of third-octave bands differ from each other by 26%. For example, the center frequency of the next third-octave band above the 1000 Hz third-octave band is at 1260 Hz. -
Page 14: Analysis Type
Frequency resolution Analysis type Exact Center Names of Octave Names of Third-octave Bands (Hz) Frequency (Hz) Bands (Hz) 199.53 251.19 316.23 398.11 501.19 630.96 794.33 1000.0 1000 1000 1258.9 1250 1584.9 1600 1995.3 2000 2000 2511.9 2500 3162.3 3150 3981.1 4000 4000 5011.9... -
Page 15: Logging Explained
Logging explained The Display Logging explained Although you can view the current sound pressure level at any time that the instrument is operating (See “Bar Chart and Filtered Bar Chart”), most measurements are reported for data obtained over the entire course of a study or session. -
Page 16: Memory Card Slot
Physical Characteristics Hardware interfaces Memory card slot A Secure Digital (SD) removable memory card is shipped with each SoundPro SE/DL instrument. The card should always be in place when you are operating the instrument. More information about operating with the memory card can be found under “Memory card.” ... -
Page 17: Information Screen
Information screen Screen contents Information screen Every SoundPro SE/DL instrument describes its unique characteristics in its Information screen. In the Start screen, press ▲/▼ to select Unit Info then press . The Unit Info screen appears (Figure 1-5). Figure 1-5: The Unit Information screen Screen contents The lines indicated in Figure 1-7 will contain the following information. -
Page 18: Dms Start Page
Detection Management Software DMS DMS Start Page Some data can only be displayed in DMS. One example is logging data obtained when logging is enabled in an instrument equipped with that option (“Logging”). Another example is with the GPS function. When enabled the data is viewable in DMS. -
Page 19: Getting Started
CHAPTER Getting Started Checking the equipment Getting Started This chapter provides the basic information you need to “get up and go” essentially right out of the box, including getting your first glimpses of SPL. Checking the equipment If you received your instrument in a storage case, remove all the packaging and acquaint yourself with the equipment, so you can quickly get started. -
Page 20: Installing The Preamp
Microphone and accessories Installing the preamp Installing the preamp The preamplifier is detachable for storage purposes or if you want to connect an extension cable for distance monitoring. Connecting to the instrument Place the preamp connector over the mating connector at the top of the instrument. -
Page 21: Class/Type 1 And Class/Type 2 Instrument
Microphone and accessories Class/Type 1 and Class/Type 2 instrument Class/Type 1 and Class/Type 2 instrument The SoundPro Sound Level Meter is shipped with the Type 1 in a protective case with a serial number labeled on the side of the microphone. Similarly, the SoundPro instrument with the Class/Type 2 microphone is also shipped in a protective case. -
Page 22: Providing Power
Providing power Installing Batteries Providing power The instrument can be powered with internal batteries or from an external power source. There are two optional sources which include a universal power supply 9V/.66A 2.1 mm and an auto DC jack cable 12V. (See Optional Parts, in Appendix A for more details.) Installing Batteries The instrument requires four AA-sized batteries. -
Page 23: Battery Power Explained
Providing power Battery power explained Battery power explained The battery check screen is used to determine the battery/power status of the instrument. When operating on batteries, the grey area in each cell graphic indicates the charge on each cell (Figure 2-5). When operating on an external power source (see next section, “external power sources”), the external power will take precedence over batteries if installed. -
Page 24: Selecting Setup In The Start Screen
Providing power Checking or changing type Battery Check screen 1. Turn on the SoundPro SE/DL by pressing On/Off/ESC . You will be at the start screen. If turned on, ensure you are at the start screen by pressing On/Off/Esc repeatedly ... -
Page 25: Using Power Supply Or Auto Adapter
Turning on Using power supply or auto adapter Using power supply or auto adapter Auto If you obtained the optional Universal power supply 9V cable or the adapter Auto DC Jack 12 VDC adapter from TSI, plug them into their respective power sources and the other end into the Power jack of the instrument. -
Page 26: Start Screen And The Keypad
Turning on Start screen and the keypad Start screen and the keypad The Start screen is the first screen you see when you power on and the last screen you see when you shut down. This essential main screen is also used to navigate through the menu options. The keypad and soft keys are used to setup the instrument, run a study, stop a study, view your measurement values, and power on and off the meter. -
Page 27: Soundpro Functionality
SoundPro functionality The keypad explained SoundPro functionality The keypad explained The SoundPro SE/DL keypad consists of three general types of keys: soft keys, navigation keys and dedicated keys. Keypad Explanation 1. Display Used to view data, menus, and various indicators. 2. -
Page 28: Indicators Explained
Turning off Indicators explained Indicators explained Status information is provided by the instrument at the top of the display. Below is a summary of all of the indicators. Icon Significance Battery charge status. This icon shows the status/level of the batteries. A full battery indicates one of the following: externally powered ... -
Page 29: Basic Setups
CHAPTER Basic setups Turning off Basic setups This chapter covers the basic features and setups of SoundPro SE/DL Sound Level Meter that establish ® the instrument’s operating conditions. For information about the more advanced SoundPro SE/DL meter features and their setups, see Chapter 4, “Advanced setups.” For information on setting-up and measuring add-on features (Reverberation, STI-PA, or Curves), please see Chapter 6. -
Page 30: Changing Microphone Settings
Turning off Changing microphone settings Changing microphone settings Microphone settings This procedure applies only to Class/Type 1 models. 1. Turn on the SoundPro SE/DL meter by pressing On/Off/Esc If turned on, ensure you are at the start screen by pressing On/Off/Esc repeatedly ... -
Page 31: Time And Date
Turning off Time and date Time and date SoundPro SE/DL meter uses a 24-hour clock and specifies date by month and year. Changing time and date settings Turn on the SoundPro SE/DL meter by pressing On/Off/Esc If turned on, ensure you are at the start screen by pressing On/Off/esc ... -
Page 32: Measurement Type (Slm, 1/1, 1/3, Sti-Pa, Rt60)
Turning off Measurement type (SLM, 1/1, 1/3, STI-PA, RT60) Measurement type (SLM, 1/1, 1/3, STI-PA, RT60) The measurement type is easily selectable at the start screen via a soft key button. This is assessable at all times unless you are running a study. To change or set the measurement type, ensure the SoundPro meter is stopped as indicated by the stop ■... -
Page 33: Meter 1/Meter 2 Parameters (I.e. Response Time, Weighting)
Basic setups Turning off Meter 1/Meter 2 Parameters (i.e. response time, weighting) Setting up Meter 1 and Meter 2 parameter settings are changed through the soft keys and the Measure Set screen of the SoundPro Sound Level Meter. Setting up Meter 1 and/or Meter 2 parameters Ensure you are at the start screen. -
Page 34: Measurement Setup (For Community Noise)
Turning off Measurement setup (for community noise) Measurement setup (for community noise) The measure screen is used to select community noise settings for meter 1 only. Table 3-2 below explains the settings and options. Setting up community noise measurements (refer to figure 3-5 below) 1. -
Page 35: Measures Screen Explained
Turning off Measurement setup (for community noise) 7. When finished, press On/Off/Esc to exit the screen. The following table explains your selections in the Measures screen (Please see Appendix B, Glossary of Terms for more details.) Measurements Explanation L1-L4 (Exceedance) L1-L4 are types of exceedance levels. -
Page 36: C-A Measurement Settings
Turning off Measurement setup (for community noise) C-A measurement settings The C-A measurement is determined from concurrent measurements of the SPL by both meters. It can only be made if certain settings for Meter 1 and Meter 2 are compatible. If any incompatibility exists, the Lc-a selection in this screen will be marked N/A (Not Available). -
Page 37: Logging
Logging Logging options Logging Logging options If the logging option was purchased, you will have the following four types of measurement options: Average (AVG on the display), Peak, Maximum (MAX on the display), Minimum (MIN on the display). Figure 3-7: Logged Data Chart example ... -
Page 38: Setting Logging Options
Logging Setting logging options Setting logging options To set logging only options (Average, Peak, Maximum, and Minimum) Enabling or disabling logging options Ensure you are at the start screen. If turned on, repeatedly press On/Off/Esc until you return to the start screen (see ... -
Page 39: Setting Up Display Options
Setting up display options Setting logging options Press Enter to move to the data field. If it is Off and you want to set a percentage, press Enter repeatedly until a percentage appears. To disable, repeatedly press Enter until “Off” appears. To change the percentage, repeatedly press Up/Down ▲/▼to select a specific percentage. -
Page 40: Language
Setting up display options Language Language You can choose a different language for the displayed text. A change in language takes effect when you exit the Language screen. Changing the language Ensure you are at the start screen. If turned on, repeatedly press On/Off/ESC until you return to the start screen (see ... -
Page 41: Backlight
Setting up display options Backlight Backlight Typically, the SoundPro Sound Level Meter is shipped with the Backlight backlight setting enabled. With a quick press of the backlight button from the keypad, you can quickly turn on and turn off the backlight. The backlight feature has an optional timed setting for various second intervals ranging from 1 second to 60 seconds. -
Page 42: Contrast
Setting up display options Contrast Contrast The contrast adjustment affects all pixels in the LCD screen. Choose a level that looks best to you. NOTE: If the contrast level is set too high, icons and the RunTime clock in the Status Region of the display can be ghosted (visible in this display although they are not supposed to show). -
Page 43: Advanced Setups
CHAPTER Advanced setups Auto-Run Advanced setups This chapter covers the SoundPro models SE and DL features listed below, all of which provide ® capabilities beyond the essential ones required for basic model setup and basic sound measurement. For information about basic SoundPro models SE and DL features and setups, see Chapter 3, “Basic setups.” For information about the notation and navigation conventions that are used in these explanations, see Chapter 1, “Introduction.”... -
Page 44: Date Setting
Setting up auto-run Date setting Date setting A Date mode run wakes up the instrument from a powered down condition, runs the study, saves it, then powers down again and is only executable once. The parameters are selectable by specified dates and times with up to four programmable individual setups. -
Page 45: Setting Date Parameters For Auto-Run #1
Setting up auto-run Date setting 6. To set Date values, press Enter to move to the first field. To change the fields, press repeatedly Up/Down ▲/▼. To move between the day, month, and year fields, press the right/left arrows. Auto-Run #1 Indicates which 1-4 soft keys is being viewed or set... -
Page 46: Days Of Week Setting
Setting up auto-run Days of week setting Days of week setting The Days of the Week (DOW) setting is a pre-programmed weekly auto-run with specified days, start time, duration. You can pre-program two auto-on settings with Sunday through Saturday parameters, one specific start time, and a specified duration for each auto-on setting. -
Page 47: Auto-Run Shutdown Screen
Setting up auto-run Auto-run shutdown screen 8. To exit the screen, press On/Off/Esc repeatedly until you return to the main screen. Press and hold the On/Off/Esc to power off. Days field Auto-run #2 is programmed to run Monday –Thursday and Saturday Start time and duration Start time and duration... -
Page 48: Auto-Run Shutdown Screen Explained
Setting up auto-run Timed run setting Auto-run shutdown screen explained The Auto-Run Shutdown screen is a map of your auto-run settings. It identifies the mode, the activated setups in that mode (AR) and the order in which the setups will occur. If Auto-Run is enabled in the Date mode and more than two setups are activated, only the first two will be shown because of limited screen space. -
Page 49: Level-Triggered Auto-On Setting
Setting up auto-run Level-triggered auto-on setting Level-triggered auto-on setting The level-triggered screen contains meter 1 parameters which include a Filter mode, Frequency level, “Level On” and “Level Off” modes, and a specification for either run/stop or run/pause modes. Viewing or changing level-triggered mode From the start screen, press Up/Down ▲/▼to highlight Setup and press Enter Select Auto-Run by using Up/Down ▲/▼to highlight and press Enter to select. -
Page 50: Level Triggered Auto-On Settings Explained
Setting up auto-run Level-triggered auto-on setting Level- Triggered Explanation of Settings C. Source The source can be set to Meter 1, Meter 2, filters, curve, external trigger, timed run trigger mode, and a delay. which are explained below: Broadband: When selecting Meter 1 or Meter 2 for the triggering source, you then ... -
Page 51: Locking Setup Or Run Mode
Locking setup or run mode Setting secure run or secure setup (locking) 13. Press On/Off/Esc repeatedly to return to the start screen. When you are ready to run your study, press Run/Pause Locking setup or run mode The locking or security feature is designed to lock the SoundPro meter during a run to ensure the study will not be stopped unless the lock feature is disabled. -
Page 52: About Secure Setup
Locking setup or run mode Setting secure run or secure setup (locking) About Secure Setup Setup Mode security blocks access to setup screens while in stop mode. (NOTE: When in run mode, the SoundPro meter automatically blocks the user from changing settings to ensure the settings remain the same throughout the session.) Once enabled and the user selects setup, the Secure Setup mode prompt will appear and it prevents someone from changing settings until unlocked. -
Page 53: Adding Code For Secure/Lock Screen
Locking setup or run mode Setting secure run or secure setup (locking) 3. (Skip this step if securing setup and see step 4.) To set Secure Run Mode, press Enter and “0000” will appear. NOTE: If you want to set the code as “0000,” press Enter repeatedly until “enabled”... -
Page 54: Disabling Secure Run Or Secure Setup (Unlocking)
Locking setup or run mode Disabling secure run or secure setup (unlocking) Press On/Off/Esc repeatedly until the Start screen appears. This will Enable the Secure Setup (or locking setup). To unlock/unsecure Press lock soft key and then enter in code. Figure 4-12: Secure/lock setup prompt Disabling secure run or secure setup (unlocking) You can disable Setup Mode security only when the session is stopped. -
Page 55: Digital Outputs/Triggering
Digital outputs/Triggering Tracking runs Digital outputs/Triggering All digital output signals (also referred to as “Triggering”) appear on pins of the Auxiliary Port (“Auxiliary port”). Manage these digital outputs in the Ext-Trigger screen. Tracking runs The instrument can be configured to use a digital output to signal the start or end of a run. ... -
Page 56: Digital Outputs And Spl
Communications Digital outputs and SPL Digital outputs and SPL The instrument can also be configured to use a digital output to signal if the current SPL measurements exceeds a specified level. Managing SPL digital outputs (See Figure 4-13 above) ▲/▼... -
Page 57: Dms/Serial
Communications QSP/Serial QSP/Serial For QSP-II communications, USB should be set to “QSP/Serial” (Figure 4-14). The RS-232 channel should be turned off for low power consumption. Figure 4-14: QSP/Serial Mass Storage When the USB channel is set for Mass Storage mode, you will have direct access to the instruments SD card through programs such as “Windows file manager.”... -
Page 58: Viewing Real-Time Measurements Remotely
Communications Viewing real-time measurements remotely USB communications 1. If a session is running, stop it. ◄/► 2. In the Start screen, press to select Setup, then press . The Setup screen appears. 3. In the Setup screen, press the arrow keys to select Comm Set, then press and the Comm- Set screen appears. -
Page 59: Gps
Communications The SoundPro Sound Level Meter has the capability of embedding GPS information into study headers. To interface a GPS, you need a GPS receiver with RS-232 communications that conform to NMEA 0183 version 2 and the optional 053-729 Serial Cable. In many cases, a Male-Male DB-9 null modem connector will be required as well. -
Page 60: Viewing Gps Coordinates In Comm-Set Screen
Communications Other line - When the satellite signal is being received, there will be two data fields on this line that • give the instrument’s altitude and time, in that order. The altitude is given in meters above mean sea level. -
Page 61: Preparing To Measure And Running
CHAPTER Preparing to measure and running Virtual meters Preparing to measure and running This chapter explains the steps needed to prepare the SoundPro Sound Level Meter for measuring and ® how to run measurements. It will also show you sample measurement result screens and explain the contents of the screens. -
Page 62: Overview Of Running A Session/Study
Overview of running a session/study Meter 1/Meter 2 explained Overview of running a session/study The list below is a brief overview of the steps for running a study. Quick Help List 1. Turn the SoundPro Sound Level Meter on and check your battery power (see Chapter 1). 2. -
Page 63: Preparing To Measure
Preparing to measure Sessions and Studies Preparing to measure Sessions and Studies Before you begin running a session/study, there are a couple items to consider: Understanding sessions and studies Adjusting the measurement range before running a study Calibrating the instrument ... -
Page 64: Measurement Range
Preparing to measure Measurement range Measurement range You select the decibel range before running the first study in the session. Setting the measurement range helps keep the desired measurements within the linear range of operation. If you do not make an optimal range selection, low levels of sound can be hidden in the instrument noise (below the noise floor of the instrument), and high levels of sound can be distorted (the instrument is “overloaded”). -
Page 65: Calibrate
Calibrate Calibration screen Calibrate TSI recommends calibrating your Verifier before you run a STI-PA measurement and after to ensure highly accurate measurement results. The microphone should be calibrated before use for a number of reasons. First, the microphone is sensitive to humidity and pressure changes. Calibrating before taking measurements assures that your level measurements are accurate for the current environment. -
Page 66: Performing A Calibration
Calibrate Performing a calibration Performing a calibration Before beginning your calibration, ensure the calibrator has sufficient battery power to perform the calibration. Also, you will want to insert the “cal adapter” into the mouth of the calibrator. If the SoundPro Sound Level Meter has a windscreen, please remove. ... -
Page 67: Setting Pre-Cal Screen
Calibrate Performing a calibration From the Start screen, press the Cal soft key and the Cal screen will open. Select Calibrate by pressing ▲/▼ Arrows (if not selected) and press Enter to open the Pre-Cal screen. Switch On the Calibrator. Measurement value displayed graphically Measurement value... -
Page 68: Running A Session/Study
Running a session/study Performing a calibration Press On/Off/Esc key to exit the Cal screen. For a Post Calibration, ensure the SoundPro is in “Pause” mode. (Essentially, run a measurement and press the run/pause key.) The Pause indicator will appear at the top of the display.) Then repeat the Calibration steps above and press Enter to store the Post Calibration information. -
Page 69: Measurement Navigation
Measurement navigation Using soft keys in measurement screens NOTE: The Lookup soft key is used to change the measurement options. There are five selections which include: SPL, Leq, Lpk, Lmax, and Lmin. (See “Changing displayed measurement” for more information.) Measurement navigation You can navigate through the measurement screens by repeatedly pressing . -
Page 70: Analysis Type, Time Response And Weighting
Measurement navigation Using soft keys in measurement screens 2. Press the soft key to display the Selection Panel. The available measurements are arranged in a column, with the selected measurement marked. Selection Panel This appears when lookup soft key is pressed. -
Page 71: Measurement Screen Icons
Measurement screen icons Descriptor types Measurement screen icons The measurement screen descriptors and icons identify certain conditions that exist currently in the display. Press (Alternate Functions key) to toggle the contents of the Soft key Region until you see the Viewing Descriptors. When the Viewing Descriptors are displayed, an Alternate Functions icon appears below the battery icon. -
Page 72: Measurement Screens
Measurement screens Bar Chart and Filtered Bar Chart Measurement screens Bar Chart and Filtered Bar Chart The first screen you will see in a viewing area contains a bar chart for broadband or filtered measurements. For the bar chart screen, the amplitude of the displayed measurement is shown both graphically by the length of the bar and numerically below the bar. -
Page 73: Community Noise Screen
Measurement screens Community Noise screen Making changes to the Bar Chart or Filtered Bar Chart screen The Range - The scale, shown above the chart, is fixed and cannot be changed in the run or pause mode (or if you are viewing past studies). If the session is in stop mode (or closed), press ▲/▼... -
Page 74: Dosimetry Measurements
Measurement screens Tabulation screens Dosimetry measurements Dosimetry measurements depend upon the run time—the longer the run time the greater the accumulated dose. Accordingly, dose measurements will either remain the same or grow during a study or session. They are determined from broadband data regardless of the selected analysis type. Tabulation screens The Tabulation screen shows measurements for two broadband measurements and for all the bands for the selected analysis type. -
Page 75: Time History/Back-Erase Screen
Time History/Back-erase screen Results of back-erasing Time History/Back-erase screen When conducting a broadband study, you can view as much as the last 20 seconds of Max SPL in this screen. The current Max appears at the right border of the Time Log chart (time=0) and advances, in one- second increments, toward the left border of the chart. -
Page 76: Time Log Screen
Back-erasing Results of back-erasing erased Back raw data - The raw data that you removed by back-erasing is saved in the session’s file. You can post-edit back-erased data with DMS software. How to back-erase 1. While running a study, view the Time Log screen in either the View Current Study or the View Session viewing area. -
Page 77: Stopping A Session
Back-erasing Stopping a session Stopping a session You can stop the session manually or with a trigger command, but only when the instrument is in the ■ Pause state. When the session is stopped, the Stop icon , appears in the Status Area and the RunTime clock is zeroed. - Page 78 Back-erasing Stopping a session (This page intentionally left blank) SoundPro ® Sound Level Meters Models SE and DL...
-
Page 79: Rt60, Curves, And Sti-Pa
CHAPTER RT60, Curves, and STI-PA Additional options RT60, Curves, and STI-PA Additional options In this chapter, it is important to note that these features are additional add-on options and may not be available on your SoundPro Sound Level Meter model unless you specifically purchased these features. ®... -
Page 80: Reverb Time
Additional options Reverberation The example below displays the Reverberation Time in an enclosed room. How it is measured with the impulse method: (1) A starter gun provides a broad impulsive spectrum noise at 110 dB. The instrument automatically begins plotting the sound decay (see dB level 1) and stops as the noise falls off (see dB level 2). -
Page 81: Reverberation (Rt60) Methods
Additional options Reverberation (RT60) methods Reverberation (RT60) methods The two methods supported by the SoundPro are the Interrupted noise method and the Impulse noise method. While the initial sound source used is different, the ending decay curve results are very similar providing accurate RT60 measurements. -
Page 82: Reverberation Options
Additional options Reverberation options Reverberation options The following setup options are selectable via the Reverberation Time Options Setup menu (displayed in Figure 6-3). Field Description Explanation of field selections Method - Interrupted – (This is the default method setting.) Selecting the calculation Interrupted method uses a constant sound source (i.e., dodecahedral speaker), process of RT60 reverb waiting for the level to stabilize, and then the source is turned off. -
Page 83: Setting Up Reverberation
Additional options Reverberation options Setting up reverberation The Reverb Time screen is used to change or view your reverberation settings. The steps below outline how to change the parameters. Please review Table 6-1: “Reverb time set-up options” for an explanation of parameters. -
Page 84: Running Reverberation Test
Additional options Running reverberation test Running reverberation test There are a couple factors to consider when conducting a reverberation test. Depending on if you will be measuring voice in a room, hall, theatre (etc.), ISO 3382 standard recommends measuring reverberation time for speech from 63 HZ to 4 kHz. -
Page 85: Reverberation Results
Additional options Reverberation results 3. Select RT60 as the measurement mode from the Start screen. Measurement type Select RT60 for Reverb testing Figure 6-4: Reverb Time Setup screen 4. Choose one of the following methods to conduct your test: Interrupted Method: Pump noise through room with existing sound system or a portable sound system. -
Page 86: Viewing Rt60 Values Of Each Band
Additional options Reverberation results Viewing RT60 values of each band The decay value for each specific band is viewable by pressing the left/right arrow keys. NOTE: Bands with invalid T60 values will show dashes (---) instead of a value. RT60 bar chart Selected band... -
Page 87: Decay Curve Screen
Additional options Reverberation results Decay curve screen This chart displays the (average or ensemble) results of a single Reverb Decay curve from the study (i.e., one filter band)/or the average of all studies within that session. (For more information, refer to “Sessions and Studies”... -
Page 88: Tabular Rt60 Screen
Curves Reverberation results Tabular RT60 screen This is a table-formatted screen which details a summary of the Reverb Decay Curve of each band. The following table is a brief summary of the tabular data. Column Explanation of data Freq The Frequency column displays the chosen filter bands (for 1/1 Octave the range is 63 Hz – 8 kHz and for 1/3 Octave the range is 50 Hz –... -
Page 89: Captured Curves
Captured curves Captured curve applications Captured curves Captured Curves, is a user-defined criterion curve, which allows the user to make a measurement with a 1/1 octave band frequency or a 1/3 octave band frequency distribution and save or capture the spectral curve. -
Page 90: Setting Up Captured Curves
Captured curves Setting up captured curves Setting up captured curves Setting up Captured Curves Settings and measurement settings From the start screen, select either 1/1 octave or 1/3 octave for the measurement type. (Repeatedly press first soft key.) Selecting Measurement type Press first soft key until 1/1 or 1/3 is selected Figure 6-8: Selecting measurement type for curves... -
Page 91: Running Captured Curves
Captured curves Running captured curves NOTE: Whether you choose Survey or Evaluation mode, the captured curved results will report the same data. The survey mode is recommended for Captured Curves since it is slightly easier to use in the field. Depending on your selection in step 4, refer to the following: If Survey Mode was selected, please see step 6. -
Page 92: Criterion Curve Families
Criterion curve families Running captured curves 2. To run a captured curve study, press Up/Down ▲/▼ to select (or highlight) View Session and press Enter 3. In the View session screen, select the appropriate meter 1 settings by using the corresponding soft keys for response time, weighting and measurement type (lookup key). -
Page 93: Types Of Criterion Curves
Criterion curve families Types of Criterion Curves Types of Criterion Curves The SoundPro Models SE/DL support a family of criterion curve families which are explained below. (For more information, please see glossary.) Noise Criterion Curves (NC) – uses a tangency method and is typically used for HVAC room or ... -
Page 94: Curves Setup Screen Example
Criterion curve families Setting up criterion curves 4. Select Setup (use up/down arrows to highlight) and press Enter 5. Select Options menu (use up/down arrows to highlight) and press Enter 6. Select Curves menu (use up/down arrows to highlight) and press Enter Curves screen Evaluation mode ... -
Page 95: Audiometric Background Curves
Audiometric background curves Setting up audiometric background curves Audiometric background curves The SoundPro SE/DL series supports the following two types of audiometric test room sound level curves: Audiometric Test Room Background Sound Level Curves (OSHA) which compares the ambient noise ... -
Page 96: Selecting Measurement Type For Curves
Audiometric background curves Setting up audiometric background curves 3. Select the following recommended meter 1 settings using the soft keys using the soft keys: measurement to Leq, Slow response, and Z-weighting. Setting measurement to Leq: Press the 1 soft key to access the “Lookup” menu. Using ... -
Page 97: Running And Viewing Curves
Running and viewing curves Curve measurements and results 10. (Skip this step if you selected OSHA AM Booth). To select a Criterion, press the down arrow and repeatedly press Enter . You have the following three settings in the testing ranges of 125 Hz-kHz, 250 Hz –... -
Page 98: Curve Results
Running and viewing curves Curve measurements and results To view your results, press Enter . The following screens appear. (a) Sample bar chart – displays 1/1 octave band with curve and sound values plotted on the spectrum. (See “a” below: A- selected band, B- curve indicator, C- amplitude in band.) (b) Tabular screen –... -
Page 99: Speech Intelligibility
Speech Intelligibility STI-PA testing Speech Intelligibility Another available add-on feature is Speech Transmission Index (STI) used to evaluate and classify speech intelligibility dependent of background noise level. STI is the standardized measurement in the IEC 60268-16:1998 standard. STI-PA testing STI refers to the amount of modulation preserved in the broadcasting of an artificial speech signal through an alarm system. -
Page 100: When To Take Sti-Pa Readings
Speech Intelligibility Conducting a STI-PA test (overview of steps) When to take STI-PA readings? Scenario one You may be able to run the test signal through the PA system during normal business hours. In this scenario, you would set the meter to STI-PA and select either STI scale or CIS scale and run your study in the mapped “zone”... -
Page 101: Sti-Pa Setup
Speech Intelligibility STI-PA setup STI-PA setup The following table explains all of the parameters found in the measures setup screen. Measures setup screen Explanation Scale type field Select either STI scale or CIS scale. (Please refer to Chapter 1, “STI scale or CIS scale”) Gender field The voice can be set according to the test signal being use, male or female... -
Page 102: Measurement Type Selection (Stipa)
Speech Intelligibility STI-PA setup Setting up STI-PA (speech intelligibility) 1. Turn the meter On. 2. From the Start screen, select the Measurement type as STI-PA. Press the first soft key repeatedly until “STI-PA” appears. Selecting measurement type STIPA Figure 6-18: Measurement type selection (STIPA) 3. -
Page 103: Conducting A Level Setup (For Sti-Pa)
Speech Intelligibility Conducting a level setup (for STI-PA) 9. To change the Range, press Down arrow and then repeatedly press Enter to select a specific range. 10. Once set, press Enter to return to the Start screen. Conducting a level setup (for STI-PA) From a fixed-point, measure the A-weighted Sound Pressure Level of your mass notification system (or alarm system). -
Page 104: Sti-Pa Results Screens
Speech Intelligibility STI-PA results screens 3. Verify that the range setting is appropriate for the level being measured. It is desirable to select the longest range that does not overload. (To change the range, press Up/Down arrows from the STI-PA screen.) 4. - Page 105 Speech Intelligibility STI-PA results screens electronics, reverberation, HVAC systems) in each attenuation band and indicates which values are intelligible/unintelligible based on the CIS/STI scale. NOTE: A high MTF value indicates that the listeners received the message without any distortions or interference.
-
Page 106: Sti-Pa Modulation Envelope Screen
Storing background noise/capture curve STI-PA results screens STI-PA modulation envelope screen This screen reports a summary of the STI-PA modulation screen. ◄/► 1. To view each band’s results, press Arrow key. NOTE: The results can be used to assess each frequency’s band modulation level to determine why it passed or failed (in order to correct any issues). - Page 107 Storing background noise/capture curve STI-PA results screens 2. Setting up Curves: Select Setup and press Enter Select Options (via the Down Arrow and press Enter Curves will be highlighted, press Enter Choose Survey as the Mode and Captured (CAP) as the Type and then press On/Off/Esc repeatedly to return to the Start screen.
-
Page 108: Applying Captured Curves For Sti-Pa Testing
Storing background noise/capture curve Applying captured curves for STI-PA testing 4. Optional: To capture additional background levels, change the 1 soft key to either (Cap-1, Cap-2, Cap-3, Cap-4) and then press the Capture (2 ) soft key. Repeat this step as needed. (You can store and apply up to 4 background noise SPL levels.) CAP-1 Press first soft key... - Page 109 Storing background noise/capture curve Applying captured curves for STI-PA testing Press the Run/Stop key while playing the test signal in the appropriate location/zone. The captured curve will automatically calculate with the STI-PA results. NOTE: Press the left/right arrow to view the modulation screen and/or the modulation envelope screen if desired.
- Page 110 Storing background noise/capture curve Applying captured curves for STI-PA testing (This page intentionally left blank) SoundPro ® Sound Level Meters Models SE and DL...
-
Page 111: Viewing Past Measurements
CHAPTER Appendix C Viewing Past Measurements Viewing Past Measurements This chapter explains how to view your past sessions and studies. It will also explain how to rename your sessions/studies and how to clear/reset the data on the memory card. Files A session file is automatically created when you begin the first study in that session. -
Page 112: File Directory Screen Explained
File directories File directory screen explained File directory screen explained NOTE: this is accessible when a session is not opened (i.e., run /pause mode). 1. From the Start screen, press the File soft key. The File screen appears. 2. In the File screen, select Session Directory or Configuration Directory, then press . -
Page 113: File Menu Screen
File directories Viewing past sessions/studies (review mode) 2. Session Directory will be highlighted, press Enter Session Directory Figure 7-3: File menu screen 3. In the Data File screen, press ▲/▼ Arrows to select one of the saved sessions and press Enter (to load the file). -
Page 114: Selecting Past Study Data (Review Mode)
File directories Viewing past sessions/studies (review mode) 4. It will state “Loaded.” Press either Enter or On/Off/Esc key. 5. In the Start screen, the review indicator appears. Select either View Session or View Current Study (by pressing ▲/▼ and Run time Review mode - when both Pause and Stop indicators appear, this signifies you can view your saved... -
Page 115: Loading And Deleting Files
File directories Loading and deleting files Loading and deleting files As you are working with loading past files and possibly deleting files which have been imported into QSP-II, it is important to note that the delete operations take place as soon as you press the respective soft key. -
Page 116: Session Directory
File directories Session directory Session directory The Session Directory contains the past saved sessions and studies. To navigate to this screen, select Setup\File soft key\Session Directory menu. (Refer to Figure 7-2 and Figure 7-3 for screen examples.) Session Directory Figure 7-8: Examples of directory screens Configuration Dir ectory Navigating in a session/config. -
Page 117: Naming And Renaming Files
File directories Session directory Naming and renaming files There are common procedures that you can use to name and rename files, including a lookup capability that allows you to determine if a filename is already in use. You cannot rename a session file unless it is in the instrument’s memory. Accordingly, you can rename the closed session currently residing in memory, but you must first load a past session file before you can rename it. -
Page 118: Configuration Directory
Configuration directory Saving (& naming) setup file (config. file) 5. When finished, press and Save will appear. 6. Press to save the file name (or press On/Off/Esc to cancel). Configuration directory File Setups, or File Configurations, can be saved to the instrument in order to save and reuse for future. (This can also be performed via QSP-II when you save a setup.) The naming/renaming procedure below includes a lookup utility that you can use to determine what name to assign. -
Page 119: Viewing, Loading, Deleting Setup Files (Config.)
Memory card Viewing, loading, deleting setup files (config.) save 5. To your setup, press the On/Off/Esc and the Save option will be highlighted. Press Enter key to save (or press On/Off/Esc key to cancel). Viewing, loading, deleting setup files (config.) ... -
Page 120: Compatibility
Memory card Compatibility Compatibility Steps have been taken to make sure the SoundPro meter is compatible with as many SD cards as possible. Because of the many SD card manufacturers and the varying low-level formats they use, TSI can only guarantee operation with cards available from TSI. If using a memory card with 2GB or less, FAT 16 format is required. -
Page 121: Communicating
CHAPTER Appendix C Communicating Communicating This chapter covers issues related to the memory card, the USB port and the AC/DC outputs. Communicating with a PC Using Detection Management Software DMS When you download the data via the the download feature, the data is stored and viewable via the data finder page with advanced charting, tables, and reporting capability. -
Page 122: Dms And Working With Soundpro Data
Communicating with a PC DMS and working with SoundPro data DMS and working with SoundPro data Viewing data and Data Finder Page 1. Communicating/connecting the SoundPro meter to 2. DMS Welcome page and instrument the PC communication A. Click on icon (see A) to access the A. -
Page 123: Ac/Dc Output
AC/DC output AC output AC/DC output Output signals are available at the AC/DC jack in the hardware interface panel at the base of the instrument (“Hardware interfaces”). Users are responsible for providing the cable to attach to this jack. For information about the pinout, see “AC/DC jack.”... - Page 124 AC/DC output DC output (This page intentionally left blank) SoundPro ® Sound Level Meters Models SE and DL...
-
Page 125: Specifications
APPENDIX Appendix C Specifications Specifications Conformance to standards Acoustics IEC 61672-1 (2003) (2002-05) - Electroacoustics, Sound level meters, Part 1: Specifications. IEC 61672-2 (2003-04) - Electroacoustics, Sound level meters, Part 2: Pattern evaluation tests. IEC 61260 (1995-08) - Electroacoustics, Octave-band and fractional-octave- band filters. ANSI S1.11-2004 - American National Standard “Specification for Octave- Band and Fractional-Octave- Band Analog and Digital Filters.”... -
Page 126: Mechanical Characteristics
Mechanical characteristics DC output Mechanical characteristics Housing: ...... Stainless fiber-filled ABS/polycarbonate with internal EMC shielding. Size: ......7.9 cm(W) x 28.2 cm (H) x 4.1 cm (thick); (with preamp and microphone) 3.1"(W) x 11.1"(H) x 1.6" (thick) (with preamp and microphone) ... -
Page 127: Preamplifier (Removable)
Electrical characteristics DC output External Power External DC power may be provided to the Power jack from the AC or DC sources identified below. Power consumption will range from 1.0-1.5 W at 8-16 VDC. 8 VDC - 125 to 190 mA. ... -
Page 128: Octave Filters (Optional)
Environmental effects Temperature Octave filters (optional) Number of bands ..Eleven bands, with center frequencies (f ) ranging from 16 Hz to 16 kHz. The octave filters are flat within < 0.3 dB in each passband. The half-power points are at 0.707 f and 1.414 f Octave skirts .... -
Page 129: User Interface
User interface Display User interface Display Size ....... 128 x 64 pixel display that measures 6 cm x 4.8 cm (2.4" x 1.9"). Lighting ......Transflective to take advantage of ambient lighting plus fiberoptic backlighting that can be manually operated or set to turn off after a timed interval. Keypad Construction.... -
Page 130: Microphones
Input/output Microphones Microphones The following specifications apply to microphones connected to the instrument. QE7052 Free-field, Class/Type 2, (standard), low cost ½-inch diameter (.52"), electret (200 volts must be set to “Off”) BK4936 Free-field, Class/Type 1, (standard) ½-inch diameter (.52"), electret (200 volts must be set to “Off”) QE4110 Free-field, Class/Type 1 (optional) ¼-inch diameter (.276"), condenser (200 Volts must be... -
Page 131: Ac/Dc Outputs
Measurements AC/DC outputs AC/DC outputs Connector ....One 3.5 mm stereo plug connector for both AC and DC outputs. AC output..... Meter 1 output, and includes the frequency response setting for that meter. The AC output is affected by the instrument’s range setting. DC output..... -
Page 132: Other
Calibration Other Other Maximum peak level ... 3 dB over the full-scale reading. Calibration Pre-calibration ..... When performed, valid prior to the start of a session. Post-calibration ... When performed, valid for the previous study in the session. Storage......All calibrations for a session are stored in the related session file. Calibrators .... -
Page 133: Logging (Optional)
Logging (optional) Replacement parts Logging (optional) Measurements ..... User-selectable for each of the two meters. Includes two measurements of exceedance for Meter 1 (only for logging intervals equal or greater than one minute). With filtering ....If a filtering option is installed, either broadband or filtered logging can be selected, where filtered logging will depend upon the analysis type setting for the session. -
Page 134: Port Pinouts
Port pinouts AC/DC jack Part Number Description 058-489 QE4150 free field microphone, 0.5" condenser type. 058-488 QE4170 pressure microphone, 1" condenser type. 053-571 9V Switching-type, universal power supply. 057-860 Detection Management Software 056-981 QC-10 Calibrator; 114dB at 1000 Hz Output. 056-982 QC-20 Calibrator;... -
Page 135: Auxiliary Connector
Port pinouts Auxiliary connector Auxiliary connector The auxiliary connector in the of the instrument can be used for input and output triggers (See base “Triggers”) to receive GPS signals or for RS-232 serial communications. Figure A-2 shows the pinout for the auxiliary connector. -
Page 136: Block Diagram For Soundpro Sound Level Meter
Block Diagram for SoundPro Sound Level Meter Auxiliary connector Block Diagram for SoundPro Sound Level Meter SoundPro ® Sound Level Meters Models SE and DL... -
Page 137: Glossary Of Terms
APPENDIX Appendix B Glossary of Terms Glossary of Terms The C-A measurement is an SPL average that enhances the low- frequency components of the sound signal. Frequency (Hz) Figure B-1: C-A weighting response curve Center frequency The center frequency of each octave and third octave filter band. CNEL Community Noise Exposure Level. -
Page 138: Dynamic Range
Appendix B Glossary of Terms Sound Level Meters use the decibel as the unit of measure known as Sound Pressure Level (SPL). SPL uses the ratio between a reference level of 20 microPascals (.00002 Pascals) and the level being measured. SPL = 20 log (measured level/reference level) Example: the SPL for 1 Pascal is 20 log (1 Pascal/.00002 Pascal) = 94 dB 20 microPascals (.00002 Pascals) is considered the average threshold of hearing. - Page 139 Appendix B Glossary of Terms Exchange Rate (ER) Also known as the Doubling Rate, this refers to how the sound energy is averaged over time. Using the decibel scale, every time the sound energy doubles, the measured level increases by 3 dB. This is the 3 dB Exchange Rate that most of the world uses.
- Page 140 Appendix B Glossary of Terms Level (L Notation used to represent sound pressure level measurements in IEC/ISO notation, where the measurements are made with particular frequency (F) and time (T) response parameters. For an actual measurement, the F and T parameters are replaced by standardized notation for those parameters. Average sound level measured over the run time.
- Page 141 Appendix B Glossary of Terms Peak SPL. This is the highest SPL value obtained during a study or a session. A peak SPL measurement is affected by the frequency response setting but not by the time response setting of the meter. Octave band An Octave band is defined as a frequency band whose upper band-edge frequency is twice the lower band frequency.
- Page 142 Appendix B Glossary of Terms PTWA This is a projected TWA determined for a projected time (Prt) in relation to the Criterion Time (CT) as follows. dB -------- - Peak –C The following chart illustrates the range of Sound Level with C-weighted Peak. Level Range Peak C Level Range Level Range...
- Page 143 Appendix B Glossary of Terms Response time (F,S, I) Selectable time response settings used in SoundPro SE/DL measurements. The response time is a standardized exponential time weighting of the input signal according to fast (F), slow (S) or impulse (I) time response relationships.
- Page 144 Appendix B Glossary of Terms Burst duration, t (milliseconds) Figure B-4: Impulse response to a tone burst Room Criterion Curves (RC) Room Criterion curve’s was introduced in 1981 by Blazier to primarily rate noise in offices/room acoustics. This methodology calculates a numerical rating based on speech interference and indicates any interference such as hissing, rumbling, or vibration.
- Page 145 Appendix B Glossary of Terms Taktmx A time average over a sampling interval that uses the highest level occurring during the preceding Taktmaximal Interval, either three or five seconds, and assumes that it was present for the whole Taktmaximal Interval. Third-octave band A Third-octave band is defined as a frequency band whose upper band- edge frequency is 1.26 times the lower band frequency.
- Page 146 Appendix B Glossary of Terms Weighting (A, C, Z, F) SPL measurements are commonly weighted (scaled) in relation to their frequency components in order to provide a consistent basis for comparison to other measurements of the same type. In addition to the standardized A, C and Z weighting curves, you can select F-weighting (flat) which provides no weighting at all.
-
Page 147: Customer Service
APPENDIX Appendix C Customer service Customer service This section gives directions for contacting TSI Incorporated for technical information and directions for returning the SoundPro Sound Level Meter for service. Technical Support Contacts If you have any difficulty setting or operating the instrument, or if you have technical or application questions about this system, contact TSI’s Technical Support. -
Page 148: Returning For Service
Appendix C Returning for Service Returning for Service Visit our website at http://rma.tsi.com and complete the on-line “Return Merchandise Authorization” form or call TSI at 1-800-680-1220 (USA) or (651) 490-2860, or 001 651 490 2860 (International) for specific return instructions. Customer Service will need the following information: ... -
Page 149: Warranty
Appendix C Warranty Warranty (For country-specific terms and conditions outside of the USA, please visit www.tsi.com.) Seller warrants the goods, excluding software, sold hereunder, under normal use and service as described in the operator's manual, to be free from defects in workmanship and material for 12 months, or if less, the length of time specified in the operator's manual, from the date of shipment to the customer. - Page 150 Appendix C Warranty (This page intentionally left blank) SoundPro ® Sound Level Meters Models SE and DL...
-
Page 151: Index
APPENDIX Appendix D Index Index AC/DC Captured Curves Output explained ..........113 Applications ............79 Port location ............6 Runing and viewing results ........87 Alternate functions Setting up ............. 80 Indicator ..............18 Center frequency Altf ................17 Defined ............... 127 Arrows ................ - Page 152 Appendix D Index Hardware interface ............5 STI-PA testing ............89 Indicators Stop ..............67 Explained .............. 18 Tabulation screen ..........64 Information screen Time History ............65 explained ..............7 Measures setup screen Keypad Gender field ............91 example ..............16 Post Process field ..........
- Page 153 Appendix D Index Power jack Screens, Time-History/Back-erase ......65 location ..............6 Screens, viewing Power supply community noise; ..........63 auto and universal explained ........ 15 Dosimetry screen ..........63 connecting ............. 15 file ............... 102 Pre-Calibrate history screen ........57 filtered bar chart ...........
- Page 154 Appendix D Index Soft key buttons ............17 Study Soft key menu ............17 scenario ..............53 Soft keys Taktmx Explained .............. 59 Defined ............... 135 SoundPro SE or DL kit ..........9 Third-octave band Speech Transmission Index Defined ............... 135 Explained ..............
- Page 155 TSI Incorporated – Visit our website www.tsi.com for more information. Tel: +1 800 874 2811 India Tel: +91 80 67877200 Tel: +44 149 4 459200 China Tel: +86 10 8219 7688 France Tel: +33 1 41 19 21 99 Singapore Tel: +65 6595 6388 Germany Tel: +49 241 523030...
Need help?
Do you have a question about the Soundpro SE Series and is the answer not in the manual?
Questions and answers