Table of Contents
Advertisement
Advertisement
Table of Contents
Troubleshooting

Related Manuals for Parker SCM-150-1-01


Summary of Contents for Parker SCM-150-1-01
- Page 1 SERVICEMAN TRAINING MANUAL VERSION 1.0A 2/28/99...
-
Page 2: Table Of Contents
GETTING STARTED What are the capabilities of my new meter? Setting Your Units USING YOUR METER Pressure measurement Minimum & Maximum Pressure Recording (spikes and drops) Differential Pressure Measurement (Pressure Drop) Measuring with Flow Meters, Temperature Sensors, and RPM Sensors Flow Measurements Temperature Measurements RPM or U/Min Measurements... -
Page 3: Getting Started
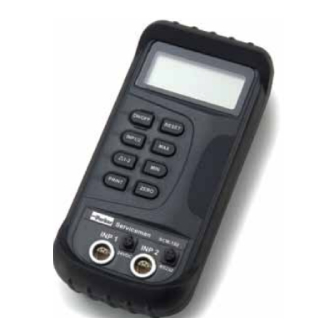
Congratulations on your purchase of a new Serviceman Meter from Parker! You should find this training manual useful as you learn how to use your newest diagnostic tool. Getting started What are the capabilities of my new meter? You must first determine which level meter you have purchased. To do this please look at the face of your meter and compare it to the following pictures. -
Page 4: Setting Your Units
Setting Your Units When you first receive your meter its units are all set to metric. If you need to change any of the units please read the following set of instructions: 1. Turn your meter off. 2. Depress the ÒRESETÓ key and hold it down. 3. - Page 5 7. When the desired pressure unit is displayed on the LCD screen press the ÒHOLDÓ key to save that unit type. 8. The meter Screen should still say unit except now it is waiting for you to select the type of temperature units you would like to measure in.
-
Page 6: Using Your Meter
Using Your Meter So far you have figured out how to tell which meter you have and set your units up. Now its time to learn how to use your serviceman. Pressure measurement When taking a single pressure measurement with your new meter you will need the following items: (1) One Serviceman Meter (2) One Pressure Transducer... - Page 7 Coupling 5. Turn the meter on by depressing the ÒON/OFFÓ key. Take a moment to notice the following items on your Servicemans display Input Automatic Unit Indicator Display Pressure Reading IMPORTANT! 6. Since you are connected to input one make sure the input indicator reads ÒINP1Ó indicating it is displaying input one.
-
Page 8: Minimum & Maximum Pressure Recording (Spikes And Drops)
Minimum & Maximum Pressure Recording (spikes and drops) Your New Serviceman meter is capable of capturing any pressure spike or pressure drop as long as it is 2 milliseconds (.002 seconds) long. This means you can capture virtually any spike in your hydraulic system. -
Page 9: Differential Pressure Measurement (Pressure Drop)
5. Depress the ÒMINÓ button to view the minimum pressure the meter has seen since you depressed the reset button. Congratulations you have successfully learned how to capture pressure spikes and pressure dives. Differential Pressure Measurement (Pressure Drop) Your new meter can be used to measure pressure drop across any hydraulic component. What doe that mean? Follow along. - Page 10 2. Connect your transducers across a component of your hydraulic system via the couplings on the transducers. In the picture below the transducers a connected across a hydraulic motor. 3. Turn the meter on using the ÒON/OFFÓ button. 4. Depress the Ò∆PÓ button on the meter. The input indicator in the LCD display now shows ÒINP1-INP2Ó...
-
Page 11: Measuring With Flow Meters, Temperature Sensors, And Rpm Sensors
Measuring with Flow Meters, Temperature Sensors, and RPM Sensors Since all measuring (i.e. pressure, flow, temperature, and RPM) with your Serviceman meter is similair the following abreviated sections are provided. Flow Measurements You need the following for taking a flow measurement with your meter (1) One Serviceman meter (2) One flowmeter with electronics (3) One four to five pin cable (SCK-102-02-08) -
Page 12: Temperature Measurements
6. Be sure that the input indicator on the LCD display reads ÒINP1Ó signifying the meterÕs display is displaying input1. If it reads ÒINP2Ó press the ÒINP1/2Ó key to toggle the display. 7. Turn on your hydraulic system and monitor the display as needed. 8. -
Page 13: Rpm Or U/Min Measurements
4. Be sure that the input indicator on the LCD display reads ÒINP1Ó signifying the meters display is displaying input1. If it reads ÒINP2Ó press the ÒINP1/2Ó key to toggle the display. 5. Turn on your hydraulic system and monitor the display as needed. 6. - Page 14 spinning. This is useful when a rotating device can not be stopped to apply a reflective decal. The following formulas can be used when doing this calculation: Circumfere Sensor Wheel (Reading meter) Spinning Circular Object Circumfere Where Measuremen Taken Connect the four pin end of the RPM Sensor cable to the serviceman meterÕs input 1 socket by screwing the sleeve on the connector clockwise.
-
Page 15: Using A Pc Or Printer With Your Meter (Serviceman Level 2 Only)
Using a PC or Printer With Your Meter (Serviceman Level 2 Only) PC Transfer (Level two Serviceman Only) Your new level two serviceman is capable of transferring measurement data to a PC while your taking a measurement (live). You need the following for transferring measurement data to your PC (1) One Level Two Serviceman meter (SCM-150-1-02). - Page 16 Once the installation is complete you need to set the parameters for the software. To do this open the SCM-150 Data Recorder software on your PC by double clicking on the movie projector icon. SCM-150 Data Recorder Icon The following dialog box should appear after double clicking on the icon. Click Here Click on the center flag as this indicates you want to use the english language to set your parameters.
- Page 17 The following dialog box should appear on your screen. Type in File Path (i.e. C:/testfiles) Language Selection COM Port Selection OK Button Select a COM port which is available on the back of your computer. If you are unsure which one is available just select COM1 and you can change it to COM2 later if needed.
-
Page 18: Setting The Transfer Rate And Print Interval Of The Meter
Setting the Transfer Rate and Print Interval of the Meter First we must insure the meterÕs transfer rate is set accordingly for PC transfer. 1. Turn off the meter using the ÒON/OFFÓ key. 2. Press and hold the ÒPRINTÓ key down. While holding the print key down press the ÒON/OFFÓ... -
Page 19: Connecting The Meter To The Pc
Use the ÒMINÓ and ÒMAXÓ keys to set the print interval in seconds. 8. Once the desired value in seconds appears on the LCD press the ÒHOLDÓ key to save and resume normal operating mode. Connecting the Meter to the PC Now that the software is loaded and the meter is set up its time to get down to business. -
Page 20: Downloading To The Pc
4. Connect the other end of the PC adapter cable to your PCÕs Serial Port/COM port as shown below. *Note: This must be the port you specified in the parameters when you set up the software. If your computer is not labeled as to which one is which just plug it into one of them and you can reset the parameters to allow the down load to work later. -
Page 21: Saving Your File
Movie Projector Button 2. Click on the movie projector button in the programs dialog box. This prepares the software for data transfer. 3. Press the ÒPRINTÓ key on the meter and you should see the ÒINPÓ on the LCD screen blinking. -
Page 22: Graphing Your File In Excel
This saves your test data as a .xls file. This file can be opened and graphed in Microsoft Excel™ or similar spreadsheet applications. See ÒGraphing in Excel™Ó. Graphing your File In Excel ™ Opening your File To open your data file in Excel™ simply open Excel™ and click on ÒFILEÓ and ÒOPENÓ as shown. -
Page 23: Preparing Data For Graphing
The next thing you see is a dialog box which is telling you a whole bunch of stuff. Simply Click on ÒFINISHÓ as shown in the photo. Click on Finish and ignore the rest of this dialog box At this point you should see your data in excel. It should look something like the picture below. Preparing Data for Graphing You will notice the software does not plot the time next to your pressures, flows, temperatures, or RPMs. - Page 24 First ENTER the following FORMULA in the cell to the left of the first value you wish to plot: =3. Click on the cell to enter it. Enter =3 Shown Second ENTER an EQUALS SIGN in the cell right below the cell you just put Ò=3Ó in. Before you touch anything CLICK in the cell which has Ò=3Ó...
- Page 25 To do this simply CLICK in the SECOND CELL (=A5+3) and notice the small square in the lower right hand corner of the highlight now around the cell. Small Square Move your mouse pointer over the small square and notice it changes to a cross hair (+). When this happens CLICK you mouse button and HOLD it while DRAGGING DOWN the COLUMN to the END of the DATA as shown End of Data...
-
Page 26: Graphing Your Data
If this has been done correctly you should have a column which starts with three at the top and counts in multiples of three until the end of the data. If so PAT YOURSELF ON THE BACK. Column Counting by Three Graphing your Data Now we are going to graph the time column you just created vs. -
Page 27: Trouble Shooting The Serviceman Software
The following dialog box pops up and you may select the XY (Scatter) graph (this type of graph works well). As you notice 5 different types of XY scatter plots are available and you may choose any of them. It just depends weather or not you want a smooth curve or not and weather you want the dots connected. -
Page 28: Printing With The Scpr-100 (Level Two Serviceman Only)
Printing with the SCPR-100 (Level two Serviceman Only) Your new level two serviceman is capable of transferring measurement data to printer while taking a reading (live). You need the following for transferring measurement data to your SCPR-100 printer. (1) One Level Two Serviceman meter (SCM-150-1-02) (2) One or two of any kind of sensor (i.e. -
Page 29: Connecting The Meter To The Printer
This is asking you to enter a print interval. The print interval defines how often (in seconds) you want the meter to send a min, max and instantaneous value to the printer (the min and max value it sends is the min and max value the meter has seen since the last time it sent a min and max). Confusing sentence? Yes. -
Page 30: Printing
Snap the small black connector onto the meters fiber optic port as shown. Connect the other end of the cable to the back of the printer as shown. Printing Turn the printer on using the ÒON/OFFÓ key. Depress the ÒPRINTÓ key on the meter and watch as your printer prints out values. When you wish to stop printing press the ÒPRINTÓ... - Page 31 You should see a printout like below. Program-Mode Present settings are: Data Bits: Parity: None Baud Rate: 2400 Country: Germany Print mode: Text Auto-off: 5 mins. Emulation: Standard DTR: Normal Chars/line: Graphics: Hi-res Contrast: Label: Disabled *Note: If you do not touch any keys within ten seconds the printer assumes youÕre finished with the setup and resumes normal operating mode.
-
Page 32: Appendix
Appendix Battery Replacement Remove the meter from the protective housing. Use a phillips screw driver to take out the three screws on the back of the meter. Flip the meter over and pull the two halves apart carefully. Remove the battery from the meter case. - Page 33 Insert the new battery into the meter case as shown. Carefully press the two halves of the meter back together. Carefully flip the meter over and use a Phillips screw driver to tighten the three screws into the meter. Insert the meter back into the protective housing.
-
Page 34: Repairs And Calibrations
Repairs and Calibrations All SensoControl equipment must be returned on a RGA. This number must be obtained during normal business hours of 8-5 central time. Please call (612) 544-7781 and ask for sales. All repairs will be estimated before being performed except for calibration requests. ISO Calibrations (Traceable to NIST Standards) All of our meter, pressure transducer, flow meter, and temperature probe calibrations are traceable to NIST standards.
Need help?
Do you have a question about the SCM-150-1-01 and is the answer not in the manual?
Questions and answers