Segger J-Link User Manual
Jtag emulators for
arm cores
Hide thumbs
Also See for J-Link:
- User manual (480 pages) ,
- Reference manual (64 pages) ,
- User manual (206 pages)

Subscribe to Our Youtube Channel
Related Manuals for Segger J-Link


Summary of Contents for Segger J-Link
- Page 1 J-Link / J-Trace User Guide JTAG Emulators for ARM Cores A product of SEGGER Microcontroller GmbH & Co. KG Release date: 07-12-04...
- Page 2 Please make sure your manual is the latest edition. While the information herein is assumed to be accurate, SEGGER Microcontroller GmbH & Co. KG (the manufacturer) assumes no responsibility for any errors or omissions. The manufacturer makes and you receive no warranties or conditions, express, implied, statutory or in any communication with you.
- Page 3 Subchapter 5.2.2: Corrected JTAG+Trace connec- 060711 tor pinout table. Subchapter 4.1: Added ARM966E-S to List of sup- 060628 ported ARM cores. Subchapter 5.5.2.2 changed. 060607 Subchapter 5.5.2.3 added. J-Link / J-Trace User Guide © 2004 - 2007 SEGGER Microcontroller GmbH & Co. KG...
- Page 4 051025 Chapter Setup: "Scan chain configuration" added. Some smaller changes. 051021 Performance values updated. 051011 Chapter "Working with J-Link" added. 050818 Initial version. J-Link / J-Trace User Guide © 2004 - 2007 SEGGER Microcontroller GmbH & Co. KG...
- Page 5 About this document This document describes J-Link and J-Trace. It provides an overview over the major features of J-Link and J-Trace, gives you some background information about JTAG, ARM and Tracing in general and describes J-Link and J-Trace related software pack- ages available from Segger.
- Page 6 Apart from its main focus on software tools, SEGGER developes and produces program- ming tools for flash microcontrollers, as well as J-Link, a JTAG emulator to assist in devel- opment, debugging and production, which has rapidly become the industry standard for debug access to ARM cores.
-
Page 7: Table Of Contents
Specifications for J-Trace ................15 1.3.3 Download speed ..................16 Requirements..................17 2 Setup..........................19 Installing the J-Link ARM software and documen-tation pack ......20 2.1.1 Setup procedure..................21 2.1.2 Verifying correct driver installation ............. 24 Uninstalling the J-Link USB driver .............. 26 Connecting the target system.............. - Page 8 4.4.1 How does it work? ................... 50 4.4.2 Configuring multiple J-Links / J-Traces ............51 4.4.3 Connecting to a J-Link / J-Trace with non default USB-Address...... 52 Multi-core debugging ................53 4.5.1 How multi-core debugging works............... 53 4.5.2 Using multi-core debugging in detail ............54 4.5.3...
- Page 9 Embedded Trace Macrocell (ETM)............... 97 Embedded Trace Buffer (ETB) ..............98 Flash programming .................. 99 7.6.1 How does flash programming via J-Link / J-Trace work ?....... 99 7.6.2 Data download to RAM ................99 7.6.3 Data download via DCC ................99 7.6.4...
- Page 10 J-Link / J-Trace User Guide © 2004 - 2007 SEGGER Microcontroller GmbH & Co. KG...
-
Page 11: Introduction
Chapter 1 Introduction This chapter gives a short overview about J-Link and J-Trace. J-Link / J-Trace User Guide © 1997 - 2007 SEGGER Microcontroller GmbH & Co. KG... -
Page 12: J-Link Overview
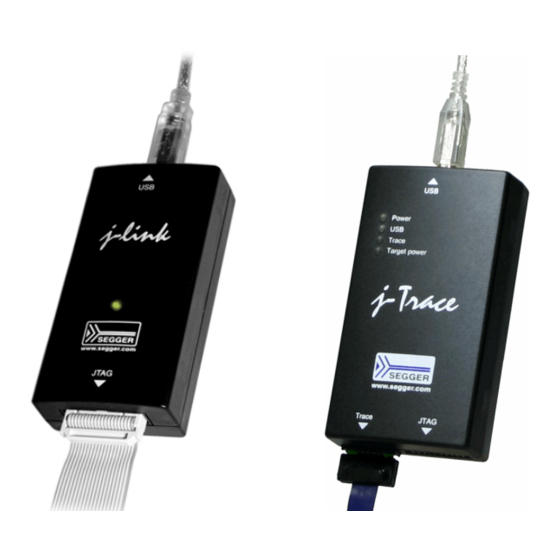
Introduction J-Link overview J-Link is a JTAG emulator designed for ARM cores. It connects via USB to a PC run- ning Microsoft Windows 2000, Windows XP, Windows 2003 or Windows Vista. J-Link has a built-in 20-pin JTAG connector, which is compatible with the standard 20-pin connector defined by ARM. -
Page 13: J-Trace Overview
Full integration with the IAR C-SPY® debugger; advanced debugging features available from IAR C-SPY debugger. * = Measured with J-Trace, ARM7 @ 50 MHz, 12MHz JTAG speed. J-Link / J-Trace User Guide © 1997 - 2007 SEGGER Microcontroller GmbH & Co. KG... -
Page 14: Test Environment
• USB 2.0 hub • J-Link • Target with ARM7 running at 50MHz. Below is a screenshot of JLink.exe after the measurement has been performed. J-Link / J-Trace User Guide © 1997 - 2007 SEGGER Microcontroller GmbH & Co. KG... -
Page 15: Specifications
Microsoft Windows XP Microsoft Windows XP x64 Supported OS Microsoft Windows 2003 Microsoft Windows 2003 x64 Microsoft Windows Vista Microsoft Windows Vista x64 Table 1.2: J-Trace specifications J-Link / J-Trace User Guide © 1997 - 2007 SEGGER Microcontroller GmbH & Co. KG... -
Page 16: Download Speed
Table 1.3: Download speed differences between hardware revisions Note: The actual speed depends on various factors, such as JTAG, clock speed, host CPU core etc. J-Link / J-Trace User Guide © 1997 - 2007 SEGGER Microcontroller GmbH & Co. KG... -
Page 17: Requirements
Requirements Host System To use J-Link or J-Trace you need a host system running Windows 2000, Windows XP, Windows 2003, or Windows Vista. Target System An ARM7 or ARM9 target system is required. The system should have a standardized 20-pin connector as defined by ARM Ltd. for a simple JTAG connection. The individual pins are described in section JTAG Connector on page 74. - Page 18 CHAPTER 1 Introduction J-Link / J-Trace User Guide © 1997 - 2007 SEGGER Microcontroller GmbH & Co. KG...
-
Page 19: Setup
Chapter 2 Setup This chapter describes the setup procedure required in order to work with J-Link / J- Trace. Primarily this includes the installation of the J-Link software and documenta- tion package, which also includes a kernel mode J-Link USB driver in your host sys- tem. -
Page 20: Installing The J-Link Arm Software And Documen-Tation Pack
J-Link USB driver. Some of the applications require an additional license, free trial licenses are avaliable upon request from www.segger.com. Refer to chapter J-Link and J-Trace related software on page 33 for an overview about the J-Link software and documentation pack. J-Link / J-Trace User Guide... -
Page 21: Setup Procedure
To install the J-Link ARM software and documentation pack, follow this procedure: Note: We recommend to check if a newer version of the J-Link software and doc- umentation pack is available for download before starting the installation. Check therefore the J-Link related download section of our website: http://www.segger.com/download_jlink.html... - Page 22 Add shortcuts to desktop option are preselected. Accept or deselect the options and confirm the selection with the Next > button. The installation process will be started. J-Link / J-Trace User Guide © 1997 - 2007 SEGGER Microcontroller GmbH & Co. KG...
- Page 23 The J-Link software and documentation pack is successfully installed on your PC. Connect your J-Link via USB with your PC. The J-Link will be identified and after a short period the J-Link LED stopps rapidly flashing and stays on permanently.
-
Page 24: Verifying Correct Driver Installation
In addition you can verify the driver installation by consulting the Windows device manager. If the driver is installed and your J-Link / J-Trace is connected to your com- puter, the device manager should list the J-Link USB driver as a node below "Univer- sal Serial Bus controllers"... - Page 25 Right-click on the driver to open a context menu which contains the command Prop- erties. If you select this command, a J-Link driver Properties dialog box is opened and should report: This device is working properly. If you experience problems, refer to the chapter Support and FAQs on page 107 for help.
-
Page 26: Uninstalling The J-Link Usb Driver
CHAPTER 2 Setup Uninstalling the J-Link USB driver If J-Link / J-Trace is not properly recognized by Windows and therefore does not enu- merate, it make sense to uninstall the J-Link USB driver. This might be the case when: •... -
Page 27: Connecting The Target System
2.3.2 Verifying target device connection If the USB driver is working properly and your J-Link / J-Trace is connected with the host system, you may connect J-Link / J-Trace to your target hardware. Then start JLink.exe which should now display the normal J-Link / J-Trace related information and in addition to that it should report that it found a JTAG target and the target’s... -
Page 28: Scan Chain Configuration
IAR C-SPY® debugger, ARM’s AXD using RDI, a flash programming appli- cation such as SEGGER’s J-Flash, or any other application using J-Link / J-Trace. It is the application’s responsibility to supply a way to configure the scan chain. Most applications offer a dialog box for this purpose. - Page 29 This dialog can be found under RDI|Configure for example in IAR Embedded Work- bench®. For detailed information check the IAR Embedded Workbench user guide. IAR J-Link configuration dialog box This dialog can be found under Project|Options. J-Link / J-Trace User Guide © 1997 - 2007 SEGGER Microcontroller GmbH & Co. KG...
-
Page 30: Determining Values For Scan Chain Configuration
If only one device is connected to the scan chain, the default configuration can be used. In other cases, J-Link / J-Trace may succeed in automatically recognizing the devices on the scan chain, but whether this is possible depends on the devices present on the scan chain. -
Page 31: Jtag Speed
If you use the adaptive clocking feature, transmission delays, gate delays, and synchronization requirements result in a lower maximum clock frequency than with non-adaptive clocking. J-Link / J-Trace User Guide © 1997 - 2007 SEGGER Microcontroller GmbH & Co. KG... - Page 32 CHAPTER 2 Setup J-Link / J-Trace User Guide © 1997 - 2007 SEGGER Microcontroller GmbH & Co. KG...
-
Page 33: Link And J-Trace Related Software
This chapter describes Segger’s J-Link / J-Trace related software portfoliowhich cov- ers nearly all phases of the development of embedded applications. The support of the remote debug interface (RDI) and the J-Link GDBServer allows an easy J-Link integration in all relevant toolchains. -
Page 34: J-Link Related Software
J-Link and J-Trace related software J-Link related software 3.1.1 J-Link software and documentation package J-Link is shipped with a bundle of applications. Some of the applications require an additional license, free trial licenses are available upon request from www.seg- ger.com. Software Description JLinkARM.dll... -
Page 35: J-Link Software And Documentation Package In Detail
3.2.1 J-Link Commander (Command line tool) J-Link Commander (JLink.exe) is a tool that can be used for verifying proper instal- lation of the USB driver and to verify the connection to the ARM chip, as well as for simple analysis of the target system. It permits some simple commands, such as memory dump, halt, step, go and ID-check, as well as some more in-depths analysis of the state of the ARM core and the ICE breaker module. -
Page 36: J-Link Tcp/Ip Server (Remote J-Link / J-Trace Use)
The J-Link TCP/IP Server allows using J-Link / J-Trace remotely via TCP/IP. This enables you to connect to and fully use a J-Link / J-Trace from another computer. Performance is just slightly (about 10%) lower than with direct USB connection. -
Page 37: J-Flash Arm (Program Flash Memory Via Jtag)
However, to actually program devices via J-Flash ARM and J-Link / J-Trace you are required to obtain a license key from us. Evaluation licenses are available free of charge. For further information go to our website or contact us directly. -
Page 38: J-Link Rdi (Remote Debug Interface)
The J-Link RDI software is an remote debug interface for J-Link. It makes it possible to use J-Link with any RDI compliant debugger. The main part of the software is an RDI-compliant DLL, which needs to be selected in the debugger. There are two addi- tional features available which build on the RDI software foundation. - Page 39 How does this work? Basically, it is very simple the J-Link RDI software reprograms a sector of the flash to set or clear a breakpoint. What performance can I expect? A RAM code, specially designed for this purpose, sets and clears flash breakpoints extremely fast;...
-
Page 40: J-Link Gdb Server
GDB is freely available from the GNU commitee under: http://www.gnu.org/software/gdb/download/ J-Link GDB Server is distributed as "free for evaluation and non commercial use". The software can be used free of charge for educational and nonprofit purposes without additional license. -
Page 41: Additional Software Packages In Detail
The J-Link Software Developer Kit is needed if you want to write your own program with J-Link / J-Trace. The J-Link DLL is a standard Windows DLL typically used from C programs (Visual Basic or Delphi projects are also possible). It makes the entire... -
Page 42: Using The J-Linkarm.dll
What is the JLinkARM.dll? The J-LinkARM.dll is a standard Windows DLL typically used from C or C++, but also Visual Basic or Delphi projects. It makes the entire functionality of the J-Link / J- Trace available through the exported functions. -
Page 43: Determining Which Dll Is Used By A Program
Process Explorer. It shows you details about the DLLs, used by your program, such as manufacturer and version. Process Explorer is - at the time of writing - a free utility which can be downloaded from www.sysinternals.com. J-Link / J-Trace User Guide © 1997 - 2007 SEGGER Microcontroller GmbH & Co. KG... - Page 44 CHAPTER 3 J-Link and J-Trace related software J-Link / J-Trace User Guide © 1997 - 2007 SEGGER Microcontroller GmbH & Co. KG...
-
Page 45: Working With J-Link And J-Trace
Chapter 4 Working with J-Link and J-Trace This chapter describes functionality and how to use J-Link and J-Trace. J-Link / J-Trace User Guide © 1997 - 2007 SEGGER Microcontroller GmbH & Co. KG... -
Page 46: Supported Arm Cores
Working with J-Link and J-Trace Supported ARM Cores J-Link / J-Trace has been tested with the following cores, but should work with any ARM7/ARM9 and Cortex-M3 core. If you experience problems with a particular core, do not hesitate to contact Segger. -
Page 47: Reset Strategies
Some CPUs can actually be halted before executing any instruction, because the start of the CPU is delayed after reset release. If a pause has been specified, J-Link waits for the specified time before trying to halt the CPU. This can be useful if a bootloader which resides in flash or ROM needs to be started after reset. - Page 48 No reset is performed. Nothing happens. 4.2.1.5 Type 4: Hardware, halt with WP The hardware RESET pin is used to reset the CPU. After reset release, J-Link continu- ously tries to halt the CPU using a watchpoint. This typically halts the CPU shortly after reset release;...
-
Page 49: Cache Handling
4.3.4 Cache handling of ARM9 cores ARM9 cores with cache require J-Link / J-Trace to handle the caches during debug. If the processor enters debug state with caches enabled, J-Link / J-Trace does the fol- lowing: When entering debug state J-Link / J-Trace performs the following: •... -
Page 50: Connecting Multiple J-Links / J-Traces To Your Pc
• The product id (PID) for J-Link / J-Trace #2 is 102 and so on. A different PID means that J-Link / J-Trace is identified as a different device, requir- ing a new driver. The sketch below shows a host, running two application programs. Each application communicates with one ARM core via a separate J-Link. -
Page 51: Configuring Multiple J-Links / J-Traces
The system will recognize a new J-Link / J-Trace and will prompt for a driver. Click OK and browse to the J-Link USB driver for your new J-Link / J-Trace. For your second J-Link / J-Trace this would be JLink1.sys, for your third J-Link / J- Trace this would be JLink2.sys. -
Page 52: Connecting To A J-Link / J-Trace With Non Default Usb-Address
Connecting to a J-Link / J-Trace with non default USB- Address Restart JLink.exe and type usb 1 to connect to J-Link / J-Trace #1. You may connect other J-Links / J-Traces to your PC and connect to them as well. To connect to an unconfigured J-Link / J-Trace (with default address "0"), restart... -
Page 53: Multi-Core Debugging
Multi-core debugging J-Link / J-Trace is able to debug multiple cores on one target system connected to the same scan chain. Configuring and using this feature is described in this section. 4.5.1 How multi-core debugging works Multi-core debugging requires multiple debuggers or multiple instances of the same debugger. -
Page 54: Using Multi-Core Debugging In Detail
ARM core on your target. Start debugging the first core. Start another debugger, for example another instance of IAR Embedded Work- bench for ARM. J-Link / J-Trace User Guide © 1997 - 2007 SEGGER Microcontroller GmbH & Co. KG... - Page 55 #1 debugger #2 ARM7TDMI 0 ARM7TDMI ARM7TDMI-S ARM7TDMI ARM7TDMI ARM7TDMI ARM7TDM ARM7TDMI-S ARM7TDMI-S Table 4.1: Multicore debugging Cores to debug are marked in blue. J-Link / J-Trace User Guide © 1997 - 2007 SEGGER Microcontroller GmbH & Co. KG...
-
Page 56: Things You Should Be Aware Of
All cores share the same RESET line. You should be aware that resetting one core through the RESET line means resetting all cores which have their RESET pins con- nected to the RESET line on the target. J-Link / J-Trace User Guide © 1997 - 2007 SEGGER Microcontroller GmbH & Co. KG... -
Page 57: Multiple Devices In The Scan Chain
Multiple devices in the scan chain J-Link / J-Trace can handle multiple devices in the scan chain. This applies to hard- ware where multiple chips are connected to the same JTAG connector. As can be seen in the following figure, the TCK and TMS lines of all JTAG device are connected, while the TDI and TDO lines form a bus. -
Page 58: Using Dcc For Memory Access
This DCC handler typically requires less than 1 µs per call. The DCC handler, as well as the optional DCC abort handler, is part of the J-Link software package and can be found in the "Samples\DCC\IAR" directory of the pack- age. -
Page 59: Testing Dcc Memory Access
SEGGER J-Link Commander V3.38c ('?' for help) Compiled Aug 18 2006 18:48:43 DLL version V3.38c, compiled Aug 18 2006 18:48:40 -- Debug -- Firmware: J-Link compiled Aug 14 2006 14:58:04 ARM Rev.5 Hardware: V5.40 S/N : 1 VTarget = 3.306V... -
Page 60: Command Strings
Working with J-Link and J-Trace Command strings The behaviour of the J-Link can be customized via command strings passed to the JLinkARM.dll which controls J-Link. Applications such as the J-Link Commander, but also the C-SPY debugger which is part of the IAR Embedded Workbench, allow pass- ing one or more command strings. - Page 61 To avoid stalling the debug session, a critical memory area can be excluded from access: J-Link will not try to read or write to critical memory areas and instead ignore the access silently. Some debuggers (such as IAR C-SPY) can try to access memory in such areas by dereferencing non-initialized pointers even if the debugged program (the debuggee) is working perfectly.
- Page 62 This command defines the length of the RESET pulse in milliseconds. The default for the RESET pulse length is 20 milliseconds. Syntax SetResetPulseLen = <value> J-Link / J-Trace User Guide © 1997 - 2007 SEGGER Microcontroller GmbH & Co. KG...
- Page 63 Hardware, halt with BP@0. Software, for Analog Devices ADuC7xxx MCUs. Table 4.3: List of possible value for command SetResetType Syntax SetResetType = <value> Example SetResetType = 0 J-Link / J-Trace User Guide © 1997 - 2007 SEGGER Microcontroller GmbH & Co. KG...
-
Page 64: Using Command Strings
SupplyPower = 1 4.8.1.10 SupplyPowerDefault This command activates power supply over pin 19 of the JTAG connector perma- nently. The KS (Kickstart) versions of J-Link have the V5 supply over pin 19 acti- vated by default. Typical applications This feature is usefull for some eval boards that can be powered over the JTAG con- nector. - Page 65 4.8.2.2 IAR Embedded Workbench The J-Link command strings can be supplied using the C-SPY debugger of the IAR Embedded Workbench. Open the Project options dialog box and select Debugger. On the Extra Options page, select Use command line options. Enter --...
-
Page 66: Switching Off Cpu Clock During Debug
In this case, the CPU will stop at the first instruction in the ISR (typically at address 0x18). J-Link / J-Trace User Guide © 1997 - 2007 SEGGER Microcontroller GmbH & Co. KG... -
Page 67: Device Specifics
Chapter 5 Device specifics This chapter gives some additional information about specific devices. J-Link / J-Trace User Guide © 1997 - 2007 SEGGER Microcontroller GmbH & Co. KG... -
Page 68: Analog Devices
Analog ADuC7026x62 • Analog ADuC7027x62 • Analog ADuC7030 • Analog ADuC7031 • Analog ADuC7032 • Analog ADuC7033 • Analog ADuC7128 • Analog ADuC7129 • Analog ADuC7229x126 J-Link / J-Trace User Guide © 1997 - 2007 SEGGER Microcontroller GmbH & Co. KG... -
Page 69: Atmel
5.2.2.1 JTAG settings We recommend using adaptive clocking. This information is applicable to the following devices: • AT91RM9200 • AT91SAM9260 • AT91SAM9261 • AT91SAM9262 • AT91SAM9263 J-Link / J-Trace User Guide © 1997 - 2007 SEGGER Microcontroller GmbH & Co. KG... -
Page 70: Nxp
Indirectly reading solves the fast GPIO problem, because only direct regis- ter access corrupts the register contents. Define a 256 byte aligned area in RAM of the LPC target device with the J-Link com- mand map ram and define afterwards the memory area which should be read indirect with the command map indirectread to use the indirectly reading feature of J-Link. -
Page 71: St Microelectronics
All devices of this family are supported by J-Link. 5.4.4.1 Flash erasing The devices have 3 TAP controllers built-in. When starting J-Link exe, it reports 3 JTAG devices. A special tool, J-Link STR9 Commander is available to directly access the flash controller of the device. This tool can be used to erase the flash of the con- troller even if a program is in flash which causes the ARM core to stall. - Page 72 CHAPTER 5 Device specifics J-Link / J-Trace User Guide © 1997 - 2007 SEGGER Microcontroller GmbH & Co. KG...
-
Page 73: Hardware
Chapter 6 Hardware This chapter gives an overview about J-Link / J-Trace specific hardware details, such as the pinouts and available adapters. J-Link / J-Trace User Guide © 1997 - 2007 SEGGER Microcontroller GmbH & Co. KG... -
Page 74: Jtag Connector
Typically left open on target hardware. Table 6.1: J-Link / J-Trace pinout Pins 4, 6, 8, 10, 12, 14, 16, 18, 20 are GND pins connected to GND in J-Link. They should also be connected to GND in the target system. -
Page 75: Target Board Design For Jtag
6.1.2.1 Pull-up/pull-down resistors Unless otherwise specified by developer’s manual, pull-ups/pull-downs are recom- mended to be between 2.2 kOhms and 47 kOhms. J-Link / J-Trace User Guide © 1997 - 2007 SEGGER Microcontroller GmbH & Co. KG... -
Page 76: Using The Jtag Connector With Swd
Typically left open on target hardware. Table 6.2: J-Link / J-Trace SWD pinout Pins 4, 6, 8, 10, 12, 14, 16, 18, 20 are GND pins connected to GND in J-Link. They should also be connected to GND in the target system. -
Page 77: Jtag+Trace Connector
Target board Target board Target board Target board Trace JTAG Trace JTAG Trace JTAG connector connector connector connector connector connector Target board Target board Target board J-Link / J-Trace User Guide © 1997 - 2007 SEGGER Microcontroller GmbH & Co. KG... -
Page 78: Pinout
Trace signal 14 Trace signal. Trace signal 2 Trace signal. Trace signal 13 Trace signal. Trace signal 1 Trace signal. Table 6.3: JTAG+Trace connector pinout J-Link / J-Trace User Guide © 1997 - 2007 SEGGER Microcontroller GmbH & Co. KG... -
Page 79: Assignment Of Trace Information Pins Between Etm Architecture Versions
Min. Max. Explenation Tperiod 1000ns Clock period Fmax 1MHz 200MHz Maximum trace frequency 2.5ns High pulse width 2.5ns Low pulse width Table 6.5: Clock frequency J-Link / J-Trace User Guide © 1997 - 2007 SEGGER Microcontroller GmbH & Co. KG... - Page 80 J-Trace supports half-rate clocking mode. Data is output on each edge of the TRACECLK signal and TRACECLK (max) <= 100MHz. For half-rate clocking, the setup and hold times at the JTAG+Trace connector must be observed. J-Link / J-Trace User Guide © 1997 - 2007 SEGGER Microcontroller GmbH & Co. KG...
-
Page 81: Reset, Ntrst
'warm' resets, where the power to the device is maintained, will cause only the core reset to go LOW. J-Link / J-Trace User Guide © 1997 - 2007 SEGGER Microcontroller GmbH & Co. KG... -
Page 82: Adapters
Adapters 6.5.1 JTAG 14 pin adapter An adapter is available to use J-Link / J-Trace with targets using this 14 pin 0.1" mat- ing JTAG connector. The following table shows the mapping between the 14 pin adapter and the standard 20 pin JTAG interface. -
Page 83: Volt Adapter
JTAG probes) to 5V. Most targets have JTAG signals at voltage levels between 1.2V and 3.3V for J-Link and 3.0V up to 3.6V for J-Trace. These targets can be used with J-Link / J-Trace without a 5V adapter. Higher voltages are common primarily in the automotive sector. -
Page 84: How To Determine The Hardware Version
J-Links have the hardware version printed on the back label. If this is not the case with your J-Link, start JLink.exe. As part of the initial mes- sage, the hardware version is displayed. -
Page 85: Differences Between Different Versions
6.000 MHz (n = 8) 5.333 MHz (n = 9) 4.800 MHz (n = 10) Adaptive clocking is supported. Target Interface nTRST is push-pull type RESET is push-pull type J-Link / J-Trace User Guide © 1997 - 2007 SEGGER Microcontroller GmbH & Co. KG... - Page 86 5V target supply (pin 19) of Kick-Start versions of J-Link is current monitored and limited. J-Link automatically switches off 5V supply in case of over-current to protect both J-Link and host computer. Peak current (<= 10 ms) limit is 1A, operating current limit is 300mA.
-
Page 87: J-Link Oem Versions
In any case, it should be possible to use the J-Link software with these OEM versions. How- ever, proper function cannot be guaranteed for OEM versions. SEGGER Microcontrol- ler does not support OEM versions;... - Page 88 CHAPTER 6 Hardware J-Link / J-Trace User Guide © 1997 - 2007 SEGGER Microcontroller GmbH & Co. KG...
-
Page 89: Background Information
ARM9 architecture is based on Reduced Instruction Set Computer (RISC) principles. The instruction set and the related decode mechanism are greatly simplified com- pared with microprogrammed Complex Instruction Set Computer (CISC). J-Link / J-Trace User Guide © 1997 - 2007 SEGGER Microcontroller GmbH & Co. KG... -
Page 90: Jtag
The instruction register holds the current instruction and its content is used by the TAP controller to decide which test to perform or which data register to access. It consist of at least two shift-register cells. J-Link / J-Trace User Guide © 1997 - 2007 SEGGER Microcontroller GmbH & Co. KG... -
Page 91: The Tap Controller
Data may be loaded in parallel to the selected test data registers. Shift-DR The test data register connected between TDI and TDO shifts data one stage towards the serial output with each clock. J-Link / J-Trace User Guide © 1997 - 2007 SEGGER Microcontroller GmbH & Co. KG... - Page 92 Once latched, this new instruction becomes the cur- rent one. The parallel latch prevents changes at the parallel output of the instruction register from occurring during the shifting process. J-Link / J-Trace User Guide © 1997 - 2007 SEGGER Microcontroller GmbH & Co. KG...
-
Page 93: The Arm Core
Table 7.3: Registers of the ARM core = indicates that the normal register used by User or System mode has been replaced by an alternative register specific to the exception mode. J-Link / J-Trace User Guide © 1997 - 2007 SEGGER Microcontroller GmbH & Co. KG... -
Page 94: Arm / Thumb Instruction Set
Thumb mode can actually be as fast or faster than ARM mode. Mixing ARM and Thumb code (interworking) is possible. J-Link / J-Trace fully supports debugging of both modes without limitation. J-Link / J-Trace User Guide © 1997 - 2007 SEGGER Microcontroller GmbH & Co. KG... -
Page 95: Embeddedice
This does not work when debugging programs located in ROM or flash, but has one huge advantage: The number of software breakpoints is not limited. J-Link / J-Trace User Guide © 1997 - 2007 SEGGER Microcontroller GmbH & Co. KG... -
Page 96: The Ice Registers
Watchpoint 1 control mask Table 7.4: Function and mapping of EmbeddedICE registers For more information about EmbeddedICE, see the technical reference manual of your ARM CPU. (www.arm.com) J-Link / J-Trace User Guide © 1997 - 2007 SEGGER Microcontroller GmbH & Co. KG... -
Page 97: Embedded Trace Macrocell (Etm)
J-Trace can be seamlessly integrated into the IAR Embedded Workbench® IDE. The advanced trace debugging features can be used with the IAR C-SPY debugger. J-Link / J-Trace User Guide © 1997 - 2007 SEGGER Microcontroller GmbH & Co. KG... -
Page 98: Embedded Trace Buffer (Etb)
No additional special trace port is required, so that the ETB can be read via J-Link. The trace functionality via J-Link is is limited by the size of the ETB. While capturing runs, the trace information in the buffer will be overwritten every time the buffer size has been reached. -
Page 99: Flash Programming
Flash programming J-Link / J-Trace comes with a DLL, which allows - amongst other functionalities - reading and writing RAM, CPU registers, starting and stopping the CPU, and setting breakpoints. The standard DLL does not have API functions for flash programming. - Page 100 RDI, (Remote debug interface) is a standard for "debug transfer agents" such as J- Link. It allows using J-Link from any RDI compliant debugger. RDI by itself does not include download to flash. To debug in flash, you need to somehow program your application program (debuggee) into the flash.
-
Page 101: J-Link / J-Trace Firmware
Every time you connect to J-Link / J-Trace, JLinkARM.dll checks if its embedded firm- ware is newer than the one used the J-Link / J-Trace. The DLL will then update the firmware automatically. This process takes less than 3 seconds and does not require a reboot. - Page 102 JLinkARM.dll. This automatically replaces the invalidated firmware with its embedded firmware. In the screenshot: • The red box identifies the new firmware. • The green box identifies the old firmware which has been replaced. J-Link / J-Trace User Guide © 1997 - 2007 SEGGER Microcontroller GmbH & Co. KG...
-
Page 103: Designing The Target Board For Trace
Chapter 8 Designing the target board for trace This chapter descirbes the hardware requirements which have to be met by the tar- get board. J-Link / J-Trace User Guide © 1997 - 2007 SEGGER Microcontroller GmbH & Co. KG... -
Page 104: Overview Of High-Speed Board Design
The decision is related to track length between the ASIC and the JTAG+Trace connector, see Terminating the trace signal on page 105 for further ref- erence. J-Link / J-Trace User Guide © 1997 - 2007 SEGGER Microcontroller GmbH & Co. KG... -
Page 105: Terminating The Trace Signal
Care must be taken not to connect devices in this way, unless the distor- tion does not affect device operation. J-Link / J-Trace User Guide © 1997 - 2007 SEGGER Microcontroller GmbH & Co. KG... -
Page 106: Signal Requirements
Ts setup time (min.) 2.0ns Th hold time (min.) 1.0ns TRACECLK high pulse width (min.) 1.5ns TRACECLK high pulse width (min.) 1.5ns Table 8.1: Signal requirements J-Link / J-Trace User Guide © 1997 - 2007 SEGGER Microcontroller GmbH & Co. KG... -
Page 107: Support And Faqs
Support and FAQs This chapter contains troubleshooting tips together with solutions for common prob- lems which might occur when using J-Link / J-Trace. There are several steps you can take before contacting support. Performing these steps can solve many problems and often eliminates the need for assistance. -
Page 108: Troubleshooting
12. Start JLink.exe. 13. If JLink.exe displays the J-Link / J-Trace serial number and the target proces- sor’s core ID, the J-Link / J-Trace is working properly and cannot be the cause of your problem. 14. If JLink.exe is unable to read the target processor’s core ID you should analyze the communication between your target and J-Link / J-Trace with a logic analyzer or oscilloscope. - Page 109 J-Link/J-Trace does not get any connection to the target Most likely reasons: a.) The JTAG cable is defective. b.) The target hardware is defective. Remedy: Follow the steps described in section 9.1.1. J-Link / J-Trace User Guide © 1997 - 2007 SEGGER Microcontroller GmbH & Co. KG...
-
Page 110: Signal Analysis
J-Link / J-Trace and the target device. 9.2.1 Start sequence This is the signal sequence output by J-Link / J-Trace at start of JLink.exe. It should be used as reference when tracing potential J-Link / J-Trace related hardware prob- lems. -
Page 111: Contacting Support
General procedure on page 108. You may also try your J-Link / J-Trace with another PC and if possible with another target system to see if it works there. If the device functions correctly, the USB setup on the original machine or your target hardware is the source of the problem, not J-Link / J-Trace. -
Page 112: Frequently Asked Questions
Can J-Link / J-Trace read back the status of the JTAG pins? Yes, the status of all pins can be read. This includes the outputs of J-Link / J-Trace as well as the supply voltage, which can be useful to detect hardware problems on the target system. -
Page 113: Glossary
Chapter 10 Glossary This chapter describes important terms used throughout this manual. J-Link / J-Trace User Guide © 1997 - 2007 SEGGER Microcontroller GmbH & Co. KG... - Page 114 Glossary Adaptive clocking A technique in which a clock signal is sent out by J-Link / J-Trace. J-Link / J-Trace waits for the returned clock before generating the next clock pulse. The technique allows the J-Link / J-Trace interface unit to adapt to differing signal drive capabilities and differing cable lengths.
- Page 115 A signal that may be actively driven LOW by one or more drivers, and is otherwise passively pulled HIGH. Also known as a "wired AND" signal. J-Link / J-Trace User Guide © 1997 - 2007 SEGGER Microcontroller GmbH & Co. KG...
- Page 116 The electronic clock signal which times data on the TAP data lines TMS, TDI, and TDO. The electronic signal input to a TAP controller from the data source (upstream). Usu- ally, this is seen connecting the J-Link / J-Trace Interface Unit to the first TAP control- ler. J-Link / J-Trace User Guide...
- Page 117 The electronic signal output from a TAP controller to the data sink (downstream). Usually, this is seen connecting the last TAP controller to the J-Link / J-Trace Inter- face Unit. Test Access Port (TAP) The port used to access a device's TAP Controller. Comprises TCK, TMS, TDI, TDO, and nTRST (optional).
- Page 118 CHAPTER 10 Glossary J-Link / J-Trace User Guide © 1997 - 2007 SEGGER Microcontroller GmbH & Co. KG...
-
Page 119: Literature And References
Chapter 11 Literature and references This chapter lists documents, which we think may be useful to gain deeper under- standing of technical details. J-Link / J-Trace User Guide © 1997 - 2007 SEGGER Microcontroller GmbH & Co. KG... - Page 120 [RVI] Trace User Guide, ARM DUI ments on the target side. 0155C It is publicly available from ARM (www.arm.com). Table 11.1: Literature and Refernces J-Link / J-Trace User Guide © 1997 - 2007 SEGGER Microcontroller GmbH & Co. KG...
- Page 121 Memory Protection Unit (MPU) .....115 Halfword ........... 114 Multi-ICE ..........115 Host ..........114 nTRST ........74, 115 ICache ..........114 ICE Extension Unit ......114 ID ........... 115 J-Link / J-Trace User Guide © 2004 - 2007 SEGGER Microcontroller GmbH & Co. KG...
- Page 122 TDI ..........74, 116 TDO ........... 74, 117 Test Access Port (TAP) ......117 Transistor-transistor logic (TTL) ... 117 Watchpoint ........95, 117 Word ..........117 J-Link / J-Trace User Guide © 2004 - 2007 SEGGER Microcontroller GmbH & Co. KG...
Need help?
Do you have a question about the J-Link and is the answer not in the manual?
Questions and answers