Sierra InnovaSonic 210 Instruction Manual
Ultrasonic flow meter
Hide thumbs
Also See for InnovaSonic 210:
- Quick install manual (5 pages) ,
- Quick install manual (4 pages)
Table of Contents
Advertisement
Quick Links
Advertisement
Table of Contents

Related Manuals for Sierra InnovaSonic 210


Summary of Contents for Sierra InnovaSonic 210
- Page 1 InnovaSonic Model 210 ® Instruction Manual Version IM-210, Rev. K, July 2018 ...
- Page 2 IMPORTANT CUSTOMER NOTICE: OXYGEN SERVICE Sierra Instruments, Inc. is not liable for any damage or personal injury, whatsoever, resulting from the use of Sierra Instruments standard mass flow meters or controllers for oxygen gas. You are responsible for determining if this mass flow meter or controller is appropriate for your oxygen application. You are responsible for cleaning the mass flow meter or controller to the degree required for your oxygen flow ...
- Page 3 NOTICE Thank you for choosing the 210 Ultrasonic Flow meter with SLSI CMOS and low‐voltage wide‐pulse transmission technology. This instruction manual contains important information. Please read carefully before operating the flow meter. WARNINGS IN THIS MANUAL Caution and warning statements are used throughout this manual to draw your attention to important information. WARNING “Warning” statement appears with information that is important to protect people and equipment from harm or damage. Pay very close attention to all warnings that apply to your application. Failure to comply with these instructions may damage the meter. ATTENTION Failure to comply with these instructions may result in faulty operation. NOTE “Note” indicates that ignoring the relevant requirements or precautions may result in flow meter damage or malfunction. ...
- Page 4 Product Components An inspection should be made of the desired location before installing the flow meter. Check to see if the parts are present in accordance with the packing list. Make sure that there is no shipping damage. If you have any questions, please contact your representative as soon as possible. ...
-
Page 5: Table Of Contents
Table of Contents ELECTRONICS INSTALLATION AND CONNECTION ......................7 ............................. 7 1.1. OWER UPPLY ONNECTIONS 1.1.1. Type of Power Supply ........................... 7 1.1.2. Wiring ................................7 ................................7 1.2. OWERING ..............................8 1.3. EYPAD UNCTIONS ..............................8 ... - Page 6 5.7.3. Reading the SD Data Externally ........................ 25 5.7.4 SD Card Storage Operation ........................26 ESN ..................................27 5.8. WINDOW DISPLAY EXPLANATIONS ..........................28 ............................28 6.1. INDOW ISPLAY ODES .............................. 29 6.2. ISPLAY XPLANATION ERROR DIAGNOSTICS ..............................44 ...
-
Page 7: Electronics Installation And Connection
1. Electronics Installation and Connection 1.1. Power Supply Connections 1.1.1. Type of Power Supply The meter has a rechargeable 11.1V Lithium battery and matching battery charger. 1.1.2. Wiring Open the hinged top cover of the electronics. Shown from left to right on the panel of the 210 are the downstream transducer connector, upstream transducer connector, the battery recharge port (charge the transmitter or connect to a standby power supply), and the 4~20mA output connector. WARNING Wiring connections should be made when power is off. 1.2. Powering On As soon as the flow meter is switched on, the self‐diagnostics program will start to run. If any error is detected, an error code will displayed on the screen (see Error Diagnostics). After that, the system will run automatically using the programmed parameters. All the parameters put in by the user will be saved permanently until they are changed by the user. ... -
Page 8: Keypad Functions
1.3. Keypad Functions The InnovaSonic 210 keypad offers 12 dual‐function keys for operation of the menu system plus six quick‐setup keys. For quick setup of your InnovaSonic, simply press any of the keys across the top to get the desired menu instantly. Follow these guidelines when using the flow meter keypad: ‐ and to input numbers. Backspace or delete characters to the left. and Return to the last menu or open the next menu. Acts as "+" and "‐" when used to enter numbers. Select a menu. Press this key first, input a two‐digit menu number and the selected menu data will be displayed. For example, ... -
Page 9: Flow Meter Menu Descriptions
Visit Data Type menus to check specific parameters. If you need to change a parameter, just input the values then press ; or press first, then input the values and press to confirm. Example 1: To enter a pipe outer diameter of 168mm, the procedure is as follows: Press to enter Menu11 (the numerical value currently displayed is the previous pipe outer diameter). Now press the key. The symbol “>” and a flashing cursor is displayed on the left side of the third line . on the screen. The new value can now be entered. Visit Selection Type menus to check the related options. If you need to modify them, press ... -
Page 10: Setup And Display Shortcuts
2. Setup and Display Shortcuts 2.1. Quick Display Keys Press to display Flow Rate with large font. Press to display Velocity with large font. Press to display Signal Quality with large font. Press to display POS Total with large font. ... -
Page 11: Quick Set Up Keys
Press to graph Flow Rate and Flow Velocity. Press to display the Current State of the System. 2.1. Quick Set up Keys Press to display Pipe Outside Diameter. The function is the same as . Press enter to input data, then enter again to save data. Press to display Pipe Wall Thickness. The function is the same as . Press enter to input data, then enter again to save data. ... - Page 12 Press to display Pipe Material. The function is the same as . Press enter to input data, then press enter again to save data. Press to display Fluid Type. The function is the same as . Press enter to input data, then press enter again to save data. Press to display Transducer Mounting Methods. The function is the same as . Press enter to input data, then press enter again to save data. Press to Start / Stop Manual Totalizer ...
- Page 13 Press to Display / Hold flow totalizer in turn. The totalizer will continue to run in the background if hold is pressed. This function allows you to quickly write down or show the totalized value to another. Press to display Dynamic / Normal Flow Rate and Flow Velocity. Press to display Fluid Sound Velocity. The function is the same as . Press to display Date and Time. The function is the same as . ...
-
Page 14: Illustrations
Press to enter Manual Calibrate. Under constant velocity conditions: 1. Using a flow standard, externally totalize the flow for a set time period. 2. Press cal, then press enter to start the totalizer. 3. Totalize for the same time period as in step 1, then press enter to stop the totalizer. 4. Press enter again, then enter the totalized flow from step 1. 5. The 210 will compare the two values and calculate a K factor. Press to input the password 1234 to reset zero. 2.2. Illustrations For Example: Let us assume you have a DN150 (6") pipe. The measuring medium is water and material is carbon steel with no liner. These parameters should be operated as follows: Step 1. Pipe Outer Diameter Press keys to enter Menu 11, enter the Pipe Outside Diameter, then press the key. Press enter to input data, then press enter again to save data. ... - Page 15 Step 3. Pipe Material Press the key to enter Menu 14, press the key, use the or key to select the pipe material from the drop‐down menu, then press the key. Step 4. Liner Material Parameters (including thickness and sound velocity, if needed): Press the key to enter Menu 16, press the key, use the or key to select liner material from the drop‐down menu, and then press the ...
- Page 16 Step 7. Transducer Spacing Press the key to enter Menu 25, accurately install the transducer according to the displayed transducer mounting spacing and the selected mounting method. (Details on Chapter 2.3). Step 8. Display Measurement Results Press to enter Menu 01 to display flow rate. (Subject to the real measurement) ...
-
Page 17: Measurement Site Selection
3. Measurement Site Selection When selecting a measurement site, it is important to select an area where the fluid flow profile is fully developed to guarantee a highly accurate measurement. Use the following guidelines to select a proper installation site: 1. Choose a section of pipe that is always full of liquid, such as a vertical pipe with flow in the upward direction or a full horizontal pipe. 2. Ensure enough straight pipe length at least equal to the figure shown below for the upstream and downstream transducers installation. Straight length of upstream Straight length of Name piping downstream piping L ≥5D L ≥10D bend Detector L ≥10D L ≥50D 10D min L≥5D L ≥30D Diffuser 5D min L≥10D L ≥5D... -
Page 18: Transducer Installation
4. Transducer Installation 4.1. Installing the Transducers Before installing the transducers, clean the pipe surface where the transducers are to be mounted. Remove any rust, scale or loose paint and make a smooth surface. Apply a wide band of sonic coupling compound down the center of the face of each transducer as well as on the pipe surface, and then attach the transducers to the pipe with the straps provided and tighten them securely. Note: 1. The two transducers should be mounted at the pipe’s centerline on horizontal pipes. Make sure that the transducer mounting direction is parallel with the flow. 2. During the installation, there should be no air bubbles or particles between the transducer and the pipe wall. On horizontal pipes, the transducers should be mounted in the 3 o’clock and 9 o’clock positions of the pipe section in order to avoid any air bubbles inside the top portion of the pipe. 3. Refer to Transducer Mounting on Menu 25. ... -
Page 19: Z Method
Side View Section Top View Upstream Transducer Transducer Flow Transducer Space Downstream Transducer Pipe Strap 4.1.3. Z Method The signal transmitted in a Z method installation has less attenuation than a signal transmitted with the V method. This is because the Z method utilizes a directly transmitted (rather than reflected) signal which transverses the liquid only once. The Z method is able to measure on pipe diameters ranging from 25mm to 1200mm (1”~48”). Side View Section Top View Upstream Transducer Transducer Flow Transducer Spacing Downstream Transducer Pipe Strap ... -
Page 20: Mounting The Transducers
4.2. Mounting the Transducers Transducers can stick onto the pipe with magnetic steel racks. If you need to fasten them more securely, then you can . use the hose clamps or even zip ties … See picture below 4.3. Transducer Mounting Inspection Check to see if the transducer is installed properly and if there is an accurate and strong enough ultrasonic signal to ensure proper operation and high reliability of the transducer. It can be confirmed by checking the detected signal strength, total transit time, delta time as well as transit time ratio. These checks are explained below. The “mounting” condition directly influences the flow value accuracy and system reliability. In most instances, apply a wide bead of sonic coupling compound lengthwise on the face of the transducer and stick it to the outside pipe wall to get good measurement results. However, the following inspections still need to be carried out in order to ensure high ... -
Page 21: Signal Quality (Q Value)
4.2.2. Signal Quality (Q value) Q value is short for Signal Quality (displayed in Menu 90). It indicates the level of the signal detected. Q value is indicated by numbers from 00~99. 00 represents the minimum signal detected while 99 represent the maximum. The transducer position should be adjusted and enough coupling used to get the signal quality detected as strong as possible . 4.2.3. Total Time and Delta Time “Total Time and Delta Time” are displayed in Menu 93. The measurement calculations in the flow meter are based upon these two parameters. Therefore, when “Delta Time” fluctuates widely, the flow and velocities fluctuate accordingly. This means that the signal quality detected is poor. It may be the result of poor pipe‐installation conditions, inadequate transducer installation or incorrect parameter input. Generally, “Delta Time” fluctuation should be less than ±20%. Only when the pipe diameter is too small or velocity is too low can the fluctuation be wider. 4.2.4. Transit Time Ratio Transit Time Ratio indicates if the transducer mounting spacing is accurate. The normal transit time ratio should be 100±3 if the installation is proper. Check Menu 91. This s an important value and must be within the limits before the strength and quality will be meaningful. To bring this value into this window of +/‐ 0.3%, move one of the transducers in or out. ATTENTION If the transit time ratio is over 100±3, it is necessary to check: 1) If the parameters (pipe outside diameter, wall thickness, pipe material, liner, etc.) have been entered correctly, ... - Page 22 Pay special attention to those pipes formed by steel rolls (pipe with seams), since such pipe is always irregular. If the signal strength is always displayed as 0.00, that means there is no signal detected. Thus, it is necessary to check that the parameters (including all the pipe parameters) have been entered accurately. Check to be sure the transducer mounting method has been selected properly, the pipe does not have heavy scaling, and the liner is not too thick. Make sure there is indeed fluid in the pipe or the transducer is not very close to a valve or elbow, and/or there are not too many air bubbles in the fluid. Once you have ruled out all these possible reasons, if there is still no signal detected, the measurement site has to be changed . ...
-
Page 23: Operating Instructions
Operating Instructions 5.1. System Normal Identification Press the keys. If the letter “*R” displays on the screen, it indicates System Normal. If the letter “E” is displayed, it indicates that the current loop output is over ranged by 120%. This refers to the settings in Menu 57. Enter a larger value in Menu 57, and the letter “E” will disappear. It can be ignored if no current loop output is used. If the letter “H” is displayed, it indicates that the ultrasonic signal detected is poor. For more information, please refer to “Error Diagnosis”. If the letter “G” is displayed, it indicates that system is adjusting the signal gain prior to the measurement. Also, it means system normal. If the adjustment takes too long without stopping, the system can be identified as abnormal. Letter “I” indicates no signal is being detected. Check to see if the transducer wiring connections are correct, the transducers are securely installed, etc. Letter “J” indicates a hardware defect exists. Normally, such a defect is temporary; it may be eliminated by system reboot (power off and restart). For further information, please refer to “Error Diagnosis”. 5.2. Low Flow Cutoff Value The data in Menu 41 is the Low Flow Cutoff Value. If the flow rate falls below the low flow cutoff value, the flow rate is driven to zero. This function can prevent the flow meter from reading flow after a pump is shut down but there is still liquid movement in the pipe, which will result in a totalization error. Generally, 0.03m/s is recommended to enter as the low flow cutoff point. The low flow cutoff value has no relation to the measurement results once the velocity increase ... -
Page 24: M A Current Loop Output
5.5. 4‐20mA Current Loop Output The 210 comes with a cable that plugs into the 4~20 mA output connector on the front panel. The black wire is 4~20 mA ‐ and the blue wire is 4~20 mA +. This is an active 4~20 mA output; do not apply an excitation voltage. The brown and white wires are unused. The current loop output exceeds an accuracy of 0.1%, and the flow meter is programmable and configurable with outputs such as 4 ~20mA or 0~20mA selected in Window M55. For details, please refer to “Window Display Explanations”. In Window M56, enter a 4mA flow value. Enter the 20mA flow value in Window M57. For example, if the flow range in a specific pipe is 0~1000m3/h, enter 0 in Window M56 and 1000 in Window M57. If the flow ranges from ‐ 1000~0~2000m3/h, configure the 20~4~20mA output by selecting Window M55 when flow direction is not an issue. ... -
Page 25: Sd Card Operation
5.7. SD Card Operation 5.7.1. Specifications Memory: 2 GB (Standard) Data collection update rate: user selectable: 1 second to 60 seconds. If the rate is set longer than 60 seconds the default will be 60 seconds. Every data point is a snapshot, not an average. Data content: date and time, flow, velocity, totalized flow, positive totalizer and negative totalizer. Data collection time: user selectable from 1~2880 mins (48 hours). If it is set is longer than 2880 mins, it will default to 2880 mins. This is the total collection time. Collection will stop at this point and the screen will prompt for the next instruction –either save, or begin again and overwrite. Collection can be paused at any time, and restarted manually until the total time is complete. Data storage format: 1=07‐04‐10, 14:16:33 2=+3.845778E+01m3/h 3=+1.451074E+00m/s 4=‐0000010E+0m3 5=+0000002E+0m3 6=‐0000012E+0m3 File system format: FAT16 File type: plain text file (.txt) File capacity: 512 filles. This is a FAT 16 constraint, a larger capacity SD card will not increase the number of files. Filename format: yymmdd (yy ‐ year, mm ‐ month, dd ‐ day) Turn to Chapter 5.7.4 for details if want to change a filename. It can save 120 bytes of data each time. When the capacity of the SD card is full, the new data will override the earliest files automatically (it will rollover). NOTE: The data is stored in metric units ONLY. This cannot be changed. The data can be cut and pasted into excel and manipulated (converted to other units) if required. 5.7.2. -
Page 26: Sd Card Storage Operation
File Converter Tool (Click “offline” bottom to enter the document conversion interface) Press “Converter” button and then convert the SD card data format from “.TXT “to “.XLS”, see below : 5.7.4 SD Card Storage Operation 1. Insert the SD card, then press data button to enter the SD card storage setting interface. 2. If you need to modify the file name, acquisition time or acquisition interval, press enter, then enter the number to modify it, then press enter again to save. Press or button for line feed. ... -
Page 27: Esn
3. After modification or to use the default value, scroll to start and press to begin the data collection. The above picture shows the normal, active data collection screen. Below is the data collection set up screen. Note: The screen will remain captive during data collection. 4. To pause data collection, chose “Stop,” to restart, press “Start.” To finish, press “Stop,” then “OK.” 5.8. ESN We have provided the flow meter with a unique electronic serial number to identify each flow meter for the convenience of the manufacturer and customers. The ESN, instrument types and versions are shown in Window M61. ... -
Page 28: Window Display Explanations
6. Window Display Explanations 6.1. Window Display Codes Flow Totalizer Display 37 Totalizer Reset 00 Flow Rate/Net Totalizer 38 Manual Totalizer 01 Flow Rate/Velocity Setup Options 02 Flow Rate/POS Totalizer 40 Damping 03 Flow Rate/NEG Totalizer 41 Low Flow Cutoff Value 04 Date Time/Flow Rate 42 Set Zero 08 System Error Codes 43 Reset Zero 09 Net Flow Today 44 Manual Zero Point Initial Parameter setup 45 Scale Factor 10 Pipe Outer Perimeter 49 Segmented Correction ... -
Page 29: Display Explanation
6.2. Display Explanation Menu00 Flow Rate/Net Totalizer Display flow rate and net Totalizer. Flow 30280m3/m *R If the net Totalizer has been turned off (refer to Window +22435575x1m3 M34), the net Totalizer value displayed is the total that existed prior to turning it off. 14 : 42 : 42 Q = 97 R Flow Rate/Velocity Menu 01 Display flow rate and velocity. Flow 30280m3/h *R 0.3863 m/s 14 : 43 : 02 Q = 97 R ... - Page 30 Menu 04 10 ‐ 03 ‐ 08 14 : 48 : 59 *R Flow 30280m3/h Date Time/Flow Rate 14 : 48 : 59 Q = 97 R Display the current date time and flow rate. The time setting method is found in Window M60. System Error Codes Menu 08 Display ...
- Page 31 Menu 11 Pipe Outside Diameter Enter the pipe outside diameter; the pipe outside Pipe Outer Diameter diameter must range from 10mm to 600mm. 3.14159 mm Note: Enter either the pipe outside diameter or pipe 14 : 53 : 30 Q = 00 outer perimeter. Pipe Wall Thickness Enter the pipe wall thickness with a leading zero. If the Menu 12 pipe inside diameter is already known, skip this window ...
- Page 32 Refer to item 9 “Other”; it is possible to enter other materials, which are not included in previous eight items. Once item 9 is selected, the relevant pipe sound velocity must be entered in Window M15. If sound velocity is not known, there are other ways to determine it onsite. Pipe Sound Velocity Enter pipe sound velocity. This function is only used when Menu 15 item 9 “Other” is selected in Window M14. Unless other Pipe Sound Velocity is selected as above, this window cannot be changed but will be calculated automatically according to the existing 0 m/s parameters. 14 : 55 : 00 ...
- Page 33 Liner Thickness Enter liner thickness. It only can be visited when a liner is selected in Window M16. Select Fluid Type The following options are available: 0. W ater 1. S ea Water Menu 20 2. K erosene Fluid Type 3. G asoline 4. F uel Oil Water ...
- Page 34 Transducer Mounting Menu 24 Three mounting methods are available: Transducer Mounting 0. V (sound wave bounces 2 times) 1. Z (sound wave bounces once. The most commonly used method) 14 : 56 : 20 Q = 97 2. N (small pipe, sound wave bounces 3 times) Note this adjustment can be fine tuned. Transducer Spacing (This value is calculated by the flow meter) Transducer Spacing The operator must mount the transducer according to 514.603mm ...
- Page 35 Menu 27 Cross‐Sectional Area Cross ‐ sectional Area Display the cross‐sectional area inside the pipe. 271547 mm2 14 : 57 : 20 Q = 97 Menu 28 Holding with PoorSig Holding With Poor Sig Select “Yes” to hold last good flow signal displayed if the flow meter experiences a poor temporary signal 14 : 57 : 40 Q = 97 condition. ...
- Page 36 Flow Rate Units Options The following flow rate units are available: Menu 31 Cubic Meters (m3) Liters (L) Flow Rate Units USA Gallons (GAL) Imperial Gallons (Imp gal) m3/m Million Gallons (mg) 14 : 59 : 10 Q = 97 Cubic Feet (cf) USA Barrels (US bbl) Imperial Barrels (Imp bbl) Oil Barrels (Oil bbl) The following time units are available: /Day /Hour /Min /Sec Factory default is Cubic Meters/hour. ...
- Page 37 ON/OFF POS Totalizer On/Off positive totalizer. “ON” indicates the flow meter starts to totalize. When it is turned off, the positive totalizer is displayed in Window M02. Factory default is “ON”. ON/OFF NEG Totalizer Menu 36 On/Off negative totalizer. “ON” indicates the totalizer is NEG Totalizer turned on. When it is turned off, the negative totalizer displays in Window M03. Factory default is “ON”. 15 : 01 : 20 Q = 97 Menu ...
- Page 38 Manual Totalizer The manual totalizer is a separate totalizer. Press to Menu 38 start, and press to stop it. It is used for flow measurement and calculation. Manual Totalizer Press ENT When Ready 15 : 01 : 58 Q = 97 Damping Menu 40 The ...
- Page 39 Press , wait for the processing instructions at the bottom right corner of the display to reach 0. Performing set zero with existing flow may cause the flow to be displayed as “0”. If so, it can be recovered via Window M43. M enu 43 Reset Zer o Reset Zero Select “YES”; reset “Zero Point” which was set by the user. 15:02:58 Q=97 M enu 44 Manual Zero Point M anual Zer oPoi nt This method is not commonly used. It is only suitable for ...
- Page 40 System Lock Lock the instrument. Once the system is locked, any modification to the system is prohibited, but the parameter is readable. "Unlock" using your designated password. The password is composed of 6 numbers. Segmented Correction This is a polynominal style linearity adjustment with 16 groups of 16 correction coefficients for sectionally correcting measurement results. To use this you need to input the password "115800", then press key to expand the menu. The user can input 16 actual scale factor, referring to his calibration results across the flow ...
- Page 41 20mA Output Value Set the CL output value according to the flow value at 20mA. The flow unit is the same as that found in Window M31. Once “velocity 4~20mA”is selected in Window M55, the unit should be set as m/s, if m/s is the velocity selection. Menu 58 CL Check Verification Check if the current loop has been calibrated before CL Checkup leaving ...
- Page 42 Beeper Setup Set up the beeper ON/OFF state. ON Beeper ON OFF Beeper OFF Signal Strength and Signal Quality Display the measured signal strength and signal quality Q value upstream and downstream. Signal strength is indicated from 00.0~99.9. A reading of 00.0 indicates no signal detected, while 99.9 indicates maximum signal strength. Normally the signal strength should be ≥60.0. Signal quality Q is indicated by 00~99. Therefore, 00 indicates the poorest signal while 99 ...
- Page 43 Total Time and Delta Time Menu 93 Display the measured ultrasonic average time (unit: nS) Totl Time, Delta Time and delta time of the upstream and downstream (unit: nS) time. The velocity calculation in the flow meter is based 0.0000uS , ‐ 1357.0nS on the two readings. The delta time is the best indication that the instrument is running steadily. 15 : 08 : 13 Q = 97 Normally ...
-
Page 44: Error Diagnostics
7. Error Diagnostics The ultrasonic flow meter has advanced self‐diagnostics functions and displays any errors in the upper right corner of the LCD via definite codes in a date/time order. Hardware error diagnostics are usually performed upon each power on. Some errors can be detected during normal operation. Undetectable errors caused by incorrect settings and unsuitable measurement conditions can be displayed accordingly. This function helps to detect the errors and determine causes quickly; thus, problems can be solved in a timely manner according to the solutions listed in the following tables. Errors displayed in the flow meter are divided into two categories: Table 1 is for errors displayed during self‐diagnostics upon power on. “*F” may be displayed on the upper left corner of the screen after entering the measuring mode. When this occurs, it is necessary to power on for self‐diagnostics once again to detect and solve possible errors using the table below. If a problem still exists, please contact the factory or the factory’s local representative for assistance. Table 2 applies when errors caused by incorrect settings and signals are detected and are announced by error codes displayed in Window M08. 7.1. Table 1. Self‐diagnosis and Error Solutions (upon power on) LCD Display Cause Solution Rom Parity Error * System ROM illegal or error * Contact the factory * Power on again or contact the Stored Data Error * System stored data block error factory * Power on again or contact the SCPU Fatal Error ... - Page 45 factory * Power on again or contact the Time or Bat Error * System date time chip error factory No Display, Erratic or Abnormal * Bad wiring connection * Check wiring connections Operation ...
- Page 46 7.2. Table 2. Error Codes and Solutions (during operation) Code M08 Display Cause Solution System Normal *R * System normal * No errors SCPU Fatal Error *J * Hardware defect * Contact the factory * Attach transducer to the pipe and tighten it securely. Apply a plenty of coupling compound * Signal not detected on transducer and pipe wall. * Spacing is not correct between the * Remove any rust, scale, or loose paint from the transducers or not enough coupling pipe surface. Clean it with a file. ...
-
Page 47: Frequently Asked Questions And Answers
Pipe Empty. Set in Once fluid is detected in the pipe, set 0 in * *K * No fluid in pipe or settings incorrect. Window M29 Window M29. 7.3. Frequently Asked Questions and Answers Question: New pipe, high quality material, and all installation requirements met: why still no signal detected? Answer: Check pipe parameter settings, installation method and wiring connections. Confirm if the coupling compound is applied adequately, the pipe is full of liquid, transducer spacing agrees with the screen readings and the transducers are installed in the right direction. ... -
Page 48: Product Overview
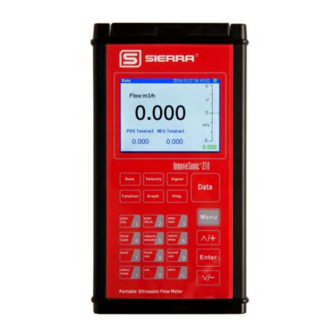
8. Product Overview Introduction The model 210 handheld ultrasonic flow meter is a state‐of‐the‐art universal transit‐time flow meter designed using SLSI technology and low‐voltage broadband pulse transmission. While principally designed for clean liquid applications, the instrument is tolerant of liquids with the small amounts of air bubbles or suspended solids found in most industrial environments. Features of Flow meter With distinctive features such as high precision, high reliability, high capability and low cost, the flow meter features other advantages: 1) Use of an SLSI COMA chip means low power consumption, high reliability and anti‐jamming. 2) Clear, user‐friendly menu selections make flow meter simple and convenient to use. U.S., British and Metric measurement units are available. 3) Daily, monthly and yearly totalized flow: Totalized flow for the last 64 days and months as well as for the last 5 years are may be viewed. Power on/off function: 4. With the SD Card, 512 files can be stored; the time interval can be within 5 seconds. 4) Parallel operation of positive, negative and net flow totalizes with scale factor and 7 digit display. The flow meter ensures the highest resolution and wide measuring range with 0.04nS high resolution, high linearity and high stability time measuring circuit and 32 bits digits processing program. Theory of Operation When the ultrasonic signal is transmitted through the flowing liquid, there will be a difference between the upstream and downstream transit time (travel time or time of flight), which is proportional to flow velocity, according to the formula below. ... -
Page 49: Applications
8.4. Applications Water, sewage (with low particle content) and seawater Water supply and drainage water Power plants (nuclear power plant, thermal and hydropower plants), heat energy, boiler feed water and energy management system Metallurgy and mining applications (cooling water and acid recovery, for example) Petroleum and chemicals Food, beverage and pharmaceutical Marine operation and maintenance Energy economy supervision and water conservation management Pulp and paper (clean liquid applications) Pipeline leak detection Regular inspection, tracking and collection Energy measuring and balance Network monitoring systems and energy/flow computer management ... -
Page 50: Specifications
8.5. Specifications ... - Page 51 ...
- Page 52 ...
-
Page 53: Appendix1 - Flow Application Data
9. Appendix1 ‐ Flow Application Data Sound Velocity and Viscosity for Fluids Commonly Used Sound Velocity 1440 1.5 Alcohol Fluid Viscosity (m/s) 1620 Glycol Water 20 °C 1482 1.0 1923 1180 Glycerin Water 50 °C 1543 0.55 1250 0.80 Gasoline Water 75 °C 1554 0.39 1330 Benzene Water 100 °C 1543 ... -
Page 54: Sound Velocity For Various Materials Commonly Use
Sound Velocity for Various Materials Commonly Use Pipe Material Sound Velocity (m/s) Liner Material Sound Velocity (m/s) 3206 PTFE 1225 Steel 3150 2286 Titanium ABS 4190 3048 Cement Aluminum 2540 2270 Bitumen Brass 2540 2460 Porcelain enamel Cast iron 2270 5970 Bronze Glass 2280 3430 Plastic Fiber glass‐epoxy 1600 3276 Polyethylene Glass 1450 1950 PTFE Polyethylene ... -
Page 55: Sound Velocity In Water (1 Atm) At Different Temperatures
Sound Velocity in Water (1 atm) at Different Temperatures t ( °C ) v(m/s) 39 1527.1 79 1554.6 0 1402.3 40 1528.8 80 1554.4 41 1530.4 81 1554.2 1 1407.3 2 1412.2 42 1532.0 82 1553.9 43 1533.5 83 1553.6 3 1416.9 4 1421.6 44 1534.9 84 1553.2 45 1536.3 ... - Page 56 Common Pipe Dimensions (English) ...
- Page 57 ...
- Page 58 ...
- Page 59 ...
- Page 60 ...
- Page 61 ...
- Page 62 9.5 Common Pipe Dimensions (DIN) ...
- Page 63 ...
- Page 64 ...
- Page 65 ...
-
Page 66: Limited Warranty Policy- Register Online
10.1 Limited Warranty Policy- Register Online All Sierra products are warranted to be free from defects in material and workmanship and will be repaired or replaced at no charge to Buyer, provided return or rejection of product is made within a reasonable period but no longer than one (1) year for calibration and non-calibration defects, from date of delivery.
Need help?
Do you have a question about the InnovaSonic 210 and is the answer not in the manual?
Questions and answers