
Related Manuals for Omega OM-DAQXL-1 Series


Summary of Contents for Omega OM-DAQXL-1 Series
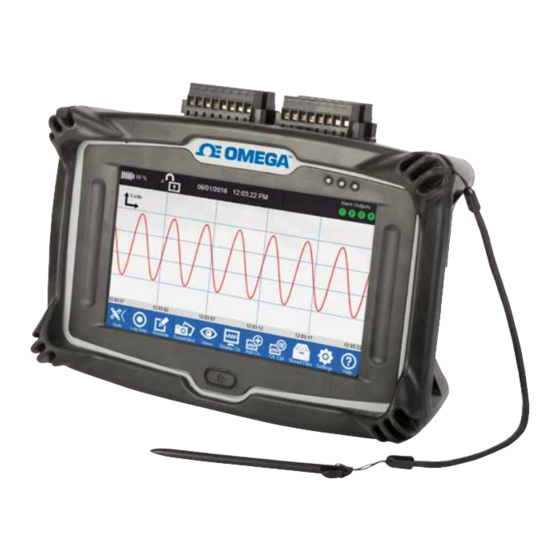
- Page 1 User’s Guide Shop online at omega.com e-mail: info@omega.com For latest product manuals: www.omegamanual.info OM-DAQXL Multi-Channel Universal Input Touch Screen Data Logger...
- Page 2 Tel: (203) 359-1660 Fax: (203) 359-7700 e-mail: info@omega.com For Other Locations Visit omega.com/worldwide The information contained in this document is believed to be correct, but OMEGA accepts no liability for any errors it contains, and reserves the right to alter specifications without notice.
-
Page 3: Table Of Contents
OM-DAQXL TABLE OF Multi Channel CONTENTS Touch Screen Data Logger Section Page Section 1 - Introduction ............... 1-1 1.1 Precautions ......................1-1 1.2 Safety Warnings and IEC Symbols ..............1-1 1.3 Statement on CE Marking ..................1-1 1.4 Overview ........................ 1-2 1.4.1 Operating Environment ................ - Page 4 OM-DAQXL TABLE OF CONTENTS Multi Channel Touch Screen Data Logger 3.3 Setting Screens ....................... 3-5 3.3.1 Add Channels ....................3-5 Input Type–Physical Input Channel ............... 3-5 Temperature Inputs ................... 3-5 Strain Gage Inputs ..................... 3-7 Voltage Inputs ....................3-9 Current Inputs ....................3-11 Digital Inputs ....................
- Page 5 OM-DAQXL TABLE OF CONTENTS Multi Channel Touch Screen Data Logger Section 4 - Notes page ................ 4-1 Section 5 - Troubleshooting ..............5-1 5.1 Hardware Issues ....................5-1 5.2 Error Messages ...................... 5-1 Section 6 - Service and Calibration ............6-1 Section 7 - Specifications ..............
- Page 6 LIST OF OM-DAQXL FIGURES Multi Channel Touch Screen Data Logger List of Figures (Continued) Figure Description ..................Page Figure 2-8 Removing and Installing Rubber Boot ..........2-5 Figure 2-9 OM-DAQXL Wall Mounting ..............2-5 Figure 2-10 Thermocouple Wiring Example ............2-6 Figure 2-11 Voltage Wiring Example ................
- Page 7 LIST OF OM-DAQXL FIGURES Multi Channel Touch Screen Data Logger List of Figures (Continued) Figure Description ..................Page Figure 3-21 Data Ranges - Resettable Counter ............3-18 Figure 3-22 Input Type - Virtual Math ..............3-19 Figure 3-23 Data Ranges - Virtual Math ..............3-20 Figure 3-24 Channel List screen ................
-
Page 8: Section 1 - Introduction
This manual will come in handy when you are unsure of how to operate the product. Please read this manual completely before installing and operating your OMEGA data logger system. It’s important to read and follow all notes, cautions, warnings and safety precautions before operating this device. “Device” refers to your data logger device. -
Page 9: Overview
Introduction 1.4 Overview The OM-DAQXL is an 8 or 16 analog input portable data logger with a color 7” resistive touch screen display. It has user programmable inputs that can be configured for several different types of sensors including temperature sensors (thermocouple, RTD, thermistor), strain gage, process inputs (voltage and current) and digital pulse inputs. -
Page 10: Section 2 - Hardware
If you have any questions about the shipment, please call our Customer Service Department at the number listed on the first page of this manual or reaching us on the Internet at omega.com, e-mail: cservice@omega.com. When you receive the shipment, inspect the container and equipment for any signs of damage. -
Page 11: Part Names And Functions
Hardware Figure 2-1 Included Items. 2.3 Part Names and Functions The figures in this section show the different parts of the data logger and provide a brief description of their functions. 2.3.1 Front The front of the data logger is comprised of 3 user interface elements. These are the 7”... -
Page 12: Back
Hardware 2.3.2 Back The back side of the data logger has a kickstand which allows the device to sit at a 30 degree angle when sitting on a hard surface and snaps into place when not in use. The kickstand has 2 keyhole slots allowing it to act as a wall mounting bracket. -
Page 13: Right Side
Hardware 2.3.4 Right Side The right side of the data logger features the USB host and device connectors as well as the shield ground terminal. The shield ground terminal may be connected to earth ground to minimize sensor noise pickup. In addition the stylus is stored in a slot on this side of the device. -
Page 14: Removing And Installing Rubber Boot
2.4 Removing & Installing Rubber Boot The data logger ships with an impact resistant rubber boot pre-installed. OMEGA recommends leaving the protective rubber boot installed, but it can be removed for convenience. When removing the rubber boot be sure to do so with a support surface not more than 1 foot beneath the device to protect in the case of an accidental drop. -
Page 15: Sensor Connections
Hardware 2.6 Sensor Connections This section shows how to connect sensors to your analog input terminals. There are 8 or 16 analog input channels (depending on the model) each having one positive terminal and one negative terminal clearly shown on the input label. -
Page 16: Current Wiring
Hardware 2.6.1.3 Current Wiring For current measurement a 50Ω shunt resistor is provided. Figure 2-12 DC Current Wiring Example - External Excitation 2.6.2 Two, Three & Four Wire Sensors Odd Channel Even Channel Sensor Type 2 Wire RTD RTD+ RTD– RTD- 3 Wire RTD RTD+... -
Page 17: Three Wire Rtd Wiring
Hardware 2.6.2.2 Three-Wire RTD Wiring For 3-wire RTD sensors the second common lead must be connected to the negative terminal of the next consecutive even channel. Figure 2-14 Three-Wire RTD Wiring Example 2.6.2.3 Four-Wire RTD Wiring For 4-wire RTD sensors the data logger performs a Kelvin resistance measurement using 1 channel to supply excitation voltage and the next channel to sense the voltage across the RTD. -
Page 18: Thermistor Wiring
Hardware 2.6.2.4 Thermistor Wiring For thermistor sensors connection, 2 channels are required as shown in Figure 2-16. Figure 2-16 Thermistor Wiring Example 2.6.2.5 Bridge Sensor Wiring For bridge based sensors excitation voltage is supplied on channels 1, 3, 9 and 11. -
Page 19: Digital I/O Connections
Hardware 2.7 Digital I/O Connections The included 6’ digital I/O cable with stripped leads and mini-DIN connector makes connecting digital I/O to the data logger quick and simple. Table 2-5 shows the cable pinout and figure 2-18 shows the corresponding pins on the data logger connector. -
Page 20: Table 2-6 Alarm Terminal Block Signals
Hardware 2.8 Alarm, Excitation & Trigger The eight position terminal block on the left side of the device has terminal positions for four alarm outputs, an isolated 24 VDC excitation supply and an external trigger input. Connections are made easy through the included pluggable terminal block. Follow the terminal indications on the label and connect to the appropriate position Signal Name Terminal #... -
Page 21: Led Indication
Hardware 2.10 LED Indication The three status LEDs on the front of the data logger provide an easy to see visual indication of the status of the device. This is useful when the LCD has been turned off or is difficult to read due to glare or distance. See figure 2-24 and table 2-7 for information on the different LED indications. -
Page 22: Battery Pack And Power Adapter
Hardware 2.11 Battery Pack and Power Adapter The data logger is a portable device and can operate on battery power for several hours before requiring recharging. The included battery is a 7.2V, 4.8 Ah Li-Ion battery. Also included is an AC adapter to provide 12VDC power for battery recharging. -
Page 23: Connecting The Ac Adaptor
OMEGA logo and a progress bar will appear. After approximately 30 seconds the data logger login screen will be shown. At this point you can login and begin configuring the data logger. -
Page 24: Section 3 - Standalone Operation
Login Window Normal user login Guest login Forgot Password Home Screen Figure 3-1 Login Window NOTE: For initial login use the default account with user name and password: omega, omega. This is an administrator account allowing additional users to be created. -
Page 25: Home Screen
Standalone Opteration 3.2 Home Screen After logging in, the home screen is displayed. The home screen is the main screen of the data logger user interface. It is divided into 3 distinct sections as shown in figure 3-2. Status/ Information display Data display... -
Page 26: Home Toolbar
Standalone Operation 3.2.2 Data Display Area The data display area shows the current values of the measure data for up to 4 channels simultaneously. There are four views available for this area: waveform, waveform & table, table only and digital. 3.2.3 Home Toolbar At the bottom of the home screen is the toolbar. -
Page 27: User Interface Flowchart
Standalone Operation 3.2.4 User Interface Flowchart Depending on current Log Data state, starts logging or arms data logger. Pauses display and allows Annotate annotation on the display using the stylus. Immediately Screenshot takes a screenshot. Select data view Views Toggle slide show Allows assignment of Select channel group... -
Page 28: Setting Screens
Standalone Operation 3.3 Settings Screens Most of the data logger settings are accessible through the settings button on the toolbar. Hitting the settings button invokes a small fly-out menu for selecting the specific settings screen to navigate to. Additional settings related to specific toolbar buttons functions are found in the associated screens or menus. -
Page 29: Figure 3-8 Data Ranges - Temperature
Standalone Operation 1. Channel Type Button The channel type selects between physical and math channel input types. Temperature inputs are physical input channels. 2. Input Type Settings For temperature inputs there are multiple sensor types available. These include thermocouple, RTD and thermistor. Each of these sensor types have additional sensor sub types available. -
Page 30: Strain Gage Inputs
Standalone Operation 5. Moving Average Filter This setting provides the option to average an individual channels input samples. 6. Graph Range The graph range is the y-axis range that will be shown on the waveform view of the data logger. This can be any subset of the display range and is defined in the assigned engineering units. -
Page 31: Figure 3-10 Data Ranges - Strain Gage
Standalone Operation For strain gage inputs the data ranges screen has user editable input and display ranges. The input range values should correspond to the millivolt output of the transducer at 0% and 100% of the transducers range. The display range values should be set to the corresponding 0% and 100% values of the selected engineering units. -
Page 32: Voltage Inputs
Standalone Operation Voltage Inputs For voltage inputs the Input Type screen appears as shown below. Figure 3-11 Input Type - Voltage 1. Channel Type Button The channel type selects between physical and math channel input types. Voltage inputs are physical input channels. 2. -
Page 33: Figure 3-12 Data Ranges - Voltage
Standalone Operation The Data Ranges screen for voltage inputs has several user editable fields which are used for linear scaling of a voltage input to the desired engineering units for display. Figure 3-12 Data Ranges - Voltage 1. Engineering Units The three drop downs allow selection of various engineering units for display depending on the type parameter being measured. -
Page 34: Current Inputs
Standalone Operation Current Inputs For current inputs the Input Type screen appears as shown below. A 50 Ω shunt resistor is required across the input terminals for current inputs. Figure 3-13 Input Type – Current 1. Channel Type Button The channel type selects between physical and math channel input types. Current inputs are physical input channels. -
Page 35: Figure 3-14 Data Ranges - Current
Standalone Operation The Data Ranges screen for current inputs has several user editable fields which are used for linear scaling of a current input to the desired engineering units for display. Figure 3-14 Data Ranges – Current 1. Engineering Units These drop downs allow selection of various engineering units for display depending on the type parameter being measured. -
Page 36: Digital Inputs
Standalone Operation Digital Inputs For digital inputs a sensor type must first be selected. The available selections are frequency, totalizer and resettable counter. Frequency For frequency type digital inputs, the Input Type screen will appear as shown below. Additional measurement type drop-down selections are available. Figure 3-15 Input Type - Digital Frequency 1. -
Page 37: Figure 3-16 Data Ranges - Digital Frequency
Standalone Operation When configured for frequency measurement mode and measurement type frequency, the data ranges screen will appear as shown below. Figure 3-16 Data Ranges - Digital Frequency 1. Engineering Unit Allows selection of various units for frequency measurement. 2. Input Frequency Shows the input range in terms of the selected engineering units. -
Page 38: Figure 3-17 Data Range - Volumetric Flow
Standalone Operation The frequency measurement mode can also be configured for a volumetric flow measurement type in which case the data ranges screen will have different configuration options as shown below. Figure 3-17 Data Range - Volumetric Flow 1. Engineering Units Allows selection of various flow measurement units. -
Page 39: Totalizer
Standalone Operation Totalizer For totalizer type digital inputs the device will keep a running total of the volumetric flow monitored by the digitals input until the reset count is reached. The reset count is in terms of the engineering units assigned on the Data Ranges screen. -
Page 40: Figure 3-19 Data Ranges - Digital Totalizer
Standalone Operation Totalizer inputs type must be configured in terms of volumetric flow. The Data Ranges screen provides configuration options as shown below. Figure 3-19 Data Ranges - Digital Totalizer 1. Engineering Units Allows selection of various flow measurement units. 2. -
Page 41: Resettable Counter
Standalone Operation Resettable Counter For resettable counter digital inputs the device will count the number of pulses received on the digital input until the reset time is reached. Figure 3-20 Input Type Digital Resettable Counter 1. Channel Type Button The channel type selects between physical and math channel input types. Frequency inputs are physical input channels. -
Page 42: Input Setup - Virtual Math Channel
Standalone Operation Input Setup – Virtual Math Channel Virtual math channels allow you to perform math functions on the data from two physical channels and store the calculated result as a virtual channel. Up to 16 virtual channels can be configured. Figure 3-22 Input Type - Virtual Math 1. -
Page 43: Figure 3-23 Data Ranges - Virtual Math
Standalone Operation After configuring the channels and math operations for the virtual math channel on the Input Type screen, you can set up the engineering units and ranges for the calculated results on the Data Ranges screen. Figure 3-23 Data Ranges - Virtual Math 1. -
Page 44: Channel List
Standalone Operation 3.3.2 Channel List The Channel List screen can be used to edit channels after their initial configuration as long as the data logger is in the free running mode of operation. To edit channels hit the Channel List button on the Home Screen toolbar to go to the Channel List screen. -
Page 45: Trigger Settings
Standalone Operation 3.3.3 Trigger Settings The Trigger settings screen can be accessed through settings button of the home screen toolbar. Trigger events can be used to start and stop a data logging session. It is even possible to trigger multiple sessions using repeat trigger events. -
Page 46: Timer Trigger Events
Standalone Operation Timer Trigger Events When used as a start trigger event the logging session will commence after the data logger has been armed and the configured time period has elapsed. When used as a stop trigger the timer sets the duration of the logging session. Figure 3-26 Timer Trigger Event 1. -
Page 47: Weekday And Time Trigger Events
Standalone Operation Weekday and Time Trigger Events Using this option a time and day of the week can be configured as a start or stop trigger. Figure 3-28 Weekday and Time Trigger Event 1. Trigger Time Sets the time that the trigger event occurs. 2. -
Page 48: External Trigger Events
Standalone Operation External Trigger Events This option allows the external trigger input to be used as a start and stop trigger. The external trigger input can accept signals from 0 to 24 Vdc. The input threshold voltage is ≥ 2.5 Vdc for a logic high level and ≤ 1.5 Vdc for a logic low level. -
Page 49: Data Session Settings
Standalone Operation 3.3.5 Data Session Settings The Data Session Settings screen is accessible from the settings button on the home screen toolbar. This screen is where you configure all the settings that control how data is logged. Figure 3-31 Data Session Screen 1. -
Page 50: Alarm Settings
Standalone Operation 3.3.6 Alarms Settings Alarms can be generated when the measured/calculated value meets an alarm condition. If an alarm is mapped to one of the four physical alarm outputs, the alarm status indicator will display the alarm condition. When in alarm condition the status indicator for the corresponding alarm output changes color as shown in the following table. -
Page 51: Alarm Toolbar
Standalone Operation Alarm Toolbar The alarm toolbar features buttons for performing all of the actions related to alarm settings. Figure 3-33 Alarm Toolbar 1. Back Returns to the home screen. 2. Add Alarm The Add Alarm button takes you to the screen where new alarms are set up. Several settings can be configured to determine when alarms are generated and what actions the data logger performs in response to those alarms. -
Page 52: Add/Edit Alarm Screen
Standalone Operation Add/Edit Alarm Screen The add/edit alarm screen is where alarm settings are configured. Here you can select the type of alarm you wish to create and also the actions the data logger will take when an alarm occurs. Figure 3-34 Add/Edit Alarm Screen 1. -
Page 53: Device Settings
Standalone Operation 3.3.7 Device Settings The device settings are five different screens which allow you to configure the way your device looks and works in addition to setting the date & time, managing users, running diagnostics and performing firmware updates. The device settings screens are accessible through the settings button of the home screen toolbar. -
Page 54: Display Options
Standalone Operation Display Options The Display Options screen is where you can make changes to the settings related to the 7” touch screen in addition to settings for the color scheme and other user interface related settings. Figure 3-37 Display Options Screen 1. -
Page 55: Communication Settings
Standalone Operation Communication Settings (if applicable) If you purchased a model 3 or 4 data logger, your tool bar will have a communications settings button. The Comm settings screen is where you can configure the Ethernet or optional WiFi communication settings. Figure 3-38 Comm Settings –... -
Page 56: Figure
Standalone Operation Figure 3-39 Comm Settings - WiFi 7. SSID – Select Network This dropdown selection will show all of the WiFi networks within range. 8. Security Key Enter the passphrase or security key for the selected network. If it is an open network, leave this field blank. -
Page 57: Diagnostics
Standalone Operation Diagnostics The diagnostics screen is where you can run the built in diagnostics routine and view reports from previous diagnostic runs. The diagnostic routine will run several tests on the various sub-systems of the data logger and provide a status indication for each test. -
Page 58: User Management
Standalone Operation User Management All settings related to user accounts are accessible from the user management screen. The user management setting screens are only available for Admin users. Figure 3-41 User Management Screen 1. Table Header Indicates the type of information in each column of the user table. 2. -
Page 59: Figure 3-42 Add User
Standalone Operation Add User This screen is where new user accounts can be added to the data logger. Figure 3-42 Add User 1. User Role Here you can assign new user a role of either Admin or Normal. Admin users have the ability to create or delete new users or their files. Normal users only have access to their own files. -
Page 60: Change Password
Return to the User Management screen without saving the new password. 5. Help Provides context sensitive help for the current screen. Note: omega Admin user can not be deleted. Only Admin users can add or delete users. Guest users do not require any Password. -
Page 61: About Your Logger/Firmware
OMEGA’s contact information and a Firmware Upgrade option. Occasionally OMEGA releases updates to the data logger firmware. These updates can be downloaded from the OMEGA FTP site, which can be accessed through the main OMEGA website by visiting www.omega.com/ftp and navigating to the OM-DAQXL folder under Data Acquisition folder. -
Page 62: Figure 3-45 Firmware Upgrade Screen
Standalone Operation Firmware Upgrade When performing a firmware upgrade, be sure that you have at least 50% battery life remaining. To install a firmware upgrade, save the .zip file to either a USB Flash drive or an SD card. Be sure to save the .zip file in the root directory of the memory device and do not unzip the file. -
Page 63: Viewing Data
Standalone Operation 3.4 Viewing Data To view data on the OM-DAQXL at least one input must be connected, configured and assigned to a channel group for display. There are two toolbar buttons which determine what data is shown in the data display area. Figure 3-47 Display Channel Fly-Out Menu The Display Channels button fly-out menu allows you to select which group of channels you would like to display and also provides quick access to the Select... -
Page 64: Select Channels
Standalone Operation 3.4.1 Select Channels Before channel data can be viewed, it must first be assigned to a group. This is done through the Select Channels screen which can be accessed through the Display Channels button on the home toolbar or from the Channel List screen toolbar. -
Page 65: Waveform View
Standalone Operation 3.4.2 Waveform View The waveform view uses the full display width to plot a graph of the channel data. This maximizes the amount of data that can be viewed. Figure 3-50 Waveform View 1. Time Stamp Indicator Shows the time stamp for each graph division. 2. -
Page 66: Waveform And Table View
Standalone Operation 3.4.3 Waveform and Table view The waveform & table view has the same features as the waveform view with the addition of a table showing the current values for all configured channels can be displayed on the right third of the display area. The graph scales can be adjusted using the scale selector in the same way as in the waveform view. -
Page 67: Figure 3-53 Table Only View
Standalone Operation 3.4.4 Table Only view The table only view provides a tabular view of statistical values for all currently configured channels. Figure 3-53 Table Only View 1. Channels This column shows the channel number and name assigned to each channel. 2. -
Page 68: Digital View
Standalone Operation 3.4.5 Digital View The digital view shows the user a digital indication of up to four channels (1 group) simultaneously. It has two display modes, four channel or single channel. Figure 3-54 Four Channel Digital View 1. Channel Display A single tap on any of the four digital displays will switch the display mode to show a single channel display for that channel. -
Page 69: Screenshot
Standalone Operation 3.4.6 Screenshot At any point during operation a screenshot of the current home screen can be captured simply by pressing the Screenshot button on the toolbar. This is a convenient way to capture information especially in the free-running mode when data is not being recorded to a file. -
Page 70: Operating Modes
Standalone Operation 3.5 Operating Modes The OM-DAQXL has four modes of operation. They are described in the following section. 3.5.1 Free-Running This mode is used mainly for set up. The device measures and displays all configured analog and digital inputs. No data is logged and all settings can be edited. -
Page 71: Figure 3-57 Stored File Directories
Standalone Operation Figure 3-57 Stored File Directories 1. Memory Type Shows the currently selected memory type. This defaults to the internal memory. 2. Screen Capture Directory Directory where all screen captures for the currently logged in user are stored. 3. Log Files Directory Directory where all data log files for the currently logged in user are stored. -
Page 72: Figure 3-58 Stored Files List
Standalone Operation To browse files in a particular directory you can select the directory using the checkbox and then press the Open button on the toolbar. The selected directory will be opened and all the files in the directory will be presented in a scrollable list as shown below. -
Page 73: Figure 3-59 Data Review Screen
Standalone Operation After selecting a particular file for review and pressing the Review button, the data logger will load the file and show the data review screen. Figure 3-59 Data Review Screen 1. Waveform Graph Shows a graphical plot of data for the file currently under review. Information displayed includes the y-axis scale for the channel currently highlighted, timestamp indicator, engineering unit value for the currently selected channel at each cursor location and time value at for each cursor. -
Page 74: Figure 3-60 Review Mode Channel List
Standalone Operation 11. Previous and Next Advances to the next page or returns to the previous page of the waveform data. 12. Zoom In and Zoom Out Zooms in or out on the waveform graph. Zooming is controlled using the cursors. - Page 75 NOTES...
-
Page 76: Section 5 - Troubleshooting
Troubleshooting 5 Troubleshooting 5.1 Hardware Issues Symptom Possible Solution The device does not Make sure the battery or AC adapter is properly power up when the connected. See section 2.11. power switch is on. Erratic input signal. Check signal lines and terminal connections. Connections must be free of corrosion. -
Page 77: Section 6 - Service And Calibration
If your OM-DAQXL system requires service or calibration, please call our Customer Service Department at 1-800-622-2378 or 203-359-1660. They will assist you in arranging the return and service of your device. We can also be reached at www.omega.com, e-mail: cservice@omega.com... -
Page 78: Section 7 - Specifications
Specifications 7 Specifications 7.1 General Display: 7.0" TFT color LCD (WVGA: 800 x 480 pixels) with chemically hardened touch panel. Internal Memory: 1 GB FLASH Memory SD Memory Card: 32 GB USB Flash Drive: 1GB Ethernet**: 10/100 Base-T, TCP/IP USB Wi-Fi Dongle**: 802.11 b/g/n, USB2.0 interface, Up to 150Mbps, WEP and WPA/WPA2 encryption schemes Operating Environment: 0 to 50°C (32 to 122°F), 0 to 95% RH non-condensing Storage Conditions: -10 to 60°C (32 to 140°F) -
Page 79: Inputs
Specifications 7.2 Inputs Number of Analog Inputs: 8 or 16 Sampling Rate Maximum Sampling Rate per Number of Channels (Analog and Digital): 1 Channel: 125 s/sec 2 Channels: 50 s/sec 4 Channels: 25 s/sec 8 Channels: 10 s/sec 16 Channels: 5 s/sec Logging Rate Maximum logging Rate per Number of Channels (Analog and Digital):... -
Page 80: Functions
Specifications Measurement Accuracy *At room temperature after 30 minute warm up period. Input Type: Thermocouple, RTD, Thermistor, Voltage, Current, Strain Gage Strain Gage Input: Only Channels 1, 2, 3, 4, 9, 10, 11, 12 are available. Frequency Update Rate: 250 msec Digital Input and Functions: Frequency, volumetric flow rate, totalization, resettable counter Virtual Math Channels 1 to 16: Math equation of any two physical channels... -
Page 81: Communication
Specifications Virtual Math Channels: Up to 16 virtual channels can be created. Statistics: Peak to Peak, Average, Minimum, Maximum, RMS Triggers Trigger Types: • Start, Stop, Repeat Trigger Conditions: • Timer, Date & Time, Weekday & Time, Alarm Output, External Trigger Logging Logging Modes: •... -
Page 82: Dimensions
Specifications 7.6 Dimensions Dimensions: mm (inch) Note: Ethernet port is only present on -EW models. 61.4 (2.42) (5.75) EVISIONS DATE 222 (8.75) M4 INSERT SCREW... -
Page 83: Section 8 - International Approvals
International Approvals 8 International Approvals CE Conformity: The OM-DAQXL has been designed to meet requirements as outlined in European Community EMC Directive EN61326. Five ferrite cores (PN: OM-DAQXL-RF) are included in the OM-DAQXL package. When using thermocouple temperature sensors with the OM-DAQXL it is recommended to pass the thermocouple through the supplied ferrite 2 turns before connecting it to the device. - Page 84 Department will issue an Authorized Return (AR) number immediately upon phone or written request. Upon examination by OMEGA, if the unit is found to be defective, it will be repaired or replaced at no charge. OMEGA’s WARRANTY does not apply to defects resulting from any action of the purchaser, including but not limited to mishandling, improper interfacing, operation outside of design limits, improper repair, or unauthorized modification.
- Page 85 Where Do I Find Everything I Need for Process Measurement and Control? OMEGA…Of Course! Shop online at omega.com TEMPERATURE M U Thermocouple, RTD & Thermistor Probes, Connectors, Panels & Assemblies M U Wire: Thermocouple, RTD & Thermistor M U Calibrators & Ice Point References M U Recorders, Controllers &...
Need help?
Do you have a question about the OM-DAQXL-1 Series and is the answer not in the manual?
Questions and answers