
Related Manuals for Agilent Technologies E4406A


Summary of Contents for Agilent Technologies E4406A
- Page 1 User’s Guide Agilent Technologies E4406A VSA Series Transmitter Tester Manufacturing Part Number: E4406-90145 Printed in USA July 2000 © Copyright 1999 - 2000 Agilent Technologies, Inc.
-
Page 2: Safety Information
The information contained in this document is subject to change without notice. Agilent Technologies makes no warranty of any kind with regard to this material, including but not limited to, the implied warranties of merchantability and fitness for a particular purpose. Agilent... - Page 3 Agilent Technologies from another country. Agilent Technologies warrants that its software and firmware designated by Agilent Technologies for use with an instrument will execute its programming instructions when properly installed on that instrument. Agilent Technologies does not warrant that the operation of the instrument, or software, or firmware will be uninterrupted or...
-
Page 5: Table Of Contents
1. Getting Started What Documentation Comes with the E4406A VSA Series Transmitter Tester ..17 URL for the Latest VSA Transmitter Tester Update ......18 Understanding Digital Communications Measurements . - Page 6 Contents Selecting the Frequency/Channel ..........80 4.
- Page 7 Contents Results ..............121 Changing the Measurement Setup .
- Page 8 Contents Amplitude Accuracy at 50 MHz ..........149 Test Limits .
- Page 9 Warranty Information ............211 Returning Your Instrument to Agilent Technologies ....... 212 Repair Tag Goes Here! Remove This Page! .
- Page 10 Contents...
- Page 11 List of Keys 10 MHz Out............................69 50 MHz Amplitude..........................132 50 MHz Amptd .............................132 50 MHz Ref.............................77 Abs Limit..............................111 Absolute..............................111 ADC Dither ............................102 ADC Range.............................94 Adjacent Channel Power ........................106 Advanced ..............................84 Align 50 MHz Reference ........................73 Align ADC ..............................73 Align All Now ............................72 Align Current IF Flatness ........................73 Align Current SysGain ..........................73 Align IF..............................73...
- Page 12 List of Keys Define Custom ............................61 Delay ...............................79 Delta ...............................90 Eject Page ...............................61 Emulated GPIB Address........................68 Emulated GPIB Logical Unit ........................68 Emulated GPIB Name ...........................68 ESC .................................72 Ethernet Addr ............................68 Exit Main Firmware ..........................36 Ext Atten ..............................119 Ext Front ..............................80 Ext Rear..............................80 Fail ................................111 FFT Length ............................94...
- Page 13 List of Keys K-B 70dB / 90dB/ 110dB (Kaiser-Bessel)....................94 Landscape...............................61 Language, ...............................61 Length Ctrl.............................94 Level ...............................79 License Key ............................37 License Key ............................38 Limit Setup ............................111 Line.................................86 Load State ..............................65 Log-Pwr Avg ............................85 Long (32 bit) ............................102 Manual ..............................94 Marker All Off............................90 Max Total Pwr............................78 Maximum Connections ..........................68 Maximum ...............................85...
- Page 14 List of Keys Rel Lim (PSD) ............................112 Relative Att ............................112 Relative..............................111 Reprint..............................61 Res BW ..............................84 Reset Offset ............................80 Restore Align Defaults...........................74 Restore Meas Defaults...........................84 Resume ..............................84 RF Burst (Wideband)..........................79 RF ................................77 Rise & Fall............................129 Save State...............................65 Scale/Coupling............................88 Scale/Div..............................87 SCPI LAN...............................68 Select ..............................89 Sensors ..............................134 Server ..............................68...
-
Page 15: Getting Started
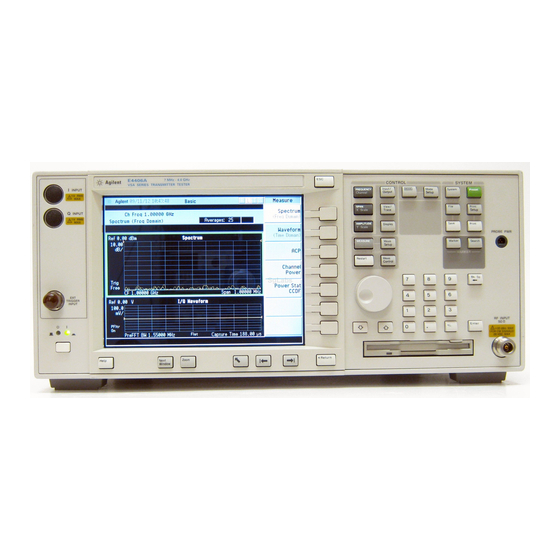
Getting Started This chapter introduces you to basic features of the instrument, including the front panel keys, rear panel connections, and display annotation. You will also find processes for making a basic measurement and for installing applications. - Page 16 Getting Started Topics include: “What Documentation Comes with the E4406A VSA Series Transmitter Tester” on page 17 “How to Make a Measurement” on page 20 “Front Panel Keys Context Dependency” on page 21 “Front Panel Description” on page 25 “Rear Panel Description” on page 31 “Display Annotation”...
-
Page 17: What Documentation Comes With The E4406A Vsa Series Transmitter Tester
Getting Started What Documentation Comes with the E4406A VSA Series Transmitter Tester What Documentation Comes with the E4406A VSA Series Transmitter Tester With your purchase of the instrument you receive the following materials: Table 1-1 Standard Documentation Part Description Notes User’s Guide... -
Page 18: Url For The Latest Vsa Transmitter Tester Update
Getting Started What Documentation Comes with the E4406A VSA Series Transmitter Tester Table 1-2 Personality Documentation Measurement Option Part Description Option BAC cdmaOne Measurement Guide cdmaOne Programming Commands Option BAH GSM Measurement Guide GSM Programming Commands Option 202 EDGE (w/GSM) Measurement Guide... -
Page 19: Understanding Digital Communications Measurements
Understanding Digital Communications Measurements Additional measurement application information is available through your local Agilent Technologies sales and service office. See the “If You Have a Problem” chapter for office location information. Some available application notes are listed below. Agilent Part... -
Page 20: How To Make A Measurement
Next Window Zoom Marker Search The VSA E4406A transmitter tester enables you to make a wide variety of digital measurements, both through its native spectrum and waveform measurement capabilities, and through the measurement personality option(s) you have purchased to activate applications specific measurements that are based upon industry standards. -
Page 21: Front Panel Keys Context Dependency
Getting Started Front Panel Keys Context Dependency Front Panel Keys Context Dependency Many of the instrument features are context dependent. The functions that are available will change based on your selections of mode, mode setup, measurement, and measurement setup. The following figures represent the dependency relationships of the front panel keys. - Page 22 Getting Started Front Panel Keys Context Dependency Figure 1-2 Context Dependent on the Selected Mode and Mode Setup MODE Service cdmaOne Mode Radio Setup MEASURE Standard: TIA-95B PCS Device: MS, BS Input Waveform (Time Domain) Trigger Spectrum (Freq Domain) Spurious Close Channel Power Demod Averaging...
- Page 23 Getting Started Front Panel Keys Context Dependency Figure 1-3 Context Dependent on the Selected Measure and Meas Setup MEASURE Waveform (Time Domain) Spectrum (Freq Domain) Spurious Close Channel Power Averaging Meas Trigger Source View/ Setup Trace Advanced Limits Statistics View Spectrum View I/Q View SPAN...
- Page 24 Getting Started Front Panel Keys Context Dependency Figure 1-4 Front Panel Keys Context Dependent Relationships Chapter 1...
-
Page 25: Front Panel Description
Getting Started Front Panel Description Front Panel Description Key menus may vary depending on the currently selected mode or measurement. Softkeys which are not available for use are greyed-out. This may be caused by: the current setting of other inter-related functions not having a required password or license key not having some piece of optional hardware that is required. - Page 26 Getting Started Front Panel Description 2. Control keys set parameters that are used by the measurement in the current measurement mode. • FREQUENCY/Channel accesses softkeys that control the center frequency or channel number. These parameters apply to all measurements in the current mode.
- Page 27 Getting Started Front Panel Description • accesses softkeys that affect the Meas Control measurement after it has been setup, for example selecting a single or continuous measurement. 6. Mode keys select the measurement mode and mode parameters page 77 for more detail. •...
- Page 28 Getting Started Front Panel Description 8. Marker keys are used to obtain specific information about parts of the displayed measurement (for example, to identify the exact frequency of an offset). See page 89 for more detail. • accesses softkeys that allow manual Marker positioning of markers.
- Page 29 Getting Started Front Panel Description • keys enter numeric values as indicated on Numeric the keys. In addition, decimal and positive and negative sign keys are available for your use. • The keys (these are the up and down arrow Step keys) change numeric values in increments of the current step size.
- Page 30 Getting Started Front Panel Description 16. Window keys are used to move to a different window in the display or to zoom the windows being displayed. • The key switches between windows. Next Window When a single window is being viewed it switches to display the next window which is contained in the current multi-window display which, however, is not initially visible on the display.
-
Page 31: Rear Panel Description
Getting Started Rear Panel Description Rear Panel Description The diagram below illustrates all rear panel connections. For further explanation of labels found on the rear panel see the section on safety considerations on page provides a transmitter tester trigger output. This is TRIGGER 2 OUT used to synchronize other test equipment with the transmitter tester. - Page 32 Getting Started Rear Panel Description Currently the connection can only be used to SCSI SCSI connect an external SCSI drive for firmware upgrades. SCSI functionality will be fully implemented with a future firmware update. AC power line connection. The line voltage operates Line Power Input at nominally 115 V (47 to 440 Hz) or at nominally 230 V (47 H to 66 Hz).
-
Page 33: Display Annotation
Getting Started Display Annotation Display Annotation The annotation features explained below refers to the display that is visible when your transmitter tester is in basic measurement mode; this is the default state of the transmitter tester when it is turned on. For explanations relating to unique measurement options such as GSM or cdmaOne see the documentation that accompanies each mode. - Page 34 Getting Started Display Annotation Measurement Bar. Displays information about measurements including some mode setup parameters. Current Measurement Annotation. The Annunciators bar displays annunciators that indicate that hardware errors, other errors, or specific instrument states, are detected in the instrument, as explained below.
- Page 35 Getting Started Display Annotation ESec (even second clock) - The green ESec annunciator indicates that the external even second clock has been selected as the sync type and a sync signal is present at the even second input (rear panel Trigger In), and the measurement is using it as the demodulation sync type.
-
Page 36: Installing Optional Measurement Personalities
Getting Started Installing Optional Measurement Personalities Installing Optional Measurement Personalities When you Install a measurement personality, you follow a two step process. 1. Install the measurement personality firmware into the instrument. (See the supplied installation instructions.) 2. Enter a license key number to enable the measurement personality. (Refer to the “License Key Numbers”... -
Page 37: Available Personality Options
Getting Started Installing Optional Measurement Personalities Available Personality Options The option designation consists of three characters, as shown in the Option column of the table below. Option Available Personality Options GSM measurement personality EDGE (with GSM) measurement personality cdmaOne measurement personality NADC, PDC measurement personalities iDEN measurement personality W-CDMA measurement personality... -
Page 38: Installing A License Key Number
Please enter your license key numbers below for future reference. If you should lose your license key number, call your nearest Agilent Technologies service or sales office for assistance. License Key Numbers for Instrument with Serial # ________ For Option______________ the license key number is _____________________... -
Page 39: Using The Uninstall Key
Getting Started Installing Optional Measurement Personalities 3. Press the key after you have entered the personality Install Now option number and the license key number. On some instruments, a message may appear in the function area of the display which reads, “Insert disk and power cycle the instrument”. -
Page 40: Cables For Connecting To The Serial Port
Getting Started Cables for Connecting to the Serial Port (RS-232) Cables for Connecting to the Serial Port (RS-232) There are a variety of cables and adapters available for connecting to PCs, and printers. Several of these are documented in the following wiring diagrams. - Page 41 Getting Started Cables for Connecting to the Serial Port (RS-232) Figure 1-7 HP 24542G/H Cable Figure 1-8 HP 92219J Cable Figure 1-9 HP 13242G Cable Chapter 1...
- Page 42 Getting Started Cables for Connecting to the Serial Port (RS-232) Figure 1-10 HP 24542M Modem Cable Figure 1-11 HP C2913A/C2914A Cable Figure 1-12 Mouse Adapter (typical) Chapter 1...
- Page 43 Getting Started Cables for Connecting to the Serial Port (RS-232) Figure 1-13 HP 24542U Cable with 5181-6641 Adapter Figure 1-14 HP 24542U Cable with 5181-6640 Adapter Figure 1-15 HP 24542U Cable with 5181-6642 Adapter Chapter 1...
- Page 44 Getting Started Cables for Connecting to the Serial Port (RS-232) Figure 1-16 HP 24542U Cable with 5181-6639 Adapter Figure 1-17 HP F1047-80002 Cable with 5181-6641 Adapter Figure 1-18 HP F1047-80002 Cable with 5181-6640 Adapter Chapter 1...
- Page 45 Getting Started Cables for Connecting to the Serial Port (RS-232) Figure 1-19 HP F1047-80002 Cable with 5181-6642 Adapter Figure 1-20 HP F1047-80002 Cable with 5181-6639 Adapter Chapter 1...
-
Page 46: Safety Considerations
Getting Started Safety Considerations Safety Considerations This section covers safety considerations relating to the installation and use of the instrument. Instrument Installation Install the instrument so that the detachable power cord is readily identifiable and is easily reached by the operator. The detachable power cord is used to completely disconnect the instrument. -
Page 47: Instrument Operation And Maintenance
This product must be used in a normal condition (in which all means for protection are in tact) only. To prevent electrical shock, disconnect the E4406A from mains WARNING before cleaning. Use a dry cloth or one slightly dampened with water to clean the external case parts. - Page 48 Getting Started Safety Considerations Safety Considerations for Service Personnel No one other than qualified service personnel are allowed to remove NOTE the cover of the instrument. The following warnings apply to service personnel. These warnings are found on the rear panel of the instrument.
-
Page 49: Using System Features
Using System Features System keys access features including printing, file management, and alignment that can be used in all modes. -
Page 50: Using System Keys
Using System Features Using System Keys Using System Keys System features are accessed through the front panel key. These System are features that are not dependent on the currently selected application mode or the particular measurement being made. They apply to all modes and measurements. The key also performs System the LOCAL function reactivating the front panel keys if the instrument... -
Page 51: Key Locations
Using System Features Key Locations Key Locations All instrument features can be located by using the key access table below. The key access path describes the key sequence you enter to access the particular key. Some features can only be used when specific measurements are active. -
Page 52: Auto Align
Using System Features Key Locations Table 2-1 Key Access Locations Key Access Path Meas Setup/More(1 of 2)/Advanced/ More (1 of 2)/Data Packing/ Auto Meas Setup/More(1 of 2)/ Advanced /ADC Range / Auto Note: This feature is used when measurement is set to either spectrum or waveform. -
Page 53: Clear Error Queue(S)
Using System Features Key Locations Table 2-1 Key Access Locations Key Access Path System/More(1 of 3)/More(2 of 3) /Install/ Choose Option System/More(1 of 3)/More(2 of 3) /Uninstall/ Choose Option System/Show Errors/ Clear Error Queue(s) Print Setup/Print To: Printer/Printer Type: Custom/Define Color Print Custom/Color Printer: Yes Print Setup/Print To: Printer/Printer Type: Custom/Define... - Page 54 Using System Features Key Locations Table 2-1 Key Access Locations Key Access Path System/Config I/O/ SICL Server Emulated GPIB Address Front Panel Enter Front Panel System/ More (1 of 3)/More (2 of 3)/ Install/ Exit Main Firmware Mode Setup/ Trigger/ Ext Front Ext Rear Mode Setup/ Trigger/...
-
Page 55: K-B 70Db / 90Db/ 110Db (Kaiser-Bessel)
Using System Features Key Locations Table 2-1 Key Access Locations Key Access Path Print Setup/Print to File HCOPy Dest Front Panel Help System/Config I/O/ Host Name Input/ Input Port/ IF Align Input/ IF Align Signal Print Setup/Print to File Image System/Config I/O/ SICL Server Instrument Name System/Config I/O/ SICL Server... -
Page 56: Log-Pwr Avg
Using System Features Key Locations Table 2-1 Key Access Locations Key Access Path File/ Load State Local Note: Press the front panel key to change from remote to (System) System local control of the instrument Meas Setup/Average/Avg Type/ Log-Pwr Avg Meas Setup/More(1 of 2)/ Long Advanced/ More (1 of 2)/... -
Page 57: Orientation
Using System Features Key Locations Table 2-1 Key Access Locations Key Access Path Print Setup/Print To: Printer (Note: Active for only) Orientation PCL5 Meas Control Pause Print Setup/Print To: File/File Type PCL3 Print Setup/Print To: File/File Type PCL5 Mode Setup/ Trigger/ RF Burst/ Peak Level Power Stat CCDF MODE/Basic... -
Page 58: Res Bw
Using System Features Key Locations Table 2-1 Key Access Locations Key Access Path Meas Setup/ Res BW Note: This feature is used when measurement is set to either spectrum or waveform. Front Panel Restart System/Alignments/ Restore Align Defaults Meas Setup/ More(1 of 2) Restore Meas Defaults System/ More(1 of 3)/ More (2 of 3) /... - Page 59 Using System Features Key Locations Table 2-1 Key Access Locations Key Access Path Marker/More (1 of 2)/ Shape Meas Setup/More(1 of 2)/ Advanced/More (1 of 2)/Data Packing/ Short System/ Show Errors System/More(1 of 3)/ Show System System/Config I/O/ SICL Server Input/IF Align Signal/ Signal Amptd Input/IF Align Signal/...
- Page 60 Using System Features Key Locations Table 2-1 Key Access Locations Key Access Path Marker/ Trace View Trace/ Trace Display Mode Setup/ Trigger Note: This feature is used when measurement is set to either spectrum or waveform. Mode Setup/ Trigger/ Trig Holdoff Note: This feature is used when measurement is set to either spectrum or waveform.
-
Page 61: Using Print And Print Setup Functions
Using System Features Using Print and Print Setup Functions Using Print and Print Setup Functions Keys in the menus enable you to print displayed screen Print Setup images to a variety of printers. You may also print to files stored in either the C: drive flash memory or to the built-in floppy disk drive in a variety of formats. - Page 62 Using System Features Using Print and Print Setup Functions The following table illustrates the menu as used above and Print Setup key choices available to print a screen image to a custom configured parallel printer. Level 1 shows key choices available when the front panel key is pressed.
-
Page 63: Printing A Screen Image To A File On A: Or C: Drives
Using System Features Using Print and Print Setup Functions Printing a Screen Image to a File on A: or C: Drives 1. Press . Toggle the key to select Print Setup Print To Print To File 2. Press the File Type key, then select the desired type file format. 3. - Page 64 Using System Features Using Print and Print Setup Functions Front Panel Key Level 1 Level 2 with Print Setup Print To File selected File Type File Location A:/C: Image Invert/Normal HCOPy Dest FPanel/Printer Print A: or C:screen1.xxx (Selectable screen filenames are active only if HCOPy Dest set to...
-
Page 65: Using File And Save Keys
Using System Features Using File and Save Keys Using File and Save Keys keys enable you to save instrument states to memory File Save and to load instrument states into the instrument from memory. For instructions on how to save a screen image to a floppy disc, see Saving a Screen Image to a Floppy Disc on page Front Panel Key... -
Page 66: Using The Alpha Editor Keys
Using System Features Using File and Save Keys Using the Alpha Editor Keys The alpha editor enables you to enter text. All text entries are displayed in the active function area. Level 1 Level 2 Level 3 Example ABCDEFG abcdefg ():;,’... -
Page 67: Using Input/Output Configuration Keys
Using System Features Using Input/Output Configuration Keys Using Input/Output Configuration Keys There are several keys available to help configure the instrument front panel and rear panel inputs/outputs. These include the various buses, external reference, and other types of I/O. Configuring I/O Press , Config I/O to access keys and menus that enable you to System... - Page 68 Using System Features Using Input/Output Configuration Keys • Host Name - Displays the host name of the instrument. Pressing the key activates the alpha editor, which enables you to change the host name. • Ethernet Addr - Shows the Ethernet address. This is an information only feature that can not be modified by the user.
-
Page 69: Reference
Using System Features Using Input/Output Configuration Keys Reference Press the Reference menu key to activate a menu which allows you to select an external reference, or to deactivate a 10 MHz out signal on the rear panel. Front Panel Level 1 Level 2 Toggle Entry... -
Page 70: Using System Configuration And Alignment Keys
Using System Features Using System Configuration and Alignment Keys Using System Configuration and Alignment Keys There are number of different keys that can help you with understanding the current instrument configuration and for hardware alignment. Some features are intended for use only by service personnel and NOTE cannot be accessed without a service password. -
Page 71: Show System
Using System Features Using System Configuration and Alignment Keys • Clear Error Queue(s) - The error history queue retains and displays all errors once they have been detected, even if they are no longer detected after a period of time has elapsed. After reviewing the error queue you will likely want to clear it before making another measurement. -
Page 72: Alignment
Using System Features Using System Configuration and Alignment Keys Alignment Press , Alignments to access menus which enable you to align System the instrument. Press the ESC key to stop any alignment. The table below diagrams the paths through which you will access alignment feature keys. - Page 73 50 MHz reference signal for absolute amplitude accuracy. The test equipment and the adjustment procedure required are described in the E4406A service guide. The Align 50 MHz reference feature can only be activated if you have a NOTE service password.
- Page 74 Using System Features Using System Configuration and Alignment Keys • Corrections - When set to On (the default state), the alignment firmware applies many numerical corrections to improve amplitude accuracy of the measurement. This includes an absolute amplitude adjustment at center frequency, and IF flatness correction for FFT spans (spectral measurements).
-
Page 75: Setting The Mode
Setting the Mode This chapter explains how to select the mode, and how to modify mode parameters such as input and trigger settings. -
Page 76: Selecting A Mode
Setting the Mode Selecting a Mode Selecting a Mode menu key is used to select the measurement personality you Mode have purchased with your instrument, or to select the basic or service modes, which are native to the instrument. Upon turn-on the instrument will default to the basic mode. -
Page 77: Mode Setup
Setting the Mode Mode Setup Mode Setup When you switch to another mode the instrument automatically presets mode settings to defaults for that mode. The settings under mode setup apply to all measurements in the mode. Prior to making measurements, it is important to set the parameters NOTE under the mode setup key so they match the device to be tested and your test setup. - Page 78 Setting the Mode Mode Setup Adjust Input Attenuation and Input Power. • Max Total Pwr key. The key can be activated only Max Total Pwr when is set to allows you to enter Input Port Max Total Pwr maximum power levels (−15 dBm is the default value) for the RF input.
-
Page 79: Trigger Keys
Setting the Mode Mode Setup Trigger Keys The Trigger key accesses the mode setup menu for the following trigger sources. See page 79 for an explanation of the trigger sources listed below, as well as two additional trigger sources. • RF Burst (Wideband) •... -
Page 80: Selecting The Frequency/Channel
Setting the Mode Mode Setup • Frame Timer key. The frame timer feature uses the internal frame clock to generate a trigger signal. — Period key. Sets the period of the frame clock. Values between and 1 ns and 559 ms can be entered. —... -
Page 81: Making Measurements
Making Measurements This chapter explains how to setup and view Basic mode and Service mode measurements. The service measurements help confirm the functionality of the instrument. -
Page 82: Basic Measurements
Making Measurements Basic Measurements Basic Measurements Basic measurements are useful for making measurements that are not specified in measurement standards, and will be useful if you need to troubleshoot a measurement operation. In addition, having spectrum and waveform measurements available independently of personality modes provides extra flexibility. -
Page 83: Preparing For Measurements
Making Measurements Preparing for Measurements Preparing for Measurements If you want to set the Basic mode to a known, factory default state, press . This will preset the mode setup and all of the Preset measurements to the factory default parameters. Pressing the key does not switch instrument modes. -
Page 84: Measurement Control
Making Measurements Preparing for Measurements Measurement Control Following your selection of the instrument mode and mode setup you will use keys in the keys to control processes that affect Meas Control the running of the current measurement. • - Toggles between Single and Cont (for continuous) Measure measurement states. - Page 85 Making Measurements Preparing for Measurements accurate results. There will be an increase in the time taken to make a measurement if the number of averages is increased. • Avg Mode - Selects between an (exponential) or a mode Repeat of averaging. This selection only affects the averaging after the number of N averages is reached (set using ).
- Page 86 Making Measurements Preparing for Measurements • - Is an internal IF envelope trigger. It triggers on an absolute Video threshold level of the signal passed by the IF. • - Is an internal wideband RF burst trigger that has an RF Burst automatic level control for burst signals.
-
Page 87: Changing The View
Making Measurements Preparing for Measurements Changing the View The following keys enable you to select the desired view of the measurement and to change scale parameters for the graphic window. - Selects a predefined view of the current measurement and View/Trace highlights the selected window. - Page 88 Making Measurements Preparing for Measurements reference level on the left, the center, or the right of the display. This is used for X scale display either in units of frequency or time. Scale/Coupling key. This key couples the scale/division to the sweep time for measurements made in the time domain.
-
Page 89: Using Markers
Making Measurements Preparing for Measurements Using Markers Markers enable you to make measurements on screen. Keys in the menu control the number and types of markers you can access. Marker keys allow you to select the trace on which you will activate a Trace marker. -
Page 90: Shape
Making Measurements Preparing for Measurements by using the , or keys. If a marker has Normal Delta Function previously been turned on and assigned to a specific trace it will become active on that trace when the key is pressed. Select •... -
Page 91: Making The Spectrum (Frequency Domain) Measurement
Making Measurements Making the Spectrum (Frequency Domain) Measurement Making the Spectrum (Frequency Domain) Measurement Purpose The spectrum measurement provides spectrum analysis capability for the instrument. The control of the measurement was designed to be familiar to those who are accustomed to using swept spectrum analyzers. -
Page 92: Changing The Measurement Setup
Making Measurements Making the Spectrum (Frequency Domain) Measurement Changing the Measurement Setup Table 1 Spectrum (Frequency Domain) Measurement Defaults Measurement Parameter Factory Default Condition Res BW 20.0000 kHz (Auto) Averaging: Avg Number 25 On Avg Mode Avg Type Log-Pwr Avg (Video) Trigger Source Free Run (Immediate) Measurement Time... - Page 93 Making Measurements Making the Spectrum (Frequency Domain) Measurement Parameters under the key seldom need to be changed. Any NOTE Advanced changes from the default advanced values may result in invalid measurement data. Make sure the measurement is selected under Spectrum (Freq Domain) menu.
- Page 94 Making Measurements Making the Spectrum (Frequency Domain) Measurement • Blackman • Blackman Harris • K-B 70dB / 90dB/ 110dB (Kaiser-Bessel) - Allows selection of Kaiser-Bessel filters with sidelobes of −70, −90, or −110 dBc. FFT Size - This menu contains the following features: •...
-
Page 95: Changing The View
Making Measurements Making the Spectrum (Frequency Domain) Measurement • - Data is automatically packed. This is the default setting Auto and most recommended. • - Data is packed by every 16 bits. Short (16 bit) • - Data is packed by every 24 bits. Medium (24 bit) •... -
Page 96: Using The Markers
Making Measurements Making the Spectrum (Frequency Domain) Measurement For the widest spans the I/Q window becomes just “ADC time domain NOTE samples”, because the I/Q down-conversion is no longer in effect. Using the Markers front-panel key accesses the menu to configure the markers. Marker If you want to use the marker function in the I/Q window, press View/Trace... -
Page 97: Troubleshooting Hints
Making Measurements Making the Spectrum (Frequency Domain) Measurement Two marker lines are activated at the extreme left side of the horizontal scale. Press and move marker 1 to the desired Normal place by rotating the knob. Press to bring marker 2 to the same place as marker 1. Delta Move marker 1 to the other desired position by rotating the knob. -
Page 98: Making The Waveform (Time Domain) Measurement
Making Measurements Making the Waveform (Time Domain) Measurement Making the Waveform (Time Domain) Measurement Purpose The waveform measurement is a generic measurement for viewing waveforms in the time domain. This measurement is how the instrument performs the zero span functionality found in traditional spectrum analyzers. -
Page 99: Results
Making Measurements Making the Waveform (Time Domain) Measurement Results Figure 1 Waveform Measurement Results- RF Envelope Window Figure 4-1 Waveform Measurement Results - I/Q Waveform Window Chapter 4... -
Page 100: Changing The Measurement Setup
Making Measurements Making the Waveform (Time Domain) Measurement Changing the Measurement Setup Table 2 Waveform (Time Domain) Measurement Defaults Measurement Parameter Factory Default Condition View/Trace RF Envelope Sweep Time 2.000 ms Res BW 100.000 kHz Averaging: Avg Number 10 Off Avg Mode Avg Type Pwr Avg (RMS) - Page 101 Making Measurements Making the Waveform (Time Domain) Measurement Make sure the measurement is selected under Waveform (Time Domain) menu. Press the key to access a menu which Measure Meas Setup allows you to modify the averaging, and trigger source for this measurement (as described in the “Measurement Setup”...
- Page 102 Making Measurements Making the Waveform (Time Domain) Measurement • Short (16 bit) - Data is packed by every 16 bits. • Medium (24 bit) - Data is packed by every 24 bits. • Long (32 bit) - Data is packed by every 32 bits. ADC Dither - Allows you to toggle the ADC dither function between .
-
Page 103: Changing The View
Making Measurements Making the Waveform (Time Domain) Measurement Changing the View menu keys are used to activate a view of a measurement View/Trace with preset X and Y scale parameters; this view is called a “window.” Using the X and Y scale keys, you can then modify these parameters. You can also activate traces, using the menu key. -
Page 104: Troubleshooting Hints
Making Measurements Making the Waveform (Time Domain) Measurement In the Waveform measurement, the Mean Pwr (Entire Trace) value NOTE plus the Pk-to-Mean value will sum to equal the current Max Pt. value as shown in the data window below the RF Envelope display. If you do a marker peak search ( ) with averaging turned off, the marker will Search... -
Page 105: Making The Adjacent Channel Power (Acp) Measurement
Making Measurements Making the Adjacent Channel Power (ACP) Measurement Making the Adjacent Channel Power (ACP) Measurement Purpose Adjacent Channel Power (ACP) is the power contained in a specified frequency channel bandwidth relative to the total carrier power. It may also be expressed as a ratio of power spectral densities between the carrier and the specified offset frequency. -
Page 106: Making The Measurement
Making Measurements Making the Adjacent Channel Power (ACP) Measurement Making the Measurement The factory default settings provide a good starting point. For special NOTE requirements, you many want to change some of the settings. Press at any time to return all Meas Setup More Restore Meas Defaults... - Page 107 Making Measurements Making the Adjacent Channel Power (ACP) Measurement Figure 4-2 Adjacent Channel Power Measurement - Spectrum View Chapter 4...
-
Page 108: Changing The Measurement Setup
Making Measurements Making the Adjacent Channel Power (ACP) Measurement Changing the Measurement Setup Table 4-1 Adjacent Channel Power Measurement Defaults Measurement Parameter Factory Default Condition View/Trace Bar Graph (Total Pwr Ref) Spectrum Trace Average Number 20 On Average Mode Repeat Reference Channel Channel Integ BW 1.23000 MHz... - Page 109 Making Measurements Making the Adjacent Channel Power (ACP) Measurement Table 4-1 Adjacent Channel Power Measurement Defaults Measurement Parameter Factory Default Condition 546.1 µs Auto Sweep Time Data Points 2048 Auto Num FFT Seg 1 Auto Offset Advanced Sweep Time 11.20 ms Auto Data Points 1024 Auto Num FFT Seg...
- Page 110 Making Measurements Making the Adjacent Channel Power (ACP) Measurement Make sure the measurement is selected under the menu. Measure key accesses the menu which allows you to modify the Meas Setup average number and average mode for this measurement. In addition, the following parameters for adjacent channel power measurements can be modified.
- Page 111 Making Measurements Making the Adjacent Channel Power (ACP) Measurement Offset Freq- Allows you to enter an offset frequency value and toggle the offset frequency function between . The range is 0.0 Hz to 45.000 MHz. While this key is activated, enter an offset value from the numeric keypad by terminating with one of the frequency unit keys shown.
- Page 112 Making Measurements Making the Adjacent Channel Power (ACP) Measurement Rel Lim (PSD)- Allows you to enter a relative limit value of the power spectral density level ranging from −150.00 to +50.00 dB with 0.01 dB resolution. The default is −28.87 dB for Offset A and −43.87 dB for offset B.
-
Page 113: Changing The View
Making Measurements Making the Adjacent Channel Power (ACP) Measurement Changing the View key accesses the menu to select the desired view of the View/Trace measurement. • Bar Graph - In the factory default condition, 5 of the total integration power levels, centered at the carrier frequency and ±750.0 kHz and ±1.98 MHz offset frequencies, for example, are shown in the graph window. -
Page 114: Troubleshooting Hints
Making Measurements Making the Adjacent Channel Power (ACP) Measurement Troubleshooting Hints This adjacent channel power ratio measurement can reveal degraded or defective parts in the transmitter section of the UUT. The following examples are those areas to be checked further. •... -
Page 115: Making The Channel Power Measurement
Making Measurements Making the Channel Power Measurement Making the Channel Power Measurement Purpose The Channel Power measurement is a common test used in the wireless industry to measure the total transmitted power of a radio within a defined frequency channel. This procedure measures the total power within the defined channel. -
Page 116: Results
Making Measurements Making the Channel Power Measurement To change any of the measurement parameters from the factory default values, refer to the “Changing the Measurement Setup” section. Results The following figure shows an example result of channel power measurements. The channel power graph is shown in the graph window. -
Page 117: Changing The Measurement Setup
Making Measurements Making the Channel Power Measurement Changing the Measurement Setup The next table shows the factory default settings for channel power measurements. Table 4-2 Channel Power Measurement Defaults Measurement Parameter Factory Default Condition Meas Setup: Avg Number 20 On Avg Mode Repeat Integ BW... -
Page 118: Changing The Display
Making Measurements Making the Channel Power Measurement In addition, the following parameters for channel power measurements can be modified by pressing the key: Advanced • - Allows you to manually change the sweep time and also Sweep Time to toggle the sweep time control between (manual). -
Page 119: Troubleshooting Hints
Making Measurements Making the Channel Power Measurement Troubleshooting Hints If an external attenuator is used, be sure to include its attenuation in the measurement of the channel power. Use the Ext Atten key. The channel power measurement, very often along with the adjacent channel power ratio measurement and/or spectrum measurement, can reveal degraded or defective parts in the transmitter section of the UUT. -
Page 120: Making The Power Stat Ccdf Measurement
Making Measurements Making the Power Stat CCDF Measurement Making the Power Stat CCDF Measurement Purpose Many of the digitally modulated signals now look noise-like in the time and frequency domain. This means that statistical measurements of the signals can be a useful characterization. Power Complementary Cumulative Distribution Function (CCDF) curves characterize the higher level power statistics of a digitally modulated signal. -
Page 121: Making The Measurement
Making Measurements Making the Power Stat CCDF Measurement Making the Measurement The factory default settings provide a good starting point. For special NOTE requirements, you may need to change some of the settings. Press Meas at any time to return all Setup More (1 of 2) Restore Meas Defaults... -
Page 122: Changing The Measurement Setup
Making Measurements Making the Power Stat CCDF Measurement Changing the Measurement Setup The next table shows the factory default settings for power statistics CCDF measurements. Table 4-3 Power Statistics CCDF Measurement Defaults Measurement Parameter Factory Default Condition Meas Setup: Meas BW 5.00000 MHz Counts 10.0000 Mpoints... -
Page 123: Changing The Display
Making Measurements Making the Power Stat CCDF Measurement Changing the Display key allows you to control the desired trace and line displays Display of the power statistics CCDF curves. The currently measured curve is always shown. • - Allows you to copy the currently measured curve as Store Ref Trace the user-definable reference trace. -
Page 124: Troubleshooting Hints
Making Measurements Making the Power Stat CCDF Measurement Troubleshooting Hints The power statistics CCDF measurement can contribute in setting the signal power specifications for design criteria for systems, amplifiers, and other components. For example, it can help determine the optimum operating point to adjust each code timing for appropriate peak/average power ratio throughout the wide channel bandwidth of the transmitter for a W-CDMA system. -
Page 125: Service Measurements
Making Measurements Service Measurements Service Measurements Service measurements help you check the functionality of your instrument. They include a power vs. time measurement, which is intended strictly for diagnostic uses. The spectrum and waveform measurements that can be accessed through the service menu are explained in the section on basic measurements. -
Page 126: Making The Power Vs. Time Measurement
Making Measurements Making the Power vs. Time Measurement Making the Power vs. Time Measurement Purpose This measurement is provided for instrument internal testing and self diagnostics. Power vs. Time measures the mean transmit power during the “useful part” of GSM bursts and verifies that the power ramp fits the within the defined mask. -
Page 127: Results
Making Measurements Making the Power vs. Time Measurement Results Figure 4-5 Power vs. Time Measurement Result - Burst View Figure 4-6 Power vs. Time Measurement Result - Rise & Fall View Chapter 4... -
Page 128: Changing The Measurement Setup
Making Measurements Making the Power vs. Time Measurement Changing the Measurement Setup Table 4-4 Power vs. Time Measurement Defaults Measurement Parameter Factory Default Condition Avg Bursts 10 Off Avg Mode Avg Type Pwr Avg (RMS) Meas Time 1 Slot Trig Source RF Burst (Wideband) Burst Sync Training Seq... -
Page 129: Changing The View
Making Measurements Making the Power vs. Time Measurement Changing the View key will access a menu which allows you to select the View/Trace desired view of the measurement from the following selections: • Burst - views the entire sweep as specified by the meas time. •... -
Page 130: Timebase Frequency
Making Measurements Timebase Frequency Timebase Frequency Purpose In the absence of a frequency counter, the measurement quickly determines the frequency difference between the instrument’s 10 MHz reference oscillator signal and an accurate, external 10 MHz frequency standard. The timebase frequency check is not as accurate as a measurement of NOTE the 10 MHz Out signal (rear panel) using a frequency counter referenced to a frequency standard. -
Page 131: Results
Making Measurements Timebase Frequency Results Window One (Time Record) Shows an I/Q display of the frequency difference between the input signal and the internal 10 MHz signal. Window Two (Magnitude) Shows a polar representation of window one. This window shows how much the phase error changes during the sampling period. -
Page 132: 50 Mhz Amplitude
Making Measurements 50 MHz Amplitude 50 MHz Amplitude Purpose To check the amplitude of the internal 50 MHz amplitude reference signal. Measurement Method The amplitude of an internal 50 MHz reference signal is compared with the amplitude of a stable external 50 MHz signal which has been measured with a power meter and then connected to the front panel RF connector. -
Page 133: Results
Making Measurements 50 MHz Amplitude Results Window One (RF Magnitude) Shows the amplitude (unitless) of the external source as measured by the transmitter tester. Window Two (Cal Magnitude) Shows the amplitude (unitless) of the 50 MHz input calibrator. Window Three (Error) Shows a stripchart of the amplitude error between the 50 MHz internal calibrator and the external source amplitude. -
Page 134: Sensors
Making Measurements Sensors Sensors Purpose This routine allows the instrument to read the temperature of the RF board and the 21.4 MHz detector on the output of the analog IF assembly. Measurement Method The RF temperature sensor measurement is generated internally and does not require any user interaction. -
Page 135: Results
Making Measurements Sensors Results Window One (IF Signal Level) Shows a stripchart of the IF signal amplitude in dBm. Window Two (Cal Osc Level) The Cal Oscillator window is not implemented. Window Three (RF Temperature) Shows a stripchart of the RF assembly temperature in Celsius. Window Four (numeric results) IF Signal Level: The ADC number for the detected 21.4 MHz IF signal at the input to the AIF. -
Page 136: Front Panel Test
Making Measurements Front Panel Test Front Panel Test Purpose The front panel test checks the functionality of the instrument front panel keys and the RPG knob. Test Setup Press . Once the Front Panel Measure More (1 of 2) Front Panel Test Test key is pressed you will see a display with three columns appear on the screen. -
Page 137: Results
1. Troubleshooting Hints If the front panel check fails contact the Agilent Technologies instrument support center. See page 212. - Page 138 Making Measurements Front Panel Test Chapter 4...
-
Page 139: Functional Testing
Functional Testing... -
Page 140: What You'll Find In This Chapter
Functional Testing What You'll Find in This Chapter What You'll Find in This Chapter This chapter is divided into two sections. The first, “Getting Started,” a brief description of what functional tests are and what you will need to perform them. The second, “Test Descriptions,”... -
Page 141: Getting Started
Functional Testing Getting Started Getting Started Before You Start You must do the following before starting functional tests: 1. Ensure you have the proper test equipment, refer to Table 5-1 on page 142. 2. Switch on the unit under test (UUT) and let it warm up in accordance with warm-up requirements in the instrument specifications. - Page 142 Functional Testing Getting Started Table 5-1 Required Test Equipment Summary Instrument Critical Specifications Recommended Alternative HP/Agilent HP/Agilent Model Number Model Number Signal Source Synthesized Frequency: 8663A 8662A Signal Generator 7 MHz to 2.5 GHz 8664A Spectral purity: 5 to 1321 MHz 8665A SSB Phase Noise: 8643A...
-
Page 143: Test Descriptions
Functional Testing Test Descriptions Test Descriptions Each of the following test descriptions include the test limits (pass/fail criteria), a description of what the test does or what it measures, a list of equipment required for the performance of the test, an illustration of the test setup used, and a step by step test procedure. -
Page 144: Frequency Response (Flatness)
Functional Testing Frequency Response (Flatness) Frequency Response (Flatness) Test Limits ± Signal amplitude should remain within 2 dB (4 dB peak-to-peak) from 10 MHz to 4 GHz. Test Description The frequency response test measures amplitude error as a function of the tuned center frequency. -
Page 145: Procedure
Functional Testing Frequency Response (Flatness) Figure 5-1 Power Meter Zero and Calibration Setup Figure 5-2 Frequency Response Test Setup Procedure 1. Configure the power meter and power sensor as shown in Figure 5-1. 2. Zero and calibrate the power meter. 3. -
Page 146: Trace
Functional Testing Frequency Response (Flatness) 5. Initialize the parameters for the instrument, as listed in Table 5-2, “UUT Initialization,” by performing the following steps: a. Press MODE Basic b. To expand the Spectrum window to full screen, ensure that the Spectrum window is highlighted and press Zoom If the Spectrum window is not highlighted, press... - Page 147 Functional Testing Frequency Response (Flatness) 7. Configure equipment as shown in Figure 5-2, “Frequency Response Test Setup”. 8. Adjust the synthesized sweeper amplitude for a power meter display of −10.00 dBm, ± 0.1 dB. The power level remains unchanged for the duration of the test. NOTE 9.
- Page 148 Functional Testing Frequency Response (Flatness) Table 5-4 Frequency Responses Report Center Power Meter Flatness Test Frequency Amplitude Amplitude Error Limits (MHz) Meas Power Flat (dBm) meter error (dB) (dBm) (dBm) (dB) ± ± ± ± 1200 ± 1600 ± 2000 ±...
-
Page 149: Amplitude Accuracy At 50 Mhz
Functional Testing Amplitude Accuracy at 50 MHz Amplitude Accuracy at 50 MHz Test Limits ± Amplitude Accuracy should remain within 1dB of the measured source value across the range of source levels and input attenuator settings. Test Description The amplitude accuracy test measures the absolute amplitude of the instrument at 50 MHz. -
Page 150: Procedure
Functional Testing Amplitude Accuracy at 50 MHz Figure 5-3 Amplitude Accuracy Test Setup Procedure 1. Preset the UUT by pressing Preset 2. If the auto alignment for the UUT has not been run within the last hour, run it by pressing , and System Alignment... - Page 151 Functional Testing Amplitude Accuracy at 50 MHz Table 5-5 UUT Initialization Parameter Setting Mode Basic Measure Spectrum Frequency Center 50 MHz Span 1 MHz Resolution Bandwidth 20 kHz Input Attenuation 0 dB Average On/Off Mode Type Log-Pwr Avg Number Trace Display Average Marker Spectrum Avg...
- Page 152 Functional Testing Amplitude Accuracy at 50 MHz e. Record the signal amplitude, as measured by the power meter, in the Amplitude Input column of Table 5-8, “Amplitude Accuracy at 50 MHz Report.” f. Press Restart g. Wait for the transmitter tester to finish averaging, and read the marker value.
- Page 153 Functional Testing Amplitude Accuracy at 50 MHz Table 5-8 Amplitude Accuracy at 50 MHz Report Input Power Meter Error Test Nominal Atten Amplitude Measured Amp_Acc Limits Measured (dB) Input Amplitude (dB) (dB) Values (dBm) (dBm) (dBm) −2 ±1.0 −12 ±1.0 −22 ±1.0 ±1.0...
-
Page 154: Input Attenuator Accuracy At 50 Mhz
Functional Testing Input Attenuator Accuracy at 50 MHz Input Attenuator Accuracy at 50 MHz Test Limits The internal input attenuator should reduce the input signal to a value ± within 1.0 dB of the nominal value at 50 MHz. Test Description The input attenuator accuracy test checks the proper function of the internal attenuator. -
Page 155: Procedure
Functional Testing Input Attenuator Accuracy at 50 MHz Procedure 1. If the auto alignment for the UUT has not been run within the last hour, run it by pressing , and System Alignment Align All Now 2. Preset the UUT by pressing Preset 3. - Page 156 Functional Testing Input Attenuator Accuracy at 50 MHz Table 5-9 UUT Initialization Parameter Setting Mode Basic Measure Spectrum −23 dBm Reference Level Frequency Center 50 MHz Span 20 kHz Resolution Bandwidth 400 Hz Input Port 50 MHz Ref Input Attenuation 10 dB Average On/Off...
- Page 157 Functional Testing Input Attenuator Accuracy at 50 MHz 5. Perform the following steps for each attenuator setting listed in Table 5-10: a. Press , “n”, and . Where “n” is the attenuation Input Input Atten value in the Input Attenuator column of Table 5-10.
- Page 158 Functional Testing Input Attenuator Accuracy at 50 MHz Table 5-11 Attenuator Check at 50 MHz Input Attenuator Attenuator Limit (dB) (dB) Error (dB) ±1.0 ±1.0 ±1.0 ±1.0 ±1.0 ±1.0 ±1.0 a. The zero dB setting is the reference level. Chapter 5...
-
Page 159: Displayed Average Noise Level (Danl)
Functional Testing Displayed Average Noise Level (DANL) Displayed Average Noise Level (DANL) Test Limits The DANL test results should be within the following limits in the four frequency ranges tested: Table 5-12 Frequency Limits (dBm) ≤ −90 7 MHz to 20 MHz ≤... -
Page 160: Procedure
Functional Testing Displayed Average Noise Level (DANL) Procedure 1. If the auto alignment for the UUT has not been run within the last hour, run it by pressing , and System Alignment Align All Now 2. Preset the UUT by pressing Preset 3. - Page 161 Functional Testing Displayed Average Noise Level (DANL) Table 5-13 UUT Initialization Parameter Setting Mode Basic Measure Spectrum Frequency Center 19.995 MHz Span 10 kHz Resolution Bandwidth 1 kHz ADC Range Auto/On/Off Auto Input Attenuation 0 dB Average On/Off Mode Type Log-Pwr Avg Number −85 dBm...
- Page 162 Functional Testing Displayed Average Noise Level (DANL) 6. Perform the following steps for each frequency setting listed in Table 5-14: a. Press , “n”, and . Where “n” is the next Frequency Center frequency value in the Center Frequency column. b.
-
Page 163: Phase Noise
Functional Testing Phase Noise Phase Noise Test Limits Center Frequency Limit Frequency Offset (dBc/Hz) (MHz) (kHz) ≤ −85 ≤ −90 ≤ −80 ≤ −90 ≤ −70 1900 ≤ −90 1900 Test Description The phase noise test verifies that phase noise is within acceptable limits. -
Page 164: Required Equipment
Functional Testing Phase Noise Required Equipment (include cables and connectors) Instrument Recommended Alternative HP/Agilent Model HP/Agilent Number Model Number Synthesized Signal Generator 8663A 8662A, 8664A, 8665A, 8643A, or 8644A w/ Option Cable: Type N, (2 required) 11500C Figure 5-5 Phase Noise Test Setup Chapter 5... -
Page 165: Procedure
Functional Testing Phase Noise Procedure 1. If the auto alignment for the UUT has not been run within the last hour, run it by pressing , and System Alignment Align All Now 2. Preset the UUT by pressing Preset 3. Initialize the parameters for the instrument, as listed in Table 5-15, “UUT Initialization,”... - Page 166 Functional Testing Phase Noise Table 5-15 UUT Initialization Parameter Setting Mode Service Measure Spectrum Frequency Center 600 MHz Span 800 Hz Resolution Bandwidth Auto Attenuation 10 dB Average On/Off Mode Type Number −6 ADC Range Manual ADC Dither On/Off Pre ADC BPF On/Off Trace Display Average...
- Page 167 Functional Testing Phase Noise Table 5-16 Synthesizer Signal Generator Initialization Parameter Setting Frequency 600 MHz Function Sine Wave Amplitude 7 dBm 5. Configure the test equipment as shown in Figure 5-5, “Phase Noise Test Setup.” 6. Perform the following steps to establish the source reference amplitude: a.
- Page 168 Functional Testing Phase Noise 7. Reset the UUT parameters to measure the phase noise by performing the following steps: a. Press , 5, Meas Setup Res BW b. Press until (2 of 2) is displayed, Meas Setup More Advanced , and ADC Range Auto c.
- Page 169 Functional Testing Phase Noise Table 5-18 Measurement Settings Source Frequency Center Frequency Noise Marker (MHz) (MHz) Frequency (MHz) 600.010000 600.010000 600.030000 600.030000 900.010000 900.010000 900.030000 900.030000 1900 1900.010000 1900.010000 1900 1900.030000 1900.030000 d. Press Restart e. Wait for the instrument to finish averaging. f.
-
Page 170: Residual Responses
Functional Testing Residual Responses Residual Responses Test Limits Frequency Range Limit ≤ −85 20 MHZ to 2 GHz ≤ −80 2 GHZ to 4 GHz Test Description The residual response test measures the instrument residual responses. With the RF 50 Ω input terminated in a 50 Ω load, internal residual responses are measured at various frequencies between 50 MHz and 4 GHz. -
Page 171: Procedure
Functional Testing Residual Responses Procedure 1. If the auto alignment for the UUT has not been run within the last hour, run it by pressing , and System Alignment Align All Now 2. Preset the UUT by pressing Preset 3. Initialize the parameters for the instrument, as listed in Table 5-20, “UUT Initialization,”... - Page 172 Functional Testing Residual Responses Table 5-20 UUT Initialization Parameter Setting Mode Basic Measure Spectrum Frequency Center 50 MHz Span 5 MHz Resolution Bandwidth 10 kHz Attenuation 0 dB Average On/Off Mode Type Log-Pwr Avg Number ADC Rang Auto/On/Off Auto ADC Dither On/Off Pre ADC BPF On/Off...
- Page 173 Functional Testing Residual Responses c. Set the resolution bandwidth by pressing Meas Setup Res BW “n”, and . Where “n” is the frequency value in the Res BW column. For example: Press , 10, and Meas Setup Res BW Table 5-21 Measurement Settings Center Frequency Span Frequency...
- Page 174 Functional Testing Residual Responses Table 5-22 Residual Response Report Carrier Measured X Test Limit Frequency (MHz) (dBm) (dBm) 50.00 ≤ −85 740.00 ≤ −85 1804.00 ≤ −85 1917.90 ≤ −85 1990.80 ≤ −85 1992.90 ≤ −85 3768.30 ≤ −80 3899.50 ≤...
- Page 175 If You Have a Problem • helps you identify causes of problems you might experience • explains error messages • provides warranty information • provides information on how to return the instrument to Agilent Technologies, if it needs service...
-
Page 176: If You Have A Problem Problem Symptoms And Solutions
If You Have a Problem Problem Symptoms and Solutions Problem Symptoms and Solutions The following section describes some transmitter tester problem symptoms and possible solutions to those problems. They include: “Key or Feature Does Not Appear in Menu” on page 176 “Frequency Unlock or External Reference Missing - Error Messages”... -
Page 177: Frequency Unlock Or External Reference Missing - Error Messages
If You Have a Problem Problem Symptoms and Solutions Frequency Unlock or External Reference Missing - Error Messages Symptom: A frequency unlock error message, or an external reference missing error message, appears in the annunciator bar just above the data window. Solution 1: The red Ext Ref message indicates that the external reference is not locked. -
Page 178: Measurement Keys Do Not Appear After Pressing The Mode Key
If You Have a Problem Problem Symptoms and Solutions Measurement Keys Do Not Appear after Pressing the Mode Key Symptom: After pressing the key, you have selected a particular MODE mode (like , or one of the measurement personalities), but Basic Service the menu for the mode you have selected does not appear on the... -
Page 179: Error Queues
If You Have a Problem Error Queues Error Queues If an error condition occurs in the instrument, it may be reported to both the history error queue (front panel display) and the SCPI error queue (remote interface). These two queues are viewed and managed separately. - Page 180 If You Have a Problem Error Queues Ext Ref (external reference) - The green Ext Ref annunciator indicates that the external reference has been selected and the instrument is locked to it. The red Ext Ref annunciator indicates that the external reference has been selected, but the instrument is not locked to that reference.
- Page 181 If You Have a Problem Error Queues Error Message Format Error messages will appear (in the format described below) in the Status/Info bar that appears at the bottom of the display. Generally the most recent message will appear, however there are occasions when an error message that has a higher priority will appear instead of the most recent one.
-
Page 182: Scpi Remote Interface Error Messages
If You Have a Problem Error Queues SCPI Remote Interface Error Messages Remote Error Queue This queue is constructed in a linear first-in/first-out fashion. It can hold up to 30 error messages. As errors and events are detected, they are placed in the queue. Unlike the history error queue, errors in this queue are not overwritten by the latest incoming error messages. -
Page 183: Clearing The Error Queue
If You Have a Problem Error Queues Clearing the Error Queue The error queue will only be cleared upon: • power up • receipt of a *CLS command • reading the last error from the queue No Error When all the errors have been read from the queue, further error queries will return: (0) No error This message indicates that the error queue contains no errors. -
Page 184: Error Message Descriptions
If You Have a Problem Error Message Descriptions Error Message Descriptions Messages with No Numbers Unnumbered messages are for operator information only and do not appear in any error queue. Description Acquiring Data... A warning used when the data acquisition time is long enough to be noticeable. - Page 185 If You Have a Problem Error Message Descriptions Please wait - Printing Waiting for the print job to complete. Settling Hardware... A warning used when the hardware settling time is long enough to be noticeable. Sync is RF ampl (not Training Seq). Bits not accurate. Chapter 6...
-
Page 186: Query Error Messages
If You Have a Problem Error Message Descriptions Query Error Messages [−499 to −400] An error number in the range [−499 to −400] indicates the instrument has found a problem when trying to respond to a SCPI query. The occurrence of any error in this class will cause the error query bit (bit 2) to be set in the event status register. -
Page 187: Device-Specific Error Messages
If You Have a Problem Error Message Descriptions Device-Specific Error Messages [−399 to −300] An error number in the range [−399 to −300] indicates that the instrument has detected an error where some device operations did not properly complete, possibly due to an abnormal hardware or firmware condition. - Page 188 If You Have a Problem Error Message Descriptions (-321) Out of memory Indicates that an internal operation needed more memory than was available. If this occurs during a memory catalog display, it means the system did not have enough free RAM to prepare the catalog.
-
Page 189: Execution Error Messages
If You Have a Problem Error Message Descriptions Execution Error Messages [−299 to −200] An error number in the range [−299 to −200] indicates that an error has been detected during instrument execution. The occurrence of any error in this class will cause the execution error bit (bit 4) in the event status register to be set. - Page 190 If You Have a Problem Error Message Descriptions (-284) Program currently running Indicates that certain operation related to programs may be illegal while the program is running (for example, deleting a running program may be illegal). (-283) Illegal variable name Indicates that an attempt was made to reference a nonexistent variable.
- Page 191 If You Have a Problem Error Message Descriptions (-274) Macro parameter error Indicates that the macro definition improperly used a macro parameter place holder (see IEEE 488.2, 10.7.3). (-273) Illegal macro label Indicates that the macro label defined in the *DMC command was a legal string syntax, but could not be accepted by the device (see IEEE 488.2, 10.7.3 and 10.7.6.2) (for example, the label was too long, the same...
- Page 192 The instrument is likely not functioning properly. Report this error to the nearest Agilent Technologies Sales and Service office. Refer to the Sales and Service Office table in the user’s guide for your instrument.
- Page 193 If You Have a Problem Error Message Descriptions (-233) Invalid version Indicates that a legal program data element was parsed but could not be executed because the version of the data is incorrect to the device. This particular error is used when file or block data elements are recognized by the instrument, but cannot be executed for reasons of version incompatibility (for example, a non-supported...
- Page 194 If You Have a Problem Error Message Descriptions (-221) Settings conflict Indicates that a legal program data element was parsed but could not be executed due to the current device state (see IEEE 488.2 11.5.1.1.5). (-220) Parameter error Indicates that a program data element related error has occurred.
- Page 195 If You Have a Problem Error Message Descriptions (-201) Invalid while in local Indicates that a command is not executable while the device is in local mode due to a hard local control (see IEEE 488.2, 5.6.1.5) (for example, a device with a rotary switch receives a message which would change the switch’s state, but the device is in local, so the message cannot be executed).
-
Page 196: Command Error Messages
If You Have a Problem Error Message Descriptions Command Error Messages [−199 to −100] An error number in the range [−199 to −100] indicates that an IEEE 488.2 syntax error has been detected by the instrument’s parser. The occurrence of any error in this class will cause the command error bit (bit 5) in the event status register to be set. - Page 197 If You Have a Problem Error Message Descriptions (-171) Invalid expression The expression data element was invalid (see IEEE 488.2, 7.7.7.2) (for example, unmatched parentheses or an illegal character). This error also occurs if a command is executed that is not valid for the current selected instrument mode.
- Page 198 If You Have a Problem Error Message Descriptions (-144) Character data too long The character data element contains more that twelve characters (see IEEE 488.2, 7.7.1.4). (-141) Invalid character data Either the character data element contains an invalid character or the particular element received is not valid for the header.
- Page 199 If You Have a Problem Error Message Descriptions (-121) Invalid character in number An invalid character for the data type being parsed was encountered (for example, an alpha in a decimal numeric or a “9” in octal data). (-120) Numeric data error This error is generated when parsing a data element which appears to be numeric, including non-decimal numeric types.
- Page 200 If You Have a Problem Error Message Descriptions (-108) Parameter not allowed More parameters were received than expected for the header (for example, the *ESE common command only accepts one parameter, so receiving *ESE 0,1 is not allowed). (-105) GET not allowed A Group Execute Trigger was received within a program message (see IEEE 488.2, 7.7).
-
Page 201: Instrument-Specific Error Messages
If You Have a Problem Error Message Descriptions Instrument-Specific Error Messages [positive numbers] Some instrument-specific error messages use the existing negative or “generic” SCPI error numbers with the addition of device-dependent or instrument-specific information following the semicolon in the error message. - Page 202 If You Have a Problem Error Message Descriptions Analog IF sample rate osc unlocked The 30 MHz sample rate oscillator on the A12 analog IF assembly is unlocked. Even second clock failing The even second clock is unlocked. No application file Catalog incomplete Application not licensed License key “word”...
- Page 203 If You Have a Problem Error Message Descriptions (16) Input Overload Decrease max total power in input. Excessive input power has been detected which will cause the ADC to clip the signal. Reduce the signal level, change the attenuator/max total power setting (under menu), or press if the...
- Page 204 If You Have a Problem Error Message Descriptions (26) Oven temp low The oven-controlled crystal oscillator is not at the desired operating temperature. (27) Alignment Needed The Auto Align routine needs to be run. At least 24 hours has passed since the last full alignment, or the temperature has changed 6°...
-
Page 205: Gsm - Specific Error Messages
If You Have a Problem Error Message Descriptions GSM - Specific Error Messages [100 to 199] An error number in the range [100 to 199] indicates the instrument has detected an error relating to the GSM personality. GSM - Specific Error Message Descriptions (Number) Description (100) - Page 206 If You Have a Problem Error Message Descriptions (110) Sync word not found In a GSM measurement using demodulation, the training sequence code (sync word) could not be found. (111) Signal too noisy In a GSM measurement, indicates that a burst could not be found in a signal that appears noisy.
-
Page 207: Cdmaone - Specific Error Messages
If You Have a Problem Error Message Descriptions cdmaOne - Specific Error Messages [200 to 299] An error number in the range [200 to 299] indicates the instrument has detected an error relating to the cdmaOne personality. cdmaOne - Specific Error Message Descriptions (Number) Description (200) -
Page 208: Nadc - Specific Error Messages
If You Have a Problem Error Message Descriptions NADC - Specific Error Messages [300 to 399] An error number in the range [300 to 399] indicates the instrument has detected an error relating to the NADC personality. NADC - Specific Error Message Descriptions (Number) Description (300) -
Page 209: Pdc - Specific Error Messages
If You Have a Problem Error Message Descriptions PDC - Specific Error Messages [400 to 499] An error number in the range [400 to 499] indicates the instrument has detected an error relating to the PDC personality. PDC - Specific Error Message Descriptions (Number) Description (400) -
Page 210: W-Cdma - Specific Error Messages
If You Have a Problem Error Message Descriptions W-CDMA - Specific Error Messages [500 to 599] An error number in the range [500 to 599] indicates the instrument has detected an error relating to the W-CDMA personality. W-CDMA - Specific Error Message Descriptions (Number) Description (501) -
Page 211: Warranty Information
Agilent Technologies from another country. Agilent Technologies warrants that its software and firmware designated by Agilent Technologies for use with an instrument will execute its programming instructions when properly installed on that instrument. Agilent Technologies does not warrant that the operation of the instrument, or software, or firmware will be uninterrupted or... -
Page 212: Returning Your Instrument To Agilent Technologies
Returning Your Instrument to Agilent Technologies Returning Your Instrument to Agilent Technologies If you are returning your transmitter tester to Agilent Technologies for servicing, fill out and attach a blue repair tag to the instrument. Repair tags are located at the end of this chapter. - Page 213 If You Have a Problem Returning Your Instrument to Agilent Technologies Table 6-1 Agilent Technologies Sales and Service Offices UNITED STATES Instrument Support Center Agilent Technologies (800) 403-0801 EUROPEAN FIELD OPERATIONS Headquarters France Germany Agilent Technologies S.A. Agilent Technologies France Agilent Technologies GmbH 150, Route du Nant-d’Avril...
- Page 214 If You Have a Problem Returning Your Instrument to Agilent Technologies Chapter 6...
-
Page 215: Repair Tag Goes Here
If You Have a Problem Repair Tag Goes Here! Remove This Page! Repair Tag Goes Here! Remove This Page! Chapter 6... - Page 216 If You Have a Problem Repair Tag Goes Here! Remove This Page! Chapter 6...
-
Page 217: Options And Accessories
Options and Accessories... -
Page 218: Options And Measurement Personalities
Options and Accessories Options and Measurement Personalities Options and Measurement Personalities Option BAH: GSM Measurement Personality Provides GSM transmitter measurements: power vs. time phase and frequency error output RF spectrum transmit band spurs And general transmitter measurements: transmit power spectrum (frequency domain) waveform (time domain) It includes GSM Measurement Guide and Programming Commands manual. -
Page 219: Option Bae: Nadc/Pdc Measurement Personalities
Options and Accessories Options and Measurement Personalities Option BAE: NADC/PDC Measurement Personalities Provides NADC transmitter measurements: error vector magnitude Provides PDC transmitter measurements: error vector magnitude occupied BW And general transmitter measurements: spectrum (frequency domain) waveform (time domain) It includes NADC/PDC Measurement Guide and NADC/PDC Programming Commands manual. -
Page 220: Option Baf: W-Cdma Measurement Personality
Options and Accessories Options and Measurement Personalities Option BAF: W-CDMA Measurement Personality Provides 3GPP W-CDMA transmitter measurements: channel power ACPR power statistics CCDF code domain power QPSK EVM modulation accuracy (rho) occupied BW spectrum emission mask inter-modulation multi-carrier power And general transmitter measurements: spectrum (frequency domain) waveform (time domain) It includes W-CDMA Measurement Guide and W-CDMA Programming... -
Page 221: Option 202: Edge (With Gsm) Measurement Personality
Options and Accessories Options and Measurement Personalities Option 202: EDGE (with GSM) Measurement Personality Provides EDGE (8PSK modulation) transmitter measurements: power vs. time output RF spectrum Provides GSM (GMSK modulation) transmitter measurements: power vs. time phase and frequency error output RF spectrum transmit band spurs And general transmitter measurements: transmit power... -
Page 222: Option 252: Retrofit Edge To Existing Gsm Measurement Personality
Options and Accessories Options and Measurement Personalities Option 252: Retrofit EDGE to Existing GSM Measurement Personality This option is only available as a retrofit kit (E4406AU Option 252) for instruments that are already licensed to use the GSM mode Option BAH. -
Page 223: Option 0Bw: Assembly-Level Service Documentation
Options and Accessories Options and Measurement Personalities Option 0BW: Assembly-level Service Documentation Adds assembly level service documentation. This option includes: Documentation Service Guide Specifications Option 1CM: Rack Mount Kit Includes rack mount flanges and hardware. Used to rack mount instruments without front handles. Available as P/N 5063-9215. Option 1CN: Handles Kit Also available as P/N 5063-9228. -
Page 224: Accessories
Options and Accessories Accessories Accessories AC Probe The HP/Agilent 85024A high frequency probe performs in-circuit measurements without adversely loading the circuit under test. The probe has an input capacitance of 0.7 pF shunted by 1 MΩ of resistance and operates over a frequency range of 300 kHz to 3 GHz. High probe sensitivity and low distortion levels allow measurements to be made while taking advantage of the full dynamic range of the instrument. -
Page 225: Rs-232 Cables
Options and Accessories Accessories RS-232 Cables Model Number Description HP 24542G 3 meter 9-pin (f) to 25-pin (m) RS-232 cable. Can be used with HP DeskJet printers, HP LaserJet Series printers, and PCs with 25-pin (f) RS-232 connectors. HP 24542U 3-meter 9-pin (f) to 9-pin (f) RS-232 cable for serial 9-pin PC connection to an instrument. - Page 226 Options and Accessories Accessories Chapter 7...
- Page 227 Index Numerics test description Averaging menu 50 MHz Amptd key DANL Avg Mode key 50 MHz Ref key test description Avg Number key data entry Avg Type key numeric keys Data Packing AC probe spectrum measurement Accessories Data Packing key Band Pwr key accessories waveform measurement...
- Page 228 Index SCPI remote interface error Install Now key queue installing measurement GPIB Address key troubleshooting front panel personalities GPIB cable unlock instrument firmware updates GPIB keys with no number instrument-specific errors ESC key positive numbers selecting Ethernet Addr key IP Address key ethernet key IP address keys Even Second error annunciator...
- Page 229 Index menu map combining the multiple signals feature cannot be accessed Min Pts in RBW key LAN connection mode correlation between symbols on power-on availability different codes basic digital signal processing selecting display RBW Filter key setup Gaussian line Rear panel connection keys Mouse Adapter (typical) set trace line rear panel connections...
- Page 230 Index Service menu test equipment Waveform (Time Domain) key 50 MHz Amptd functional testing website Front Panel Keys testing firmware updates Power vs Time warm-up times transmitter tester updates Sensors test list window Spectrum functional testing I/Q waveform Timebase testing RF envelope Waveform testing...