Table of Contents
Advertisement
Quick Links
Advertisement
Table of Contents

Subscribe to Our Youtube Channel
Related Manuals for Snap-On MODIS Edge


Summary of Contents for Snap-On MODIS Edge
-
Page 1: User Manual
User Manual ZEEMSAU341A Rev. A... - Page 2 Legal Information Trademarks Snap-on, ShopStream Connect, Fast-Track Troubleshooter and MODIS are trademarks registered in the United States and other countries of Snap-on Incorporated. All other marks are trademarks or registered trademarks of their respective holders. Copyright Information © 2016 Snap-on Incorporated. All rights reserved.
-
Page 3: Table Of Contents
Contents Chapter 1: Introduction......................5 Control Buttons........................5 Data and Power Connections....................6 Battery Pack and Stand......................7 Power Sources ........................8 Internal Battery Pack......................8 AC/DC Power Supply.......................8 Vehicle Power ........................8 Technical Specifications ......................9 Chapter 2: Basic Operation and Navigation ..............10 Turning On/Off and Emergency Shutdown................10 Turning On ........................10 Turning Off ........................10 Emergency Shutdown .................... - Page 4 OBD Direct ........................45 Chapter 5: Scope Multimeter..................... 52 Overview..........................52 Digital Multimeter (DMM) ....................52 Graphing Multimeter (GMM) ..................53 Lab Scope ........................54 Tests and Capabilities (Quick Reference) ................55 Test Leads and Accessories ....................57 Channel 1 Lead......................57 Channel 2 Lead......................57 Alligator Clips and Probes....................58 Secondary Ignition Coil Adaptor Lead and Clip-on Adaptor (optional) ......................
- Page 5 Chapter 7: Previous Vehicles and Data................113 Previous Vehicles and Data Menu ..................113 Vehicle History ......................113 View Saved Data ......................114 Delete Saved Data .......................115 Chapter 8: Tools .......................116 Tools Menu......................... 116 Connect-to-PC ......................117 Configure Shortcut Button....................117 System Information ......................118 Settings ........................118 Chapter 9: Maintenance ....................126 Cleaning and Inspecting the Diagnostic Tool ..............
-
Page 6: Safety Information
Safety Information READ ALL INSTRUCTIONS For your own safety and the safety of others, and to prevent damage to the equipment and vehicles upon which it is used, it is important that the accompanying Important Safety Instructions be read and understood by all persons operating, or coming into contact with, the equipment. We suggest you store a copy near the unit in sight of the operator. -
Page 7: Save These Instructions
Safety Information Safety Signal Words Safety Signal Words Safety messages are provided to help prevent personal injury and equipment damage. All safety messages are introduced by a signal word indicating the hazard level. Indicates an imminently hazardous situation which, if not avoided, will result in death or serious injury to the operator or to bystanders. - Page 8 Using This Manual Content This manual contains basic operating instructions and is structured in a manner to help you become familiar with your diagnostic tool features and perform basic operations. The illustrations in this manual are intended as reference only and may not depict actual screen results, information, functions or standard equipment.
- Page 9 Using This Manual Bold Text Bold emphasis is used in procedures to highlight selectable items such as control buttons, icons and menu options. Example: Press the OK button Notes and Important Messages The following messages are used. Notes A NOTE provides helpful information such as additional explanations, tips, and comments. Example: NOTE: For additional information refer to...
-
Page 10: Chapter 1: Introduction
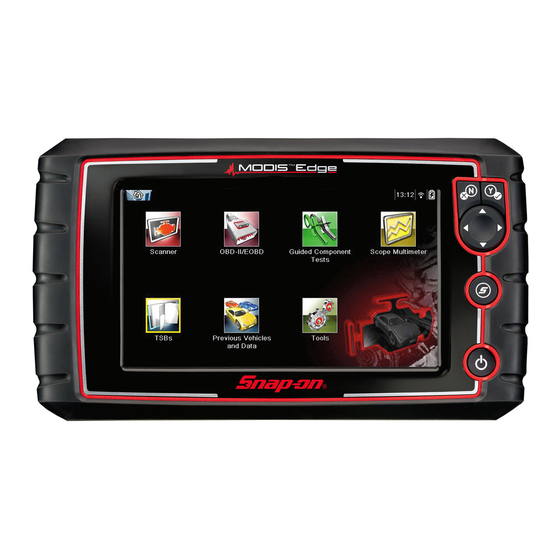
The MODIS Edge is a multi-function tool that combines a diagnostic scan Tool with a ® two-channel lab scope, graphing multimeter, and the exclusive Snap-on Guided Component Tests database into a single hand-held unit. This chapter introduces the basic features of the diagnostic tool, including the control buttons, data ports, battery pack, and power sources. -
Page 11: Data And Power Connections
Introduction Data and Power Connections Item Button Description Buttons move the cursor or highlight in their respective direction: • Up ( Directional - Thumb pad rocker type buttons • Down ( • Left ( • Right ( Programmable function button that can provide a S (Shortcut) - Push type shortcut for performing a variety of routine tasks. -
Page 12: Battery Pack And Stand
Introduction Battery Pack and Stand 1.3 Battery Pack and Stand Figure 1-3 Rear view Item Description Built in-Stand (shown closed) - The built-in stand extends from the back of the diagnostic tool and clips into the diagnostic tool for storage. Battery Cover... -
Page 13: Power Sources
Introduction Power Sources 1.4 Power Sources Your diagnostic tool can receive power from any of the following sources: Internal Battery Pack • AC/DC Power Supply • Vehicle Power • 1.4.1 Internal Battery Pack The diagnostic tool can be powered from the internal rechargeable battery pack. A fully charged battery provides sufficient power for about 3 hours of continuous operation. -
Page 14: Technical Specifications
Introduction Technical Specifications 1.5 Technical Specifications Item Description / Specification Touch Screen Resistive Touch Panel 8.0 inch diagonal, Colour LCD Display 800 x 480 resolution SWVGA Meter Category 1 Rechargeable lithium-ion battery pack Battery Approximately 3 hour run time Approximately 5 hour charge time Power Supply Supply Rating;... -
Page 15: Chapter 2 Basic Operation And Navigation
Basic Operation and Chapter 2 Navigation This chapter describes basic diagnostic tool operation, navigation, screen layout, icon functions, and screen messages. Before you operate the diagnostic tool, make sure the battery pack is fully charged or the diagnostic tool is powered by the AC power supply. 2.1 Turning On/Off and Emergency Shutdown The following sections describe how to turn the diagnostic tool on and off and how to perform an emergency shutdown. -
Page 16: Emergency Shutdown
Basic Operation and Navigation Basic Navigation 2.1.3 Emergency Shutdown IMPORTANT: Using the emergency shutdown procedure while communicating with the vehicle ECM may lead to ECM problems on some vehicles. During normal operation turn the diagnostic tool off using the Turning Off procedure above. The emergency shutdown procedure should only be used If the diagnostic tool does not respond to navigation or the control buttons, or exhibits erratic or abnormal operation. -
Page 17: Title Bar
Basic Operation and Navigation Basic Navigation 2.2.2 Title Bar The title bar at the top of the screen provides basic information about current diagnostic tool operating conditions. Title bar options vary depending upon vehicle make and model, what function is active, what test is being performed, or what menu is selected. The title bar contains information only, there are no selectable items. -
Page 18: Home Screen Icons
Basic Operation and Navigation Basic Navigation 2.2.3 Home Screen Icons Each available diagnostic tool function is represented by a icon on the home screen. The table below provides descriptions of the icon functions. Select an icon from the Home screen to start a function. You can also use the control buttons to activate a function, a yellow border around the icon indicates it is highlighted, or in focus. -
Page 19: Common Toolbar Control Icons
Basic Operation and Navigation Basic Navigation 2.2.4 Common Toolbar Control Icons Common control icon functions are described in the following table. Specific function control icons are described in their applicable chapters. Displayed control icons vary depending on the active function or test. Select a control icon on a screen to activate a control function. You can also use the control buttons to activate a function, a yellow border around the icon indicates it is highlighted, or in focus. -
Page 20: Scroll Bar
Basic Operation and Navigation Basic Navigation 2.2.5 Scroll Bar A vertical scroll bar appears along the right-hand edge of the screen when additional data expands above or below what is currently on the screen (Figure 2-2). Figure 2-2 Scroll bar 1—... -
Page 21: System Messages
Basic Operation and Navigation Screen Messages 2.3 Screen Messages 2.3.1 System Messages There are four types of system messages that may be displayed: Message Type Description Loading and connecting messages display when the diagnostic tool is performing an Loading and internal operation, such as loading a database, establishing communications with the Connecting vehicle, or initiating a test. -
Page 22: Data Cable Connection
Basic Operation and Navigation Data Cable Connection 2.4 Data Cable Connection Connection of the data cable to the diagnostic tool and vehicle DLC is required for Scanner and OBD-II/EOBD testing. Depending on the vehicle, the supplied DA-4 data cable may be used alone or may require optional adaptors. -
Page 23: Chapter 3 Scanner
Scanner Chapter 3 This chapter describes the basic operation of the Scanner function. The Scanner icon is located on the Home screen. The Scanner function allows your diagnostic tool to communicate with the electronic control systems of a vehicle. This allows you to retrieve diagnostic trouble codes (DTCs), view PID data and perform diagnostic tests. -
Page 24: Scanner Control Icons
Scanner Scanner Demonstration Program 3.1.2 Scanner Control Icons The scanner toolbar contains control icons. Control icons may vary depending on the active function or test. A yellow frame surrounding an icon (highlighted), indicates it is selected. Other control icons (not shown) are described in Common Toolbar Control Icons‚... -
Page 25: Scanner Operation
Scanner Scanner Operation 3.3 Scanner Operation Launching Scanner opens a menu list of vehicle manufacturers and begins the process by identifying the vehicle being tested. After the vehicle is identified, a vehicle system is selected and then a specific test or function is selected to allow you to retrieve diagnostic trouble codes (DTCs), view and save PID data, or perform diagnostic tests. - Page 26 Scanner Scanner Operation Figure 3-2 Manufacturer list A model year menu displays. 3. Select the vehicle year. 4. If the vehicle supports automatic identification, a menu choice will display providing the option to either “Auto ID the vehicle” or “Manual ID the vehicle”. Selecting Auto ID will automatically enter the vehicle’s information, and then display the vehicle confirmation screen, see step 7.
-
Page 27: Connecting The Data Cable
Scanner Scanner Operation 3.3.2 Connecting the Data Cable Connection of the data cable to the diagnostic tool and vehicle DLC is required for Scanner testing, see Data Cable Connection‚ on page 17. 3.3.3 System Selection After a vehicle is identified, a menu of available systems, and options are displayed (Figure 3-4). - Page 28 Scanner Scanner Operation Code Scan Depending on the vehicle, the Code Scan option (if supported) may be available from the menu. Selecting Code Scan starts an active scan of vehicle control modules, and opens the Code Scan results screen (Figure 3-6).
- Page 29 Scanner Scanner Operation • A list of all the systems analyzed with DTCs totals. A categorized system list with DTC totals is displayed in the order they are scanned. To view the main menu for a system in the list, select the system, then select the System icon (Figure 3-7).
- Page 30 Scanner Scanner Operation • Global OBDII DTCs. Towards the end of the Code Scan list Global OBDII DTCs are displayed. Figure 3-9 NOTE: Some vehicles may not display global OBD-II information in the Code Scan list. A message will be displayed to inform you the OBD-II - codes and monitors for this vehicle may be accessed using the global OBD-II function.
-
Page 31: System Main Menu Options
Scanner Scanner Operation Saving Code Scan Data Selecting the Save icon from the Code Scan toolbar saves the Code Scan results as an (.XML) file. The (.XML) file can be reviewed, by selecting Previous Vehicles and Data > View Saved Data and then selecting the (.XML) file from your saved file list. - Page 32 Scanner Scanner Operation Codes Menu This selection may appear as Codes, Codes Menu, Codes Only, Codes (No Data), Service Codes or something similar on the menu. Selecting opens a list of viewing options that includes: • Display Codes • Clear Codes‚...
- Page 33 Scanner Scanner Operation Saving and Reviewing Codes Selecting the Save icon saves the displayed DTC results list as an (.XML) file. The (.XML) file can be reviewed, by selecting Previous Vehicles and Data > View Saved Data and then selecting the (.XML) file from your saved file list (Figure 3-12).
- Page 34 Scanner Scanner Operation Viewing Saved DTC Files in ShopStream Connect (Vehicle System Report) Saved DTC (.XML) files can also be transfered to a personal computer (PC) using ShopStream Connect (Figure 3-13). Once the diagnostic tool is connected to the PC, (.XML) files can be printed, transferred, and copied.
- Page 35 Scanner Scanner Operation Clear Codes The diagnostic tool clears codes from the vehicle electronic control module memory on most vehicles. If this function is not available on the test vehicle, Clear Codes does not appear as a menu option. NOTE: Clear Codes is also available from OBD-II Health Check (see OBD Health Check‚...
- Page 36 Scanner Scanner Operation Figure 3-14 DTC Status entry field Data Display Select Data to view PID data from the vehicle ECM. In data display mode the screen has a toolbar and a main body (Figure 3-15). Figure 3-15 Data display screen The toolbar control icons are described in Scanner Control Icons‚...
- Page 37 Scanner Scanner Operation During data display the main body of the screen is divided into two columns; the left-hand column has a description of the parameter and the right-hand column shows the parameter value or state. Parameters are listed in the order in which they are transmitted by the ECM, so expect variations between years, makes, and models.
- Page 38 Scanner Scanner Operation Changing Screen Views Selecting the View icon opens a drop-down menu of options: • PID List 1 Graph • 2 Graph • 4 Graph • The PID (parameter identification) List view is a 2-column display with the name of the parameters in the left column and their current values in the right column.
- Page 39 Scanner Scanner Operation To lock parameters: 1. Highlight the parameter to be locked. 2. Select the Lock/Unlock icon on the toolbar to lock it. A copy of the locked parameter is now shown at the top of the data list, and a lock icon appears alongside the parameter name.
- Page 40 Scanner Scanner Operation Trigger lines change colours to indicate the trigger is armed. Clear All Triggers—deletes all previously set trigger levels. • If triggers are set the menu options are: • Clear Trigger—deletes set trigger levels for the highlighted parameter. •...
- Page 41 Scanner Scanner Operation NOTE: Only three parameters can have trigger levels set at one time, but only one of the conditions needs to be satisfied for triggering to occur. To arm triggers: 1. Select the Trigger icon on the toolbar. 2.
- Page 42 Scanner Scanner Operation To save data: Select Save. • A save dialog box displays while data is being saved. The data is saved when the message box disappears. Figure 3-19 Save dialog box Saving Screens The Shortcut button can be programmed to save a snapshot of a visible screen as a bitmap file, Configure Shortcut Button‚...
- Page 43 Scanner Scanner Operation 1— Skip Back 6— Bar Graph 2— Skip Forward 7— Slider 3— Step Back 8— Counter (current position / total) 4— Step Forward 9— Cursor 5— Record Figure 3-20 2. Scroll up or down to review the list of data. 3.
- Page 44 Scanner Scanner Operation Functional Tests The Functional Tests selection is used to access vehicle-specific subsystem tests. Available tests vary by manufacturer, year, and model. Only the tests available for the identified vehicle display in the menu. There are several types of functional tests: •...
- Page 45 Scanner Scanner Operation Generic Functions Generic Functions are use to perform generic OBD-II/EOBD tests, for additional information see Direct‚ on page 45. ® Troubleshooter (Fast-Track Fast-Track Troubleshooter is a database of experience-based repair strategies and information, that has been compiled and validated by top-notch technicians. Troubleshooter simplifies the diagnosis process, as it contains information on virtually all common diagnostic trouble code (DTC) problems and driveability symptoms.
-
Page 46: Exiting Scanner
Scanner Exiting Scanner Figure 3-22 Troubleshooter tip 3.4 Exiting Scanner Scanner function remains open as long as there is an active communication link with the vehicle. You must interrupt this communication link in order to exit from tests and power down the diagnostic tool. -
Page 47: Chapter 4: Obd-Ii/Eobd
OBD-II/EOBD Chapter 4 This chapter describes the basic operation of the OBD-II/EOBD function. The OBD-II/EOBD icon is located on the Home screen. The OBD-II/EOBD function allows you to access “generic” OBD-II/EOBD data. Generic OBD-II/EOBD data is data limited to emission related diagnostics such as: •... -
Page 48: Obd Health Check
OBD-II/EOBD OBD-II/EOBD Menu 4.2.1 OBD Health Check The OBD-II Health Check offers a way to quickly check for and clear emissions-related diagnostic trouble codes (DTCs), and to check readiness monitors for emissions testing. Selecting opens a connection message. Select Continue or press the Y/a button to open a submenu of test options (Figure 4-1). - Page 49 OBD-II/EOBD OBD-II/EOBD Menu Pending Codes The purpose of this service is to enable the diagnostic tool to obtain “pending” or maturing diagnostic trouble codes. These are codes whose setting conditions were met during the last drive cycle, but need to be met on two or more consecutive drive cycles before the DTC actually sets. NOTE: Save valuable time by using this service to verify test results after a single drive cycle following a vehicle repair and code clearing procedure.
-
Page 50: Obd Direct
OBD-II/EOBD OBD-II/EOBD Menu Selection of either option displays test results as shown in the data viewer (Figure 4-3). Quick reference indicators are used to show monitor status on the left side of the screen (Figure 4-3): • Green icon “a” mark - Monitor test is complete •... - Page 51 OBD-II/EOBD OBD-II/EOBD Menu Start Communication Use the following procedure to begin an OBD-II/EOBD test session: To perform an OBD-II/EOBD Test: 1. Connect the data cable to the test vehicle. 2. Select Start Communications from the OBD-II/EOBD menu. A series of messages are displayed indicating automatic detection of vehicle type (12 or 24 V) has occurred and then the detected controllers are displayed.
- Page 52 OBD-II/EOBD OBD-II/EOBD Menu IMPORTANT: All service modes are not supported by all vehicles, so the available menu selections will vary. Figure 4-5 Service mode menu 4. Select a test to continue. Readiness Monitors Use this menu item to check the readiness of the monitoring system. Monitors not supported will display “not supported”.
- Page 53 OBD-II/EOBD OBD-II/EOBD Menu ($01) Display Current Data Use this test to display the serial data transmitted by the selected vehicle electronic control module (ECM). The main body of the screen has two columns; the left-hand column is a description of the parameter and the right-hand column is the parameter value or state. Viewing options and operations are the same as the Scanner function, see Data Display‚...
- Page 54 OBD-II/EOBD OBD-II/EOBD Menu To clear emission related Data: 1. Select Clear Emissions Related Data from the menu. A confirmation message displays to help prevent loss of any vital data (Figure 4-7). Figure 4-7 Clear codes confirmation message 2. Continue from the confirmation message. The screen updates several times as ECM memory is erased, then a “data has been cleared”...
- Page 55 OBD-II/EOBD OBD-II/EOBD Menu ($07) DTCs Detected During Last Drive This test opens a record of any DTCs that set during the last completed drive cycle. Select to open the DTC list. ($08) Request Control of On-board System This service enables bidirectional control of the ECM. This service allows the diagnostic tool to control the operation of an on-board system, test, or component.
- Page 56 OBD-II/EOBD OBD-II/EOBD Menu Manual Protocol Selection Communication protocol is a standardized way of transferring data between an ECM and a diagnostic tool. Global OBD may use the following communication protocols: • ISO 15765-4 (CAN) • ISO 27145 (WWHOBD CAN) ISO J1939 (CAN) •...
-
Page 57: Chapter 5: Scope Multimeter
Scope Multimeter Chapter 5 The Scope Multimeter function allows you to perform multiple types of circuit and component measurement tests. This chapter includes general operation procedures, instructions for saving and reviewing test data, optional settings, and general reference information. 5.1 Overview The Scope Multimeter test functions are: •... -
Page 58: Graphing Multimeter (Gmm)
Scope Multimeter Overview 5.1.2 Graphing Multimeter (GMM) Unlike the DMM, the graphing multimeter provides two channels for testing and plots a visual graphing line of the signal instead of displaying digital values. The GMM displays a signal’s measurements over time on a two-dimensional grid. This plotted graph is basically a graphical history (histogram) of the signal’s measurements over time. -
Page 59: Lab Scope
Scope Multimeter Overview 5.1.3 Lab Scope Similar to the GMM, the lab scope (oscilloscope) plots a visual image line of a signal’s measurements over time on a two-dimensional grid. The visual line that is displayed is commonly called a trace, and the graphical form created by a signal is called a waveform. Unlike the DMM, the lab scope allows you to visually see a signals waveform, which in turn allows you to see the strength and shape of the signal, as well as any noise that may be occurring on the circuit. -
Page 60: Tests And Capabilities (Quick Reference)
Scope Multimeter Tests and Capabilities (Quick Reference) 5.2 Tests and Capabilities (Quick Reference) The following chart identifies and describes available tests by function. NOTE: Not all the tests listed are described in this manual. This list is intended as reference only. Test Function Two Channel Lab Scope... - Page 61 Scope Multimeter Tests and Capabilities (Quick Reference) Test Function Used to measure amperage of typical motors and devices Low Amps (40) that may draw up to 40A peak (startup) when initially started. Used to measure amperage of larger motors and devices Low Amps (60) that may draw up to 60A peak (startup) when initially started.
-
Page 62: Test Leads And Accessories
Scope Multimeter Test Leads and Accessories 5.3 Test Leads and Accessories Some of the leads, probes and adaptors supplied with or that may be available, are explained in the following section. NOTE: Not all test leads and/or accessories may be available in all markets. Contact your sales representative for information, or to find out more about these and other available accessories. -
Page 63: Alligator Clips And Probes
Scope Multimeter Test Leads and Accessories 5.3.3 Alligator Clips and Probes Insulated alligator clips and probes (pointed type) can be attached to the end of the test leads. Each alligator clip is colour matched with a test lead, and the probes are available in red and black. Figure 5-3 Alligator clips 5.3.4 Secondary Ignition Coil Adaptor Lead and Clip-on Adaptor (optional) -
Page 64: Low Amp Current Probe (Optional)
Scope Multimeter Test Leads and Accessories 5.3.5 Low Amp Current Probe (optional) The Low Amp Current Probe is used measure AC or DC current up to 60A. This probe includes two scales (0 to 20A) and (0 to 60A) that can be used to provide accurate and reliable non- intrusive current measurement for components such as, ignition coils, fuel injectors, fuel pumps, relays, and electric motors. -
Page 65: General Information
Scope Multimeter General Information 5.4 General Information This section describes the general Scope Multimeter control icon functions, screen layout and optional settings. The screen layout and control icon functions are shared between the digital/graphing multimeters and lab scope. NOTE: Scope and Multimeter tests are not vehicle specific, therefore vehicle identification is not required. 5.4.1 Scope Multimeter Screen Layout and Features 1—... - Page 66 Scope Multimeter General Information Scope Multimeter Control Icons The following control icons are common across most Scope Multimeter functions, however use may vary depending on the active function or test. A yellow frame surrounding an icon (highlighted), indicates it is selected. Other control icons (not shown) are described in Common Toolbar Control Icons‚...
-
Page 67: Measurement Out Of Range (Alert)
Scope Multimeter General Information 5.4.2 Measurement Out of Range (Alert) When performing a test, if a group of arrows displays onscreen, this indicates that the measurement is out of range for the scale selected. • Arrows pointing UP—measurement over maximum range Arrows pointing DOWN—measurement under minimum range •... -
Page 68: Operation And Controls
Scope Multimeter Operation and Controls 5.5 Operation and Controls This section describes the general operation and controls used to configure the scope or meter to perform testing. All three functions share similar control panel settings, see Control Panel and Settings‚ on page 65 for additional information. NOTE: The information in the following sections is intended as a guide and general overview of the controls and functions used within the Scope Multimeter. -
Page 69: Test Lead / Probe Calibration
Scope Multimeter Operation and Controls 5.5.2 Test Lead / Probe Calibration Certain tests may display a confirmation prompt asking “Do you wish to calibrate this probe?” before continuing with the test. As general practice, it is important to ensure the test probe is calibrated before testing, to ensure accurate results. -
Page 70: Control Panel And Settings
Scope Multimeter Operation and Controls 5.5.3 Control Panel and Settings The control panel is common to all three Scope Multimeter functions, and contains the channel (or “trace”) settings and controls that are used to monitor and adjust the signal being measured. - Page 71 Scope Multimeter Operation and Controls Scale, Sweep and Probe Settings The most common and typically the first adjustments made when performing tests are the setup or adjustment of the scales and selection of a probe. All three of these adjustments are made from the control panel and are described in the following sections.
- Page 72 Scope Multimeter Operation and Controls Example: Selecting 10V, changes the vertical scale to a 10V volt scale. The scale is “always” divided by 10, therefore each division is incremented by 1V. Figure 5-13 Example: Selecting 50 psi displays a 50 psi scale that is divided by 10, therefore each division is incremented by 5 psi.
- Page 73 Scope Multimeter Operation and Controls To adjust the sweep scale unit of measurement value, select the Sweep Scale icon to open the sweep scale menu. Select a value then press the N/X button, to exit the menu. 1— Sweep Scale 2—...
- Page 74 Scope Multimeter Operation and Controls Probe (Probe type “test” selection) Different types of Probes are available from the probe option menu, depending on which type of test you are performing. Changing the probe selection, also changes the vertical scale to the applicable type of measurement.
- Page 75 Scope Multimeter Operation and Controls Channel Settings The majority of the channel (trace) settings and controls are located in the Control Panel. Each setting is represented by an icon, or a value. Icons are used to make adjustments, and the displayed values represent an individual characteristic.
- Page 76 Scope Multimeter Operation and Controls Show/Hide (Channel display on/off) The Show/Hide icons allow you to turn the channels on and off. To turn a channel on and off, select the applicable channel’s Show/Hide icon. Show/Hide Icons On (Channel displayed) Off (Channel not displayed) Trace (Zero Baseline position adjustment) The Trace icon identifies the channel number and is used to open the zero baseline adjustment controls.
- Page 77 Scope Multimeter Operation and Controls Peak Detect On When peak detect is “on”, all sample points are evaluated. The points stored to the data buffer memory are intelligently selected to capture fast events that might be missed at slower effective sample rates.
- Page 78 Scope Multimeter Operation and Controls To turn the filter on and off, select the Filter icon. Filter Icons On (Interference is suppressed) Off (Interference is not suppressed) Invert The Invert feature is used to switch signal polarity, so the trace appears upside down (inverted) on the screen.
- Page 79 Scope Multimeter Operation and Controls The trigger feature allows you to set the conditions of that “specific point” also called a “trigger point”. When the trigger conditions are set, and a trace “meets” those conditions (crosses the trigger point), the trace will start. Trigger conditions: •...
- Page 80 Scope Multimeter Operation and Controls The trigger position control panel opens. 5. Use the directional controls provided, or the thumbpad directional controls to move the trigger marker into position (Figure 5-19). Sweep and vertical scale values are provided in the trigger position control panel, which gives you the precise position of the trigger marker.
- Page 81 Scope Multimeter Operation and Controls Trigger Auto/Manual Mode (Optional Setting) NOTE: The Auto and Manual Trigger modes allow you to set the criteria used to display signals on the screen. To change the trigger mode, the trigger must be set on one of the channels. In both Auto and Manual Trigger mode the screen is updated when the signal crosses the trigger point in the selected direction (rising or falling), however: •...
- Page 82 Scope Multimeter Operation and Controls To activate the Threshold function, select the Threshold icon, then select Continue from the confirmation screen (Figure 5-21). Once selected, the Threshold function remains active until the test is exited. Figure 5-21 Auto Threshold Confirmation Screen If after enabling the Threshold function, if the signal is still not displayed, reduce the vertical scale setting.
- Page 83 Scope Multimeter Operation and Controls Min, Live and Max Display Panel When Cursors are turned off, the Min, Live and Max display panel (Figure 5-22) is turned on displaying each channel’s active signal minimum and maximum recorded measurements and live measurement.
- Page 84 Scope Multimeter Operation and Controls To turn the cursors on/off: 1. To turn the Cursors on (display), select the Cursor icon from the toolbar. Two cursors are displayed on the test screen, and the Refresh, Min, Live, Max display panel is switched off and replaced by the cursor measurements panel.
-
Page 85: Secondary Ignition Testing
Scope Multimeter Operation and Controls Cursor Measurements Panel When the cursors are turned on, the Refresh, Min, Live, Max display panel is switched off and replaced by the Cursor Measurements Panel. The cursor measurements panel displays the following signal and cursor measurements: Signal amplitude at two points •... - Page 86 Scope Multimeter Operation and Controls Different secondary ignition coil adaptors are available as optional equipment. These adaptors attach to either the secondary lead (spark plug lead) or directly to the secondary ignition coil in order to pick up the secondary ignition signal. –...
-
Page 87: Optional Settings
Scope Multimeter Optional Settings Once a signal is displayed, further channel settings may be required to display the pattern characteristics you a looking for. Figure 5-24 Typical Secondary Ignition Signal 5.6 Optional Settings The following optional Scope/Meter settings are available, and can be set to your preference: •... -
Page 88: Divisions
Scope Multimeter Optional Settings Changing the Display (grid on/off): 1. Select the Tools icon from the Home screen. 2. Select Settings > Configure Scope/Meter > Display from the menu options. 3. Select the desired option: – Show Grid—turns grid lines on –... - Page 89 Scope Multimeter Optional Settings 5. Select either option: Trace Settings - see Trace Settings‚ on page 84 – – Display Settings - see Display Settings‚ on page 85 6. Select the Back icon or press the N/X button to return to the Settings menu. Trace Settings The Trace Settings option allows you to change how the vertical scale menu selections are represented.
-
Page 90: Display Settings
Scope Multimeter Optional Settings Trace Per Division - changes the dropdown vertical scale menu selections to ##/div mode, which in turn changes the vertical scale to represent ## by division. ## - represents (variable) what is being measured (voltage, amperage, pressure etc.) Example (Figure 5-28): Selecting 1.0V/div, displays a vertical scale divided by 10. -
Page 91: Saving And Reviewing Scope / Multimeter Data Files
Scope Multimeter Saving and Reviewing Scope / Multimeter Data Files Display Per Division - displays the graduation value of the major scale divisions Example (Figure 5-30): If the vertical scale is set to 1V, the value displayed is 0.1V. Figure 5-30 5.7 Saving and Reviewing Scope / Multimeter Data Files The following section describes the procedures used to save and review Scope/Multimeter and Guided Component Tests data files. -
Page 92: Saving Files
Scope Multimeter Saving and Reviewing Scope / Multimeter Data Files 1— Data Buffer Indicator Slider 2— Data Buffer Indicator Bar Graph 3— Data Buffer Position Counter Figure 5-31 Buffer memory is limited to a predetermined “total” size. When buffer memory reaches it’s full capacity, the data buffer will continue to store new data, however earlier stored data will be removed to allow room for the new data being stored. -
Page 93: Stopping And Reviewing Data Files
Scope Multimeter Saving and Reviewing Scope / Multimeter Data Files A save dialog box displays while files are being saved. The file is saved when the message box disappears. Figure 5-32 Save dialog box 5.7.3 Stopping and Reviewing Data Files During normal scope multimeter operation, data is continuously being store stored in buffer memory as it is displayed onscreen. -
Page 94: Saving Screens
Scope Multimeter Saving and Reviewing Scope / Multimeter Data Files 1— Skip Back 4— Step Forward 2— Skip Forward 5— Record 3— Step Back 6— Data Buffer Indicator Slider Figure 5-33 To resume: Select the Record icon. • The display changes back and the Stop icon is shown on the toolbar. NOTE: The Shortcut button can be set to perform the Pause/Play function. - Page 95 Scope Multimeter Saving and Reviewing Scope / Multimeter Data Files During data capture, the default magnification level is 1x. The zoom function is not available until data capture is stopped by pressing the Stop icon (Figure 5-35). 1— Stop Control Icon Figure 5-34 NOTE: Zoom playback controls are identical to the standard playback controls used when reviewing data...
- Page 96 Scope Multimeter Saving and Reviewing Scope / Multimeter Data Files 1— Waveform Glitches 3— Zoom Magnification Level (Max shown) 2— Zoom Icon 4— Zoom Cursor Figure 5-35 “Max" Magnification Level - displays all captured data When zoom levels of 2X and higher are selected, a Zoom cursor (vertical dashed line) (Figure 5-35) displays onscreen.
- Page 97 Scope Multimeter Saving and Reviewing Scope / Multimeter Data Files 1— Waveform Glitches 3— Magnification Level at 32X 2— Magnification Level at 128X Figure 5-36 Examples of Magnification Level at 32X and 128X Figure 5-37 shows an example at 16X of the same waveform shown in Figure 5-35 Figure 5-36.
-
Page 98: General Reference
Scope Multimeter General Reference 5.8 General Reference 5.8.1 Basic Setup Tips (unknown signal type) When conducting automotive diagnostics, situations may arise when you need to capture and analyze a signal that you are not familiar with, or know what the intended waveform pattern should look like, or even how to set the scope to acquire the signal. -
Page 99: Using Known Good Waveforms
Scope Multimeter General Reference As a default setting, trigger is normally off. The scope/meter uses internal circuitry to display a signal if present. However, in certain circumstances additional channel adjustments may be required, or the trigger mode may have to be turned on, for a signal that is present but is not displayed. -
Page 100: Troubleshooting Signals
Use the shortest test leads possible. • Try different test leads, to verify the issue. Use the recommended snap-on leads or probes • available for the diagnostic tool or equivalent. Shielded test leads are recommended. Check the test lead or probes for damage. -
Page 101: Units Of Measurement / Conversions
Scope Multimeter General Reference 5.8.4 Units of Measurement / Conversions Base Units (Symbol) / Unit Prefix Typical Expressions (µ) micro 0.000001 or 10 or 1/1,000,000 (m) milli 0.001 or 10 or 1/1,000 (c) centi 0.01 or 10 or 1/100 (k) kilo or 1,000 or 1,000,000 (M) mega... - Page 102 Scope Multimeter General Reference Pressure Units (Symbol) / Description Equivalents (kPa) KiloPasca 1 kPa = 1000 Pa (MPa) Megapascal 1 MPa = 1,000,000 Pa 1 inHg = 0.03386388 bar (inHg) inches of mercury 1 inHg = 0.4911541 psi 1 inHg = 3386.388 Pa Pressure Conversions psi x 0.0689 = bar psi x 6.8950 = kPa...
-
Page 103: Glossary Of Common Terms
Scope Multimeter General Reference Duty % to Dwell Conversions Duty Cycle Dwell 4 cyl 6 cyl 8 cyl 36.0 24.0 18.0 45.0 30.0 22.5 54.0 36.0 27.0 63.0 42.0 31.5 72.0 48.0 36.0 81.0 54.0 40.5 90.0 60.0 45.0 5.8.5 Glossary of Common Terms Term / Abbreviation Description Alternating Current - electrical current that switches polarity at... - Page 104 Scope Multimeter General Reference Term / Abbreviation Description Horizontal Scale See Sweep Scale Invert Function used to switch signal polarity, Used to represent a numerical value denoting the actual measured air/fuel ratio with respect to the ideal air/fuel ratio at stoichiometry.
- Page 105 Scope Multimeter General Reference Term / Abbreviation Description The threshold function automatically sets a trigger and determines a threshold level in the middle of the signal range Threshold (calculated from the Min and Max measurements) to be used as a reference point to calculate the measurement. Trace The actual visible line displayed on the scope screen.
-
Page 106: Chapter 6 Guided Component Tests
Guided Component Tests Chapter 6 The Guided Component Tests function provides you with an extensive collection of vehicle specific component tests and reference information. It is like having access to a complete library of automotive repair manuals for testing multiple vehicle components. The preconfigured meter tests and reference information provided are vehicle specific and designed to help save you diagnostic time, verify faulty components, and verify the repair. -
Page 107: Power User Tests
Tests: • Current Probe Tests - provides common tests configured to use the Snap-on Low Amp Current probes or generic Low Amp Current probes. Snap-on Low Amp Current Probe operation information is also provided within the Snap-on Low Amp Probe Reference Manual option. - Page 108 • Non-Heated Oxygen Sensor • Open and Closed Loop • Oxygen Sensor Types • Understanding Oxygen Sensors (includes configured meter test) Snap-on Automotive Theory— provides basic theory information on multiple topics • including: • Air Conditioning • Diagnosing Battery Draws •...
- Page 109 20-minute Current Ramp Classes—provides an introduction to current ramp testing using the Snap-on Low Amp Current Probes. Snap-on Low Amp Current Probe operation information is also provided within the Snap-on Low Amp Probe Reference Manual option. Topics may include: • Fuel Injector Current Ramp (multiple types) •...
-
Page 110: Screen Layout And Icons
Guided Component Tests Screen Layout and Icons 6.2 Screen Layout and Icons This section describes the Guided Component Tests control icon functions and screen layout. 6.2.1 Screen Layout 1— Vehicle Identification 2— Toolbar—contains control icons 3— Main Body—displays menus, information, meter scales and signal traces 4—... - Page 111 Guided Component Tests Screen Layout and Icons 6.2.2 Guided Component Tests Control Icons Guided Component Tests toolbar control icons may vary depending on the active function or test. A yellow frame surrounding an icon (highlighted), indicates it is selected. Other control icons (not shown) are described in Common Toolbar Control Icons‚...
-
Page 112: Operation
Guided Component Tests Operation 6.3 Operation As the information and tests provided within the Guided Component Test function is vehicle specific, the vehicle must first be identified in order to retrieve the correct data. To identify a vehicle: The vehicle identification process is the same as the process used for the Scanner function, Vehicle Identification‚... -
Page 113: Component Information
Guided Component Tests Operation Depending on the vehicle and component selected, different options and sub-menus may be displayed. Information and tests may vary: • Component Information— see Component Information‚ on page 108. • Tests— see Tests‚ on page 110. • Reference Information—provides identification of components, connector pin location and functions, and abbreviation reference. - Page 114 Guided Component Tests Operation Component Information is displayed (Figure 6-6 Figure 6-7). Figure 6-6 Component Information Screen Figure 6-7 Component Information Screen - Continued Screens are divided into sections to quickly guide you to the correct information (available sections and information will vary): •...
-
Page 115: Tests
Guided Component Tests Operation 6.3.2 Tests Tests provides (if available) specific instructions to help you perform tests on components. Selecting a component test opens a preconfigured meter to start the test, and may also provide connection instructions, specifications and testing tips. To select a test: 1. - Page 116 Guided Component Tests Operation The test screen displays (Figure 6-9). A Guided Component Test screen initially opens with the information panel below the main body. Use the scrollbar to display hidden information. Figure 6-9 Test screen Tap on the Information Panel once to display the information panel in full screen view. Tap on it again to return to split view.
-
Page 117: Saving And Reviewing Data Files
Guided Component Tests Operation Figure 6-11 Waveform Example 3. Select Back on the toolbar to return to the menu. Channel Settings The test meter is preconfigured, for most of the component tests. However, if the need to change channel settings is needed, adjustments can be made by selecting the Control Panel icon from the toolbar to display the Control Panel (Figure 6-12). -
Page 118: Chapter 7 Previous Vehicles And Data
Previous Vehicles and Data Chapter 7 This chapter describes the basic operation of the Previous Vehicles and Data function. The Previous Vehicles and Data icon is located on the Home screen. This function allows you to select recently tested vehicles and access saved data files. 7.1 Previous Vehicles and Data Menu The following options are available from the Previous Vehicles and Data menu: •... -
Page 119: View Saved Data
Previous Vehicles and Data Previous Vehicles and Data Menu 3. With the item to be opened highlighted, either select the vehicle ID or press the Y/a button. The appropriate software loads and a vehicle ID confirmation screen displays. 4. Select OK or press the Y/a button to continue. The System Menu for the selected vehicle displays. -
Page 120: Delete Saved Data
Previous Vehicles and Data Previous Vehicles and Data Menu 7.1.3 Delete Saved Data This menu option is used to permanently erase saved files from memory. To delete a saved file: 1. Select Previous Vehicles and Data from the Home screen. 2. -
Page 121: Chapter 8 Tools
Tools Chapter 8 This chapter describes the basic operation of the Tools function. The Tools icon is located on the Home screen. This function allows you to configure diagnostic tool settings to your preferences. 8.1 Tools Menu The following options are available from the Tools menu: •... -
Page 122: Connect-To-Pc
Tools Tools Menu 8.1.1 Connect-to-PC Connect-to-PC allows you to transfer saved data files on your diagnostic tool to your personal computer using a USB cable. The optional ShopStream Connect™ PC software allows you to view, print and save data files on your PC. -
Page 123: System Information
8.1.3 System Information System Information allows you to view patent information and system information such as the software version and serial number of your diagnostic tool. ® 2016 Snap-on Incorporated. All Rights reserved. 10/16/2016 11:01PM MODIS Edge Bundle: 16.4 Version: 1.5.0.16300 AU RUNTIME: 5.3.2.5... - Page 124 Tools Tools Menu Display options include: • Brightness‚ on page 119—adjusts the intensity of the screen back lighting. Colour Theme‚ on page 120—changes the background colour of the screen display. • High Contrast Toolbar‚ on page 120—enhances toolbar graphics for poor lighting conditions. •...
- Page 125 Tools Tools Menu Colour Theme This option allows you to select between a white and black background for the screen. The black background can be beneficial when working under poor lighting conditions. Selecting opens a menu with two choices: Day Theme (white background) and Night Theme (black background).
- Page 126 Tools Tools Menu Font Type This option allows you to select between standard and bold faced type for the display screen. Bold type makes screen writing more legible under poor lighting or bright sunlight conditions. Figure 8-5 Bold type on a black background Selecting opens a menu with two choices: Normal Font and Bold Font.
- Page 127 Tools Tools Menu Touch Screen Calibration Calibrating the touch screen maintains the accuracy of the touch-sensitive display. IMPORTANT: To avoid serious damage to the diagnostic tool, always complete the touch screen calibration sequence once it has begun. Never turn off the diagnostic tool while a screen calibration is in process.
- Page 128 Tools Tools Menu Clock Settings This option opens a window for resetting the time on the real-time clock. To set the clock: 1. Select Tools from the Home screen to open the menu. 2. Select Settings from the menu. 3. Select Clock Settings from the menu. A warning message briefly displays followed by the Clock Settings screen (Figure 8-7).
- Page 129 Tools Tools Menu Time Format This option determines whether time is displayed on a 12 or 24 hour clock. Selecting opens a menu with two choices: • 24 Hour Format • 12 Hour Format Make either selection, then select the Back icon or press the N/X button to return to the menu. Date Format This option allows you to select how date information is displayed.
- Page 130 Tools Tools Menu To change hide/show scales: 1. Select Tools from the Home screen. 2. Select Settings from the Tools and Setup menu. 3. Select Configure Scanner from the Settings menu. 4. Highlight either menu entry to make a selection: –...
-
Page 131: Chapter 9 Maintenance
Maintenance Chapter 9 This chapter describes basic cleaning and battery replacement procedures for your diagnostic tool. 9.1 Cleaning and Inspecting the Diagnostic Tool Periodically perform the following tasks to keep your diagnostic tool in proper working order: • Check the housing, cables and connectors for dirt and damage before and after each use. •... -
Page 132: Battery Pack Safety Guidelines
Maintenance Battery Pack Service 9.2.1 Battery Pack Safety Guidelines IMPORTANT: The battery pack contains no user serviceable components. Tampering with the battery pack terminals or housing will void the product warranty. Keep the following in mind when using and handling the battery pack: •... -
Page 133: Replacing The Battery Pack
If the battery pack no longer holds a charge, contact your sales representative to order a new battery. IMPORTANT: Replace the battery pack with original Snap-on replacement parts only. To remove the battery pack: 1. Loosen the two battery cover screws on the back-side of the diagnostic tool. -
Page 134: Disposing Of The Battery Pack
Maintenance Battery Pack Service 9.2.3 Disposing of the Battery Pack Always dispose of the battery pack according to local regulations, which vary for different countries and regions. The battery pack, while non-hazardous waste, does contain recyclable materials. If shipping is required, ship the battery pack to a recycling facility in accordance with local, national, and international regulations.
Need help?
Do you have a question about the MODIS Edge and is the answer not in the manual?
Questions and answers
2018 ldv injector coding function