Table of Contents
Advertisement
Quick Links
User Manual
Scanner
Scanner
Vehicle
Vehicle
History
History
History
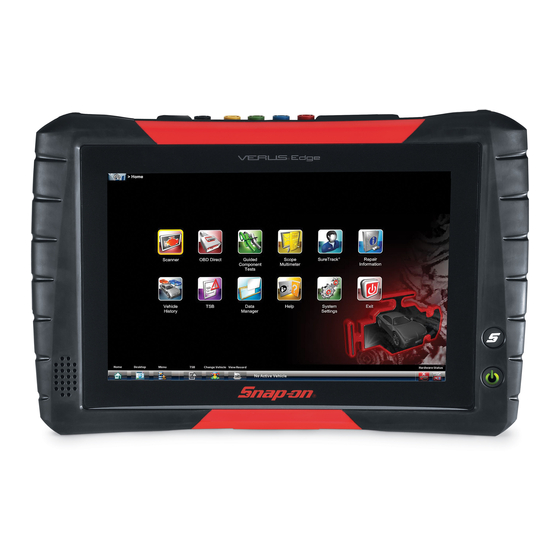
Home
Home
Desktop
Desktop
Menu
Menu
ZEEMS330A Rev. E
®
OBD Direct
OBD Direct
Guided
Guided
Scope
Scope
SureTrack™
SureTrack™
Component
Component
Component
Multimeter
Multimeter
Multimeter
Tests
Tests
Quick
Quick
Data
Data
Help
Help
System
System
Lookups
Lookups
L
k
Manager
Manager
Manager
Settings
Settings
Settings
TSB
TSB
Change Vehicle
Change Vehicle
View Record
View Record
Repair
Repair
Information
Information
Information
Exit
Exit
Hardware Status
Hardware Status
Advertisement
Table of Contents

Related Manuals for Snap-On VERUS edge


Summary of Contents for Snap-On VERUS edge
-
Page 1: User Manual
User Manual ® Scanner Scanner OBD Direct OBD Direct Guided Guided Scope Scope SureTrack™ SureTrack™ Repair Repair Component Component Component Multimeter Multimeter Multimeter Information Information Information Tests Tests Vehicle Vehicle Quick Quick Data Data Help Help System System Exit Exit History History History... - Page 2 Trademarks Snap-on, ShopStream Connect, SureTrack, Fast-Track Troubleshooter, ProDemand, ShopKey Pro and VERUS are trademarks registered in the United States and other countries of Snap-on Incorporated. All other marks are trademarks or registered trademarks of their respective holders. The Bluetooth word mark and logos are registered trademarks owned by Bluetooth SIG, Inc. and any use of such marks by Snap-on Incorporated is under license.
- Page 3 FCC Compliance Statement This equipment has been tested and found to comply with the limits for a Class B digital device, pursuant to part 15 of the FCC rules. These limits are designed to provide reasonable protection against harmful interference in a residential installation.
-
Page 4: Important Information
***IMPORTANT INFORMATION*** Operating System (OS) ® Your VERUS Edge delivers exclusive coverage, more capabilities, superior performance and runs on a special ® ® version of the Microsoft Windows 7 operating system. DO NOT install another operating system on this diagnostic tool. The modification or installation of a different OS or OS version will damage the diagnostic tool and void its warranty. -
Page 5: Safety Information
Safety Information READ ALL INSTRUCTIONS For your own safety, the safety of others, and to prevent damage to the product and vehicles upon which it is used, it is important that all instructions and safety messages in this manual and the accompanying Important Safety Instructions manual be read and understood by all persons operating, or coming into contact with the product, before operating. -
Page 6: Important Safety Instructions
Safety Information Safety Signal Words Safety Signal Words All safety messages contain a safety signal word that indicates the level of the hazard. An icon, when present, gives a graphical description of the hazard. Safety Signal words are: Indicates an imminently hazardous situation which, if not avoided, will result in death or serious injury to the operator or to bystanders. -
Page 7: Table Of Contents
Contents Chapter 1: Using This Manual ....................1 Conventions..........................1 Bold Text ..........................1 Symbols ..........................1 Terminology ........................... 1 Notes and Important Messages ..................... 2 Procedures..........................2 Hyperlinks ..........................2 Tool Help..........................2 Chapter 2: Introduction......................3 Features and Specifications ......................3 Diagnostic Tool ........................ - Page 8 Contents Menu Options........................36 Scanner Operation ........................39 Connecting the Scan Module ....................39 Vehicle Identification ......................39 Vehicle System Selection ....................41 Vehicle Test Selection ......................46 Stopping Communication and Exiting the Scanner ..............57 Chapter 5: Scan Module Operation ..................58 Overview.............................
- Page 9 Contents Operations ..........................105 Starting the Scope and Multimeter..................105 Measurement Out of Range....................107 Scope and Multimeter Setup....................107 Chapter 9: Repair Information....................121 About ShopKey Pro ........................121 Chapter 10: Quick Lookups....................123 Oil Specs and Resets ....................... 123 Operation..........................
- Page 10 Contents Chapter 13: Help Operations ....................167 Using the Help Toolbar......................167 Chapter 14: System Settings Operations................168 Paired Devices ......................... 168 Checking Paired Devices ....................168 Scan Module Pairing ......................168 M4 Scope Module Pairing ....................168 Paring the M2 Scope/Meter (Optional Equipment) ............169 M2 Scope/Meter Hardware Status Indicators ..............
-
Page 11: Chapter 1 Using This Manual
Using This Manual Chapter 1 This manual contains basic operating instructions and is structured in a manner to help you become familiar with your Diagnostic Tool features and perform basic operations. The illustrations in this manual are intended as reference only and may not depict actual screen results, information, functions or standard equipment. -
Page 12: Notes And Important Messages
Using This Manual Conventions 1.1.4 Notes and Important Messages The following messages are used. Note A note provides helpful information such as additional explanations, tips, and comments. Example: NOTE: For additional information refer to... Important Important indicates a situation which, if not avoided, may result in damage to the test equipment or vehicle. -
Page 13: Chapter 2 Introduction
Introduction Chapter 2 This chapter introduces the basic features of the Diagnostic Tool, including the control buttons, data ports, battery pack, and power sources. Your Diagnostic Tool is a specialized personal automotive diagnostic solution that combines information with test instrumentation to help you diagnose symptoms, codes, and complaints quickly and efficiently. - Page 14 Introduction Features and Specifications 1— Stylus Storage 2— Scope Module M4 (removable) 3— Camera Lens 4— Communication and Power Jacks Cover 5— Head Phone Jack 6— Micro uSD Card Slot 7— USB (universal serial bus) Jacks (2) 8— DC Power Supply Input Jack 9—...
- Page 15 Introduction Features and Specifications Technical Specifications Item Description / Specification Touch Screen Capacitive Touch Panel 10.1 inch diagonal, TFT Color LCD Display 1280 x 800 resolution (WXGA) Processor Intel Quad Core N2930, 1.8GHz ® ® Operating System Microsoft Windows Embedded 7 Wi-Fi standard (802.11 b/g/n) Communications ®...
- Page 16 Introduction Features and Specifications Built-in Stand The built-in stand extends from the back of the Diagnostic Tool to allow hands-free viewing. The stand clips into the Diagnostic Tool for storage and pivots out so the display is at a 45 degree angle when in use.
-
Page 17: Scope Module
Introduction Features and Specifications 2.1.2 Scope Module 1— Auxiliary (DB9) Connector 2— Channel 4 Jack 3— Channel 3 Jack 4— Channel 2 Jack 5— Channel 1 Jack 6— Common (Ground) Jack 7— USB Jack (not shown - used for remote operation) Figure 2-3 Scope Module, removed from Diagnostic Tool... -
Page 18: Remote Operation
Introduction Features and Specifications Remote Operation If needed, the Scope Module (M4) can be removed from the Diagnostic Tool, then connected to the Diagnostic Tool with a USB cable. This increases the range of mobility for the Diagnostic Tool while monitoring signals on the test vehicle. Use the Type A/B USB cable, which is provided with your kit, to make the connection. -
Page 19: Scan Module (Wireless)
Introduction Features and Specifications 2.1.3 Scan Module (Wireless) 1— Data Cable Connector 2— Vehicle Power LED (green) 3— Communication Issue LED (red) 4— Bluetooth LED (green) 5— Memory Card Port (remove protective hand grip for access) 6— Universal Serial Bus (USB) Jack (remove protective hand grip for access) Figure 2-4 Scan Module... - Page 20 Introduction Features and Specifications Wireless Communication The Scan Module is a wireless communications device that transmits vehicle data to the Diagnostic Tool without a physical connection. A signal lost due to moving out of range automatically restores itself when the Diagnostic Tool is brought closer to the Scan Module. The Scanner sounds a tone when the signal is lost.
-
Page 21: Chapter 3: Basic Operation And Navigation
Basic Operation and Chapter 3 Navigation This chapter describes the basic operation, and navigation of the Diagnostic Tool. 3.1 Turning On/Off, Sleep Mode and Emergency Shutdown The following sections describe how to turn the Diagnostic Tool on and off, use Sleep Mode and perform an emergency shutdown. -
Page 22: Sleep Mode
Basic Operation and Navigation Turning On/Off, Sleep Mode and Emergency Shutdown 3.1.3 Sleep Mode The Windows operating system uses Sleep Mode to conserve power by stopping all processes and turning off the display screen, while keeping the diagnostic tool on and your open applications active. -
Page 23: Shortcut (S) Button
Basic Operation and Navigation Shortcut (S) Button 3.2 Shortcut (S) Button The shortcut (S) button (Figure 3-1) located on the front of the diagnostic tool, and is a customizable button that can be set to perform various routine functions. Figure 3-1 NOTE: You can open the Shortcut menu at anytime by pressing and holding the Shortcut (S) button for 3 seconds. -
Page 24: Configure Shortcut (S) Button
3.2.2 Advanced (menu selection) The Advanced selection has no functionality under normal operating conditions, and should ONLY be selected when directed to do so, by Snap-on customer service. Selecting Advanced displays the advanced diagnostic system information screen. The system state information and functions are ONLY used during system troubleshooting, when requested by... -
Page 25: Led Indicator
Basic Operation and Navigation LED Indicator 3.3 LED Indicator The power button is backlit by an light emitting diode (LED) (see Figure 2-1 on page 3 location). The LED is used to indicate battery/power status and sleep mode activation. Table 3-3 Name Button Power Button / LED Indicator... - Page 26 Basic Operation and Navigation Basic Navigation Touch Screen Gestures This device uses common touch screen gesture motions (e.g. pinch-to-zoom, press and tap, pan and swipe). The terms used to describe the various gestures may vary (industry wide), however the general procedures and usage are similar for specific operations. Table 3-4 Common Gesture General Procedure...
-
Page 27: Starting The Shopstream Diagnostic Suite Program
Basic Operation and Navigation Basic Navigation 3.4.2 Starting the ShopStream Diagnostic Suite Program The ShopStream Diagnostic Suite program is the main program which is used for all diagnostic functions. The ShopStream Diagnostic Suite program is automatically started when the Diagnostic Tool is turned on through the Windows “start up” folder function. After the program has started, the ShopStream Diagnostic Suite Home Screen displays, see Home Screen Layout page 17. -
Page 28: Function Icons
Basic Operation and Navigation Basic Navigation 3.4.4 Function Icons The Function Icons configure the Diagnostic Tool for the type of test to be performed. Table 3-5 page 18 gives brief descriptions of the available icons, which operations are available depends upon the individual configuration of your system. -
Page 29: Toolbar
Basic Operation and Navigation Basic Navigation Table 3-5 (table 2 of 2) Name Icon Description Opens the on-line help for the system. See Help Help Operations on page 167. Establishes and manages connections to peripheral devices, such as the Scan System Settings Module. - Page 30 Basic Operation and Navigation Basic Navigation Menu Options The Menu icon on the Toolbar at the base of the display screen opens a list of basic operations and features. The list of options varies depending upon which module, or tool function, is active. Selecting a menu item opens a submenu of choices, and some submenus also open an additional ...
-
Page 31: Windows Taskbar
Basic Operation and Navigation Virtual Keyboard 3.4.6 Windows Taskbar The standard Windows taskbar displays program icons that are currently running or that you have pinned to the taskbar for quick access. Refer to Microsoft Windows 7 user documentation for additional information. Windows Taskbar Notification Area The notification area contains icons that provide active status and notifications of selected programs. - Page 32 Basic Operation and Navigation Virtual Keyboard Figure 3-6 Tools menu To learn more about the virtual keyboard, select Help Topics from the Tools menu to open the Windows Touch Keyboard help and support (Figure 3-7). Figure 3-7 Help window...
-
Page 33: Camera Operation
Basic Operation and Navigation Camera Operation 3.6 Camera Operation 3.6.1 Operating the Camera Selecting Camera from the shortcut (S) button menu opens the camera application. The touch screen becomes the view finder and is also used for reviewing photographs that are taken. Icons on the touch screen are used to operate the camera. -
Page 34: Viewing Pictures
Basic Operation and Navigation Wi-Fi Setup Taking pictures: 1. Press the Shortcut (S) Button and choose Camera from the menu. 2. Focus the image to be captured in the view finder. 3. Press the Photo icon. The view finder now shows the captured picture. 4. -
Page 35: Chapter 4 Scanner Function
Scanner Function Chapter 4 The Scanner function allows your Diagnostic Tool to communicate with the electronic control modules (ECMs) of the vehicle being serviced. This allows you to perform tests, view diagnostic trouble codes (DTCs), and view live data parameters from various vehicle systems such as the engine, transmission, antilock brake system (ABS) and more. -
Page 36: Basic Operation And Navigation
Scanner Function Basic Operation and Navigation 2. Select Demonstration. A menu of demonstration choices displays: US Domestic—contains actual data captured while driving a Chevrolet Tahoe. Look for – the throttle position (TP) sensor dropout while analyzing the data in Graphing mode. OBD Training Mode—provides simulated data for an OBD-II/EOBD vehicle that allows –... -
Page 37: Scanner Screen Layout
Scanner Function Basic Operation and Navigation 4.2.3 Scanner Screen Layout The Scanner screens typically include three sections (Figure 4-2): 1— Scanner Toolbar 2— Main Body 3— Lower Toolbar Figure 4-2 Scanner screen layout Scanner Toolbar The Scanner toolbar contains a number of icons that allow you to configure the displayed data and to exit. - Page 38 Scanner Function Basic Operation and Navigation Table 4-1 Scanner toolbar icons (sheet 2 of 2) Name Icon Description Saves a copy of the current frame of Save data that can be viewed using Data Manager. Opens a standard Windows Print Print dialog box for saving a print copy of the current frame of data.
- Page 39 Scanner Function Basic Operation and Navigation Figure 4-3 Sample custom configuration screen Keep the following in mind when configuring a custom data list: Gesture scroll if the list of parameters is longer than what is shown on the screen. – Use the Select All icon to display the complete list.
- Page 40 Scanner Function Basic Operation and Navigation Alarm indicators now appear next to the selected parameters in the Data List (Figure 4-4). Figure 4-4 Sample alarm indicators NOTE: Alarms can only be set for certain parameters. If the Alarm List dialog box is empty, no parameters are available and alarms cannot be set.
- Page 41 Scanner Function Basic Operation and Navigation Selecting either color option, Edit Plot Color or Edit Background Color opens a standard color selection dialog box. Select a color, then select OK to close the dialog box. The Show Grid icon is used to switch a background grid pattern on the data graphs on and off: To switch the grid on;...
- Page 42 Scanner Function Basic Operation and Navigation Save The Save icon is used to record movies of vehicle datastream values. Saved files can be helpful when trying to isolate an intermittent problem or to verify a repair during a road test. To save a movie: Select Save.
- Page 43 Scanner Function Basic Operation and Navigation If the Diagnostic Tool is connected to a printer, the current frame of data is printed. If the Diagnostic Tool is not connected to a printer, the frame of data is saved as an “XPS” file. A dialog box opens so that you can name the print file and specify the location that it is saved to, follow the on-screen instructions.
- Page 44 Scanner Function Basic Operation and Navigation Sweep The Sweep option switches the sweep values, displayed below the data graphs, on and off (Figure 4-10). The dropdown menu closes once a selection is made. Figure 4-10 Sample data graph sweep Main Body The main body of the screen varies depending on the stage of operation.
- Page 45 Scanner Function Basic Operation and Navigation Lower Toolbar Whenever communication is established with a vehicle, the Scanner continuously records data transmitted by the ECM in the data buffer. The toolbar below the main body of the screen contains the icons for navigating the buffered data and other options (Table 4-2).
-
Page 46: Menu Options
Scanner Function Basic Operation and Navigation 4.2.4 Menu Options The Toolbar Menu icon at the base of the screen opens a menu near the top of the display. Figure 4-12 Sample Scanner Menu icon options The following Menu options are available: Safety Information—opens the Important Safety Instructions document. - Page 47 Scanner Function Basic Operation and Navigation Units Setup The units of measurement can be changed for temperature, vehicle speed, air pressure and other pressure readings. Choose between US customary or metric units of measure. To change the units setup: 1. Select Tools > Units Setup. The Measurement Units Setup dialog box opens.
- Page 48 Scanner Function Basic Operation and Navigation User’s Manuals This option opens a menu of additional support documentation, such as vehicle communication software manuals, available to assist in your diagnosis. These manuals provide connection information, detailed test procedures, and other resource material for specific vehicles. Figure 4-14 Sample User’s Manuals menu Select Exit to close the Help module and return to the Scanner.
-
Page 49: Scanner Operation
Scanner Function Scanner Operation 4.3 Scanner Operation The Scanner function communicates with vehicle control modules, to provide you with DTCs, parameter data (PIDs), applicable functional tests, and troubleshooting information: Basic Scanner Operation Steps NOTE: Menus, options and procedures may vary by vehicle. The following instructions apply to most OBD-II vehicles. - Page 50 Scanner Function Scanner Operation NOTE: Menus options and procedures may vary by vehicle. Instant ID Instant vehicle identification is a built-in (default) Scanner feature that will save you time when identifying a vehicle, by automatically communicating with the vehicle to complete the vehicle identification process.
-
Page 51: Vehicle System Selection
Scanner Function Scanner Operation NOTE: You can limit the number of manufacturers that appear on the list by selecting Configure Favorites from the toolbar. See Creating a Favorites List on page 83 for details. 3. Select the vehicle year. A list of vehicle types or models displays. Several selections may be required to identify the vehicle type and model, follow the screen prompts and enter the required information. - Page 52 Scanner Function Scanner Operation Code Scan NOTE: Depending on the vehicle, the Code Scan option may be available from the systems menu. Selecting Code Scan starts an active scan of vehicle control modules, and opens the Code Scan results screen (Figure 4-17).
- Page 53 Scanner Function Scanner Operation A list of all the systems analyzed with DTCs totals. A categorized system list with DTC • totals is displayed in the order they are scanned. To view the main menu for a system in the list, select the system title (Figure 4-18).
- Page 54 Scanner Function Scanner Operation ® SureTrack Common Replaced Parts and repair information for DTCs. Selecting a DTC • from a list allows you to view available SureTrack information for the DTC. Select the Common Replaced Parts graph or the Fix It! icon to view the information (Figure 4-20).
- Page 55 Scanner Function Scanner Operation Readiness Monitor Test Status. At the end of the Code Scan Report, readiness monitor test • results are displayed as “Tests Complete” or “Not Complete” (Figure 4-22). Figure 4-22 Quick reference indicators are used to show monitor status. - Green icon “a”...
-
Page 56: Vehicle Test Selection
Scanner Function Scanner Operation 4.3.4 Vehicle Test Selection Selecting a vehicle test: 1. After a system is selected and the Scanner establishes communication with the vehicle, the Scanner Main menu displays available tests. Select a menu item to continue. Figure 4-23 Scanner Main menu Main menu options vary slightly by year, make, and model. - Page 57 Scanner Function Scanner Operation Codes Menu This selection may appear as Codes, Codes Menu, Codes Only, Codes (No Data), or something similar on the menu. Selecting opens a list of data parameter viewing options that may include: Display Codes Selecting opens either a list of diagnostic trouble codes (DTCs) stored in the selected electronic control module (ECM), or a submenu of DTC viewing options.
- Page 58 Scanner Function Scanner Operation Clear Codes The Scanner clears trouble codes from the ECM memory on some vehicles. If this function is not available on the test vehicle, Clear Codes does not appear as a menu option. To clear codes: 1.
- Page 59 Scanner Function Scanner Operation The DTC status report displays (Figure 4-26). Figure 4-26 Sample DTC status report 5. Select Exit to return to the DTC status entry screen. 6. Select Exit again to return to the Codes menu. Data Display Depending upon the test vehicle, this selection may appear as Data, Data Display, Data Only, Data (No Codes), or something similar.
- Page 60 Scanner Function Scanner Operation 1— Graph icon 2— Parameter name 3— Parameter value Figure 4-27 Sample data screen Data Graphs Select the Graph icon to open a data graph for that parameter (Figure 4-28). Selecting a parameter for graph view moves it to the top of the list. Select the Graph icon again to close the graph for that parameter and return to a data list view.
- Page 61 Scanner Function Scanner Operation The icons that display on each data graph allow you configure settings for the selected graph only: Table 4-3 Data graph icon operations Name Icon Description Select to expand the graph to fill the entire screen, Expand/Collapse select again to collapse the graph to the standard view.
- Page 62 Scanner Function Scanner Operation The area between the upper and lower trigger lines establishes the triggering condition. Any data points that register outside of the set trigger conditions initiates a snapshot. Figure 4-29 Sample Graph Properties dialog box 7. Select Snapshot on the Data Buffer Toolbar to arm the snapshot. The Snapshot icon changes color to indicate it has been armed (Figure 4-30).
- Page 63 Scanner Function Scanner Operation 8. Select OK to close the confirmation screen. 9. Select the Play icon on the toolbar to resume viewing live data. NOTE: Selecting an armed Snapshot icon disarms it. Scale Scale adjusts the upper and lower values displayed on the vertical axis of a data graph. Two scale modes are available;...
- Page 64 Scanner Function Scanner Operation Functional Tests The Functional Tests selection is used to access vehicle-specific subsystem and guided component tests. Available tests vary by manufacturer, year, and model, and only the available tests display in the menu. There are four general types of functional test operations: Information Tests—are read-only tests, like selecting “VIN”...
- Page 65 Scanner Function Scanner Operation Functional test controls allow you manipulate the test signal as shown in Table 4-4. Table 4-4 Functional test control icons Name Icon Description Test Activates the test. Return Moves focus back to the data list. Change List Allows you to switch data lists.
- Page 66 Scanner Function Scanner Operation Troubleshooter information is organized into a series of diagnostic tips that are designed to quickly lead you to the root cause of a particular problem. The tips are vehicle-specific, which means only tips that relate to the identified vehicle are presented. Selecting opens a menu that may include: Code Tips—provides detailed information on setting conditions, testing, and interpreting test •...
-
Page 67: Stopping Communication And Exiting The Scanner
Scanner Function Stopping Communication and Exiting the Scanner 4.4 Stopping Communication and Exiting the Scanner The Scanner remains open as long as there is an active communication link with the vehicle. You must first stop communication with the vehicle in order to exit from the Scanner function. A warning message displays if you attempt to exit from the Scanner while it is communicating with the vehicle ECM. -
Page 68: Chapter 5 Scan Module Operation
Scan Module Operation Chapter 5 This chapter describes the connection, operation, troubleshooting and updating of the Scan Module. 5.1 Overview The Scan Module is a wireless device that is connected to the vehicle and transmits vehicle data to the diagnostic tool. The Scan Module operates on 12 or 24VDC vehicle power, supplied through the vehicle’s data link connector (DLC). -
Page 69: Pairing The Scan Module
Scan Module Operation Pairing The Scan Module 5.2 Pairing The Scan Module To use the Scan Module with the Scanner or OBD-II/EOBD functions, it must first be paired with the diagnostic tool. Pairing is the wireless connection (identification) process used to connect the Scan Module to your diagnostic tool. - Page 70 Scan Module Operation Pairing The Scan Module NOTE: Search results include all compatible wireless devices detected, and may include multiple Scan Modules if you are in a shop environment where more than one unit is powered on. Available module listings include a partial serial number. Make sure the screen listing matches the last six digits of the serial number of your Scan Module before continuing.
-
Page 71: Checking Scan Module Paired Status
Scan Module Operation Checking Scan Module Paired Status 5.3 Checking Scan Module Paired Status To check if the Scan Module is paired to your diagnostic tool: 1. Select System Settings > Paired Devices. The paired devices screen opens (Figure 5-4). The Paired Devices screen lists all of the devices paired to the diagnostic tool, and also indicates whether or not there is active communication occurring. -
Page 72: Troubleshooting
Scan Module Operation Troubleshooting Figure 5-5 Vehicle connection data cable message For data cable vehicle power connection information, see Vehicle Power on page 6. To connect the data cable to the vehicle: 1. While using the Scanner or OBD-II/EOBD function, follow the on-screen instructions for connecting the cable and/or any adapters required to the vehicle (Figure 5-5). -
Page 73: No Communication Message
Scan Module Operation Troubleshooting 5.5.1 No Communication Message If the Scan Module is paired to the diagnostic tool and tries to communicate with the vehicle and the Scan Module is not connected to the vehicle, a “Connect Data Cable” or “no communication” message displays. -
Page 74: Checking Scan Module Hardware Status
Scan Module Operation Troubleshooting 5.5.3 Checking Scan Module Hardware Status Verifying the Hardware Status is always the first step in troubleshooting a wireless connection issue. The Hardware Status indicators in the lower-right corner of the Home screen provide a quick reference to wireless operations. - Page 75 Scan Module Operation Troubleshooting 1— Vehicle Power—green LED, flashes during wireless communications 2— Communication—red LED, illuminates if there is a communications failure 3— Bluetooth—green LED, flashes during wireless communications Figure 5-6 Scan Module LEDs Each LED can be in one of three states; off, lit solid, or flashing. Interpret as follows: Vehicle Power •...
-
Page 76: Recovery Procedure
Scan Module Operation Troubleshooting 5.5.4 Recovery Procedure This is a quick and easy method that reestablishes connectivity between the diagnostic tool and the Scan Module in most instances. If bluetooth connectivity remains unavailable following recovery, use one of the alternate procedures to restart the system. NOTE: This product is intended to be used by professional technicians in a garage environment. - Page 77 Scan Module Operation Troubleshooting Figure 5-8 Scan Module USB jack, handgrip removed 3. Plug the small end of the USB cable into the USB jack on the Scan Module. 4. Plug the large end of the USB cable into a USB jack on the diagnostic tool. Scanner functionality should be restored immediately once the USB connection is complete.
-
Page 78: Updating Scan Module Firmware
Scan Module Operation Updating Scan Module Firmware 5.6 Updating Scan Module Firmware The internal programming (firmware) of the Scan Module, may require periodic updates. These firmware updates (when available) are delivered with diagnostic software updates/upgrades. Firmware updates increase the Scan Module’s diagnostic capabilities, typically by adding support for new tests, vehicles and enhanced applications to the vehicle databases. - Page 79 Scan Module Operation Updating Scan Module Firmware Figure 5-10 Sample update in progress screen A “successfully updated” message displays once the installation process is complete (Figure 5-11). Figure 5-11 Sample firmware update complete message 2. Select OK to close the message and return to Scanner operations. The updated Scan Module, is ready to use.
- Page 80 Scan Module Operation Updating Scan Module Firmware IMPORTANT: The Scan Module data cable must be disconnected from the vehicle during the update process. a. From the bottom of the Scan Module, gently lift up and out on the sides of the handgrip to free it from housing (Figure 5-12).
- Page 81 Scan Module Operation Updating Scan Module Firmware A “successfully updated” message displays once the installation process is complete (Figure 5-14). Figure 5-14 Firmware update complete message 6. Select OK to close the message and return to the Scanner function. The updated Scan Module, is ready to use.
-
Page 82: Chapter 6 Obd Direct Operations
OBD Direct Operations Chapter 6 This Home screen option allows you to access Generic OBD-II/EOBD Scanner tests without completing a vehicle identification. OBD Direct presents a quick way to check for diagnostic trouble codes (DTCs), isolate the cause of an illuminated malfunction indicator lamp (MIL), check monitor status prior to emissions certification testing, verify repairs, and perform a number of other services that are emissions-related. -
Page 83: Obd Health Check
OBD Direct Operations OBD Health Check 6.1 OBD Health Check The OBD Health Check offers a way to quickly check for and clear generic diagnostic trouble codes (DTCs) and to check readiness monitors. Selecting OBD Health Check opens a submenu of options (Figure 6-2). -
Page 84: Global Obd Ii Clear Codes
OBD Direct Operations OBD Health Check Pending Codes The purpose of this service is to enable the scan tool to obtain “pending” or maturing diagnostic trouble codes. These are codes whose setting conditions were met during the last drive cycle, but need to be met on two or more consecutive drive cycles before the DTC actually sets. -
Page 85: Mil Status
OBD Direct Operations OBD Diagnose 6.1.4 MIL Status This item is used to check the current condition of the malfunction indicator lamp (MIL). Additional information, such as which ECM commanded the MIL on and the distance driven while the MIL is on (if supported), can also be displayed. - Page 86 OBD Direct Operations OBD Diagnose 2. Select Continue. A communications message that shows how many ECMs were detected, which ECM is communicating, and which communication protocol is being used displays (Figure 6-5). Figure 6-5 Sample communication message 3. Select Continue and a menu of available tests displays (Figure 6-6).
- Page 87 OBD Direct Operations OBD Diagnose Readiness Monitors Use this menu item to check the status of the monitored system. If a monitored system is not supported, it is not displayed. Scroll, if needed, to view the entire list of monitors. Selecting Readiness Monitors opens a submenu with two choices: Monitors Complete Since DTC Cleared—displays the results of all monitor tests that have •...
- Page 88 OBD Direct Operations OBD Diagnose ($04) Clear Emissions Related Data This item is used to clear all emission related diagnostic data such as, DTCs, freeze frame data, and test results from the memory of the selected ECM. ($05, 06, 07) Display Test param./Results This option opens a submenu of test parameters and test results from various sensors, monitor test results, and a record of DTCs detected during the last drive cycle.
-
Page 89: Connector Information
OBD Direct Operations OBD Diagnose 6.2.2 Connector Information This option opens a database of vehicle diagnostic connector locations that includes most makes and models. To locate a vehicle diagnostic connector: 1. Select Connector Information from the System menu. 2. Select a manufacturer from the list presented. 3. -
Page 90: Chapter 7 Guided Component Test Operations
Guided Component Test Chapter 7 Operations The Guided Component Test software is a component-testing powerhouse, providing you with a robust diagnostic database for use with scopes and meters. It is like having access to a complete library of shop manuals for testing engine-management components, transmission sensors and components, and ABS systems. -
Page 91: Menu Options, Guided Component Test
Features Benefits • How To • Power User Tests • Snap-on Automotive Theory • Features Benefits Selecting Features Benefits opens a menu page that includes: 5-Minute Walk Thru With Demo Board—explains how to use the optional demonstration • board to generate sample signals. - Page 92 Theory And Operation—provides basic theory and operation information for related • components. Snap-on Automotive Theory Selecting the Snap-on Automotive Theory option provides you basic operation, theory and testing information on various systems such as: Air Conditioning • Diesel Particulate Filters •...
-
Page 93: Creating A Favorites List
Guided Component Test Operations Vehicle Identification 7.1.2 Creating a Favorites List Once a Guided Component Test database is loaded, a list of manufacturers displays. This list is often long and includes makes that are not frequently used. A toolbar at the top of the screen allows you to custom configure the manufacturer list to display only the makes you frequently service. -
Page 94: Identifying A Test Vehicle
Guided Component Test Operations Vehicle Identification NOTE: Manufacturers appear on the favorites list in the order in which they are selected. Therefore, if you select the makes you work on most frequently first, they will appear at the top of the list. 3. - Page 95 Guided Component Test Operations Vehicle Identification A list of tests available for the identified vehicle displays (Figure 7-4). Figure 7-4 Sample available tests list 8. Select FUEL INJECTION and a fuel injection component test menu displays (Figure 7-5). Figure 7-5 Sample available component tests list 9.
-
Page 96: Operations
Guided Component Test Operations Operations 7.2 Operations The Guided Component Test software provides vehicle specific Guided Component Test procedures and information that aid in setting up scopes and meters. Once a test vehicle is identified, you can select a Guided Component Test from the list of available tests. For most selections two main choices are available on the component menu: 1. -
Page 97: Tests
Guided Component Test Operations Operations NOTE: An additional selection, such as front or rear for an oxygen sensor (O2S), may be required before advancing to the component information screen. The component information screen displays (Figure 7-6). Always Gesture sweep to view any additional information below what is visible. 4. - Page 98 Guided Component Test Operations Operations 3. Select a test option and the test screen displays (Figure 7-8). Figure 7-8 Sample Test screen 4. Gesture sweep to view any additional information. 5. Select Back at any time to return to the previous screen, or select Exit to return to the main component menu.
- Page 99 Guided Component Test Operations Operations View Meter A Meter icon, which is only available in the Guided Component Test view meter mode, appears on the upper toolbar (Figure 7-9). Figure 7-9 Sample view meter window Three view meter options are available: 1.
- Page 100 Guided Component Test Operations Operations Selecting the Close icon (red box with an X) when viewing the meter in a separate window closes the meter and returns you to the Guided Component Test screen. 3. Select the Meter icon a third time to close the separate window and return to the standard meter view as shown in Figure 7-9.
-
Page 101: Chapter 8 Scope And Multimeter Operations
Scope and Multimeter Chapter 8 Operations The Scope Multimeter function provides all the tools needed for performing electrical and electronic circuit tests and for monitoring signals and circuit activity. The Scope Module easily separates from the Diagnostic Tool and connects with a USB cable so that test results can be remotely monitored as you perform other tasks. - Page 102 Scope and Multimeter Operations Using the Scope Module Remotely NOTE: If the Scope Module: ○ Is undocked from the Diagnostic Tool when it is on, or ○ Is exposed to a electro static discharge (ESD) while it is being used remotely the following will occur: •...
-
Page 103: M4 Scope Module Pairing
Scope and Multimeter Operations M4 Scope Module Pairing 8.2 M4 Scope Module Pairing When the M4 Scope Module is connected either by USB cable or in it’s docking station on the rear of the diagnostic tool, it automatically pairs with the diagnostic tool using the USB connection. To check the paired status of the M4 Scope Module: 1. -
Page 104: Getting Started
Scope and Multimeter Operations Getting Started 8.3 Getting Started The Scope and Multimeter module enables the following functions: Lab Scope • Ignition Scope • Graphing Multimeter • Digital Multimeter • 8.3.1 Capabilities The following tables detail the software and hardware capabilities. Table 8-1 Scope Function Range... -
Page 105: Leads, Probes And Adapters
Scope and Multimeter Operations Getting Started Table 8-2 Graphing Multimeter (part 2 of 2) Function Range Accuracy/Comments Ohms 40 Ohm–4 MOhm Fixed scales Connect Low amp Probe (+) to Ch. 1 20A scale (100mV/Amp) (yellow banana jack) and (–) to GND input Low Amp Probe 40A scale (10mV/Amp) (black banana jack). - Page 106 Scope and Multimeter Operations Getting Started Channel 1 Lead Figure 8-4 Yellow Channel 1 Lead The shielded yellow lead is used for Channel 1 (Figure 8-4) and other channel connections that need additional grounding. The lead color matches the color of socket 1 on the Scope Module and the color of trace 1 on the test screens.
- Page 107 Scope and Multimeter Operations Getting Started The non-shielded red lead (Figure 8-7) is used for either Channel 4 or Digital Meter plus (+). The lead color matches the color of socket 4 on the Scope Module, as well as the color of trace 4 on the test screen.
-
Page 108: Menu Options, Scope Multimeter
Scope and Multimeter Operations Getting Started The optional Secondary Ignition Clip-on Wire Adapter (Figure 8-11) connects the Secondary Coil Adapter lead to a secondary ignition lead on the vehicle to display ignition patterns. Inductive RPM Pickup Adapter (optional) Figure 8-12 Inductive RPM Pickup adapter The optional Inductive RPM Pickup adapter (Figure 8-12) connects to the scope auxiliary... - Page 109 Scope and Multimeter Operations Getting Started Save Single Frame—saves a recording of the current screen. – Save All Frames—saves a recording of the current screen plus all the data in the buffer. – Print—opens a standard Windows Print dialog box for printing the current screen. •...
-
Page 110: Navigation
Scope and Multimeter Operations Navigation 8.4 Navigation The following section describes how to navigate the screen interface. 8.4.1 Screen Layout The screens typically include the following sections (Figure 8-14): Scope Multimeter Toolbar—allows you to configure the tool for the type of test and to adjust •... - Page 111 Scope and Multimeter Operations Navigation Scope Multimeter Toolbar The Scope Multimeter toolbar is used to set up the tool for testing and to configure the settings for each trace. Table 8-4 on page 101 gives brief descriptions of the control icons on the toolbar: Table 8-4 Scope Multimeter toolbar icons Name Icon...
- Page 112 Scope and Multimeter Operations Navigation Trace Details The Trace Details section displayed at the base of the screen can be used to quickly adjust settings for capturing the trace. The Trace details are accessed using either the Data icon on the upper toolbar or the Touch and Grow icon on the Playback toolbar.
- Page 113 Scope and Multimeter Operations Navigation The following trace adjustments and settings are available: Profile—switches the trace for the selected channel on and off. • Channel—opens a dialog box that allows you to configure the trace setup (see Trace Controls • on page 107 for details).
-
Page 114: Making Selections
Scope and Multimeter Operations Navigation Table 8-5 Data buffer toolbar icons (part 2 of 2) Name Icon Description Stop Stops recording data Record Begins recording data Plays the data recording in a continuous loop at Play Recording actual speed Forward 1 Frame Moves to the next frame in the recorded data Step Forward Moves to the next point in the recorded data... -
Page 115: Operations
Scope and Multimeter Operations Operations 8.5 Operations This section describes configuring the scope or meter and performing tests. 8.5.1 Starting the Scope and Multimeter Use the following procedure to set up the scope multimeter for performing tests. To start the scope multimeter: 1. - Page 116 Scope and Multimeter Operations Operations Ignition Scope Options The following options are available for testing: Parade • Cylinder • Raster • Superimposed • Single Cylinder Ignition • Graphing Options The following options are available for testing: 4 Channel Graphing • Volts DC •...
-
Page 117: Measurement Out Of Range
Scope and Multimeter Operations Operations 8.5.2 Measurement Out of Range A group of arrows display when a measurement is out of range for the scale selected: Arrows pointing UP—measurement over maximum range • Arrows pointing DOWN—measurement under minimum range • Voltage measurements also display arrows in place of live values when the voltage exceeds the input rating of the meter. - Page 118 Scope and Multimeter Operations Operations 1— Trace tabs 2— Trace Probe icon 3— Trace Scale icon 4— Trace characteristics check boxes 5— Auto Find icon 6— Baseline position 7— Back icon 8— Exit icon Figure 8-17 Traces dialog box 4. Select the Trace Probe icon to open the menu. 5.
- Page 119 Scope and Multimeter Operations Operations Sweep Controls Sweep is the amount of time represented by the screen, or the horizontal scale of the display. To adjust Sweep controls: 1. Select Setup from the Scope Multimeter toolbar. The Scope Multimeter Preferences dialog box opens. 2.
- Page 120 Scope and Multimeter Operations Operations 1— Source—selects the triggering event: - Trace 1—sets the trigger to channel 1. - Trace 2—sets the trigger to channel 2. - Trace 3—sets the trigger to channel 3. - Trace 4—sets the trigger to channel 4. - Cylinder—sets triggering to the firing of a cylinder detected by the optional RPM Pickup or Secondary Ignition Adapter.
- Page 121 Scope and Multimeter Operations Operations View Controls Use the view controls to set display attributes. To adjust view controls: 1. Select Setup from the Scope Multimeter toolbar. The Scope Multimeter Preferences dialog box opens. 2. Select View to open a submenu. 3.
- Page 122 Scope and Multimeter Operations Operations The following options are available from the Display dialog box: Show RPM—adds an engine speed field at the top of the screen (Figure 8-21). • Figure 8-21 Sample Show RPM selected Show Digital KV—available only in ignition scope, displays digital kilovolt readings, rather •...
- Page 123 Scope and Multimeter Operations Operations Show Grid—switches grid lines on the screen off and on (Figure 8-23). • Figure 8-23 Sample grid selected Invert Colors—switches the screen background to white. • Layout Settings The selected radio knob on the Layout dialog box shows which setting is active. Use your finger or the stylus to switch between settings: 1 window—shows all traces on the same screen (Figure...
- Page 124 Scope and Multimeter Operations Operations Figure 8-25 Sample 2 Windows vertical display Figure 8-26 Sample 3 Windows display...
- Page 125 Scope and Multimeter Operations Operations Unit Setup The Unit Setup dialog box allows you to switch between Full Scale or Per Division settings for the trace setup and the display settings. Selecting Full Scale configures the units to the full viewing area of the screen, while Per Division adjusts the units to a single division (one tenth) of the screen.
- Page 126 Scope and Multimeter Operations Operations Units Selecting Units opens the Setup dialog box. The units of measurement can be changed between US customary or metric. The selected radio knobs on the Setup dialog box show which settings are active (Figure 8-28).
- Page 127 Scope and Multimeter Operations Operations Snapshot The Snapshot tab of the Setup dialog box opens a window that allows you to select how much data is captured after a snapshot is triggered (Figure 8-29). Available selections, which range from ten to ninety percent in ten-percent increments, are shown as icons with the current setting highlighted.
- Page 128 Scope and Multimeter Operations Operations To setup Ignition tests 1. Select the Setup icon to open the Setup dialog box. 2. Select the Ignition tab of the dialog box. 3. Highlight the ignition system for the test vehicle in the “Type” field: Standard—use for systems with a distributor –...
- Page 129 Scope and Multimeter Operations Operations Cursor 1, the top slider and arrows, is the left-hand cursor on the screen. Cursor 2, the lower set of controls, is the right-hand cursor on the screen. Drag the slider or select the arrows to position the cursors.
- Page 130 Scope and Multimeter Operations Operations Print Controls Selecting Print from the toolbar opens a standard Windows Print dialog box set up to print the current screen. A printer must be connected and setup on the Diagnostic Tool. If not, the “Add Printer Wizard”...
-
Page 131: Chapter 9: Repair Information
Repair Information Chapter 9 The Repair Information icon (Figure 9-1) can be used to: ® ® Access the SureTrack Community within ShopKey Pro that is included with current • diagnostic tool software, see SureTrack on page 177 for additional information. ®... - Page 132 ShopKey Pro Vintage—ShopKey Pro Vintage includes an extensive library of engine and • chassis repair information, along with wiring diagrams, and other information for vehicles back to 1960. ® Contact your Snap-on representative to learn more about ShopKey Pro or visit the following web pages: Snap-on Diagnostics ShopKeyPro Page •...
-
Page 133: Chapter 10 Quick Lookups
This section describes the basic operation, and navigation of the Oil Specifications and Resets function. Oil Specs and Resets provides up-to-date OEM information on your diagnostic tool, via wireless network connection with our Snap-on network. This feature allows you quickly access the following OEM information: Engine oil service reset procedures •... -
Page 134: Operation
Quick Lookups Operation 10.2 Operation NOTE: The information and procedures provided by the Oil Specs and Resets function is vehicle specific, therefore a vehicle must be identified before information can be displayed. Using the Oil Specs and Resets function There are two methods to access this function: From the Home screen - select the Quick Lookups icon (Figure 10-1), then select the Oil... -
Page 135: Fluid Capacity
Quick Lookups Operation 1. Follow the screen prompts to select vehicle attributes (e.g. Manufacturer, Year, Model etc.). 2. Select OK to confirm the vehicle. 3. Wait for the OEM Information screen to be displayed, the Fluid Capacities screen is displayed by default. -
Page 136: Reset Procedure
Quick Lookups Operation 10.2.2 Reset Procedure Selecting Reset Procedure displays OEM oil service reset instructions. Typical information may include: Step-by-step instructions for manually resetting the oil service reset indicator using • on-board vehicle functionality (e.g. instrument cluster controls, accelerator pedal, information or media center controls, multi-function switch, etc.) Special notes, and or instructions •... -
Page 137: Functional Reset
Quick Lookups Operation 10.2.3 Functional Reset Selecting Functional Reset opens the service interval reset menu (within the Scanner function) for the selected vehicle, and includes functional resets for the oil service indicator and other supported resets. IMPORTANT: Instructions may be provided, that are required to be performed before selecting or completing the Reset function itself. -
Page 138: Tsbs (Technical Service Bulletins)
Quick Lookups TSBs (Technical Service Bulletins) 10.3 TSBs (Technical Service Bulletins) The TSBs (Technical Service Bulletins) function can provide the following (if available) for the identified vehicle: Original Equipment Manufacturer (OEM) Technical Service Bulletins, Recalls and Campaigns • National Highway Traffic and Safety Administration (NHTSA) recalls •... - Page 139 Quick Lookups TSBs (Technical Service Bulletins) Accessing TSBs (vehicle not identified or to change a vehicle): If a vehicle has not been identified or you need to find TSBs for a different vehicle from the one that is identified, use the following procedure. 1.
- Page 140 Quick Lookups TSBs (Technical Service Bulletins) Using the TSBs function: Available information (e.g. Technical Service Bulletins and recalls) is displayed in a list (Figure 10-8). Recalls and other safety related documents are typically displayed at the top of the list by category. TSBs and other service related information are categorized by system and components.
- Page 141 Quick Lookups TSBs (Technical Service Bulletins) 2. Select a link to display service information (Figure 10-10). Use the scrollbar to view all the contents of the window. Typical TSBs information may include: Vehicles involved – Service notes – Symptoms and Conditions –...
- Page 142 Quick Lookups TSBs (Technical Service Bulletins) Creating a favorites list: 1. From the Vehicle Manufacturer selection window, select Configure Favorites from the menu. The vehicle manufactures selection window opens (Figure 10-11). 2. Select (highlight) the vehicle manufactures to include in your custom list. 3.
-
Page 143: Printing
Quick Lookups Printing 10.4 Printing 10.4.1 Printing Oil Specs and Resets Selecting Print from the toolbar will open the selected document (Fluid Capacity, Reset Instructions, etc) in the print preview window. The following image (Figure 10-12) shows a typical Oil Specs and Resets document in the print review window. -
Page 144: Printing Tsbs
Quick Lookups Printing 10.4.2 Printing TSBs After selecting and opening a TSB file, select Print from the window to open the selected document in the print preview window (Figure 10-13). Figure 10-13 TSBs print icon The following image (Figure 10-12) shows a typical TSB document in the print preview window. Figure 10-14 TSBs print preview window... -
Page 145: Chapter 11 Vehicle History Operations
Vehicle History Operations Chapter 11 Vehicle History allows you to manage and retrieve vehicle records, for vehicles that have been scanned or identified previously. You can also activate a vehicle, so there is no need to go through the complete vehicle identification sequence when performing a retest after repairs have been made. -
Page 146: Vehicle History Toolbar
Vehicle History Operations Screen Layout To resize a column: 1. Select the line separating two columns. A line with arrowheads appears to show the column is ready for resizing. 2. Drag the line left or right to increase or decrease the column width. 11.1.2 Vehicle History Toolbar The table below gives brief descriptions of the control icons on the toolbar: Table 11-1 Toolbar icons... - Page 147 Vehicle History Operations Screen Layout View Select View to open, edit, add notes, and print a vehicle record. To open and/or modify a vehicle record: 1. Highlight the desired vehicle record from the vehicle records list screen, then double click it, or select View from the toolbar.
- Page 148 Vehicle History Operations Screen Layout Manage Select Manage to quickly remove individual records, or all the vehicle records from the vehicle records list. Highlight the record to remove, then select Delete, or use the Select All or Deselect All options to remove all records (Figure 11-3).
- Page 149 Vehicle History Operations Screen Layout Figure 11-4 Sample Search dialog box 3. Select Search twice. The first tap closes the keyboard, the second tap starts the search. The display returns to the vehicle records list screen with only the records found in the search criteria showing.
- Page 150 Vehicle History Operations Screen Layout 2. Select or deselect the desired categories: Highlighted items - do not display – Non-highlighted items - display – 3. Select OK on the toolbar to accept the changes, and return to the previous screen.
-
Page 151: Chapter 12: Data Manager Operations
Data Manager Operations Chapter 12 The Data Manager is used to store, sort, and review saved files. Most operations are controlled through the toolbar. 12.1 Screen Layout Select Data Manager on the Module toolbar to open the file system. Use the toolbar at the top of the screen to navigate through the data. -
Page 152: Navigation
Data Manager Operations Navigation Scope Multimeter Data Folder—contains files saved while working with the Scope Multimeter. • Scope Viewer on page 165. Screenshots—contains images saved by pressing the Shortcut (S) button. See Image Viewer • on page 166. Vehicle System Report Data Folder—contains vehicle code scan reports. See Vehicle System •... -
Page 153: Operations
Data Manager Operations Operations 12.3 Operations Data Manager operations based on toolbar selections are explained in the following sections. 12.3.1 My Data The My Data icon is a shortcut that quickly returns you to the main Data Manager screen. Select the icon at any time to instantly return. -
Page 154: New
Data Manager Operations Operations The screen advances and the contents of the open folder are shown in the folders panel. Highlight an item in the folders panel and the information or preview displays, if available, in the lower portion of the screen (Figure 12-2). -
Page 155: Delete
Data Manager Operations Operations 12.3.5 Delete The Delete icon moves folders or items within folders to the Recycling bin. A confirmation displays when a file is selected for deletion. Select Yes to delete the file or Cancel to exit. To delete an item: 1. -
Page 156: Rename
Data Manager Operations Operations 12.3.6 Rename The Rename icon allows you to change the name of a folder or items within a folder. To rename an item: 1. Highlight the item or folder to be renamed. 2. Select the Rename icon on the toolbar. The New Name dialog box opens (Figure 12-3). -
Page 157: Properties
Data Manager Operations Operations 12.3.7 Properties The Properties icon function allows you to change the name and assign identifying attributes to saved Scope Multimeter files. Operation is similar to renaming a file as discussed above, except there are additional fields for entering descriptive information. To assign properties to an item: 1. -
Page 158: Email
Data Manager Operations Operations 12.3.9 Email Selecting the Email icon from the Data Manager toolbar allows you to send a saved data or image file as an attachment using e-mail. To use this feature, you must install an e-mail client, and then either link your existing e-mail address to the client, or create a new address. - Page 159 Data Manager Operations Operations attachment Figure 12-8 4. Enter the e-mail address of the recipient, and any other information needed. 5. Select the Send icon to send the e-mail. NOTE: You must have an Internet connection to send e-mail. E-mail client installation and setup (Example): The following instructions are intended as a guide only, as e-mail client setup procedures vary.
- Page 160 Data Manager Operations Operations 2. Install the software following the screen prompts (Figure 12-10). Figure 12-10 3. Continue through the setup. If available choose “set as my default mail application” (Figure 12-11). Figure 12-11...
- Page 161 Data Manager Operations Operations 4. Choose to use your existing email address, or create a new email address with the email client (Figure 12-12). Figure 12-12 5. Enter your e-mail information as required (Figure 12-13). NOTE: E-mail client configuration settings should automatically be set during installation. If problems arise with the setup and manual configuration is needed, refer to the e-mail client help information and the Windows help information.
- Page 162 Data Manager Operations Operations 6. If your existing email provider login screen displays, enter your email address and password to allow the client to continue the setup with your provider (Figure 12-14). Figure 12-14 7. Follow the screen prompts to allow the client to link to your email address. 8.
-
Page 163: Viewing Saved Files
Data Manager Operations Viewing Saved Files 12.4 Viewing Saved Files As mentioned in the beginning of this section, the data and image files in the Data Manager folders are also accessible from the Windows My Documents > ShopStream folder. You may access, copy or move the files you save in the ShopStream Diagnostic Suite program from the folder at anytime. -
Page 164: Vehicle System Report Data Folder
Data Manager Operations Vehicle System Report Data Folder 12.6 Vehicle System Report Data Folder The Vehicle System Report Data Folder contains saved Code Scan (trouble code) files. 12.6.1 Vehicle System Report Data Selecting the Vehicle System Report Data folder opens a list of the saved Code Scan (trouble code) files. -
Page 165: Scanner Dataviewer Operation
Data Manager Operations Scanner DataViewer Operation 12.7 Scanner DataViewer Operation The Scanner DataViewer allows you to review saved scanner data files (Figure 12-18). To open saved Scanner data files, select the Scanner Data Folder menu option from the Data Manager main menu. -
Page 166: Menu Bar
Data Manager Operations Scanner DataViewer Operation 12.7.1 Menu Bar The menu bar at the top of the screen contains the File, View, Tools, and Help menus. File Menu The File menu offers the following selections: Load—locate and open data files, launches a navigation window •... - Page 167 Data Manager Operations Scanner DataViewer Operation Figure 12-20 Print preview window (text list and graphs examples) View Menu The View menu allows you to change how data is displayed on the screen (Figure 12-21). Figure 12-21 Scanner DataViewer View menu Select from the following menu options: Text Only—shows all parameters and their values as text only •...
- Page 168 Data Manager Operations Scanner DataViewer Operation Tools Menu The Tools menu opens the Properties dialog box. The Properties dialog box has two sections (Figure 12-22); Shared Graph Properties and Individual Properties. Shared Graph Properties apply to all graphs and Individual Properties apply to the selected graph only.
-
Page 169: Display Toolbar
Data Manager Operations Scanner DataViewer Operation Help Menu The Help menu provides Scanner Viewer software version information. 12.7.2 Display Toolbar The Display toolbar provides the following controls (Figure 12-23). Exit—closes Scanner DataViewer. • Hide PID List—toggles display between parameter text and graph views. •... -
Page 170: Navigation Tools
Data Manager Operations Scanner DataViewer Operation 12.7.3 Navigation Tools Playback Controls The playback controls allow you to navigate through saved data (Figure 12-24). 1— Skip Back—Allows backward movement in multiple steps. 2— Step Back—Allows backward movement in singular steps. 3— Play—Select to play. 4—... - Page 171 Data Manager Operations Scanner DataViewer Operation Slider / Scroll Bars and Cursor Use the slider bar to quickly navigate through the data (Figure 12-26). During playback the number displayed on the left side of the slider bar indicates the current position of the cursor in the data file.
-
Page 172: Customizing The Display
Data Manager Operations Scanner DataViewer Operation 12.7.4 Customizing the Display The parameter text list (left side) displays parameter names and current values. The display can be customized by selecting and dragging parameters from the text list or graph display to a different location in the text list or in the graph display (Figure 12-27). -
Page 173: Customizing The Parameter List
Data Manager Operations Scanner DataViewer Operation 12.7.5 Customizing the Parameter List 1. The parameter configuration tabs allow you to choose between displaying all available parameters (Complete List), or only those from a (Custom List) (Figure 12-28). To customize the parameter list: 1. - Page 174 Data Manager Operations Scanner DataViewer Operation A list of available parameters displays (Figure 12-29). 3. Select the parameters to include in your custom list. Select All and Deselect All controls are also available to assist in the selection process. Figure 12-29 Creating a custom parameter list 4.
-
Page 175: Scope Viewer
Data Manager Operations Scope Viewer 12.8 Scope Viewer This section is intended as an introduction of the Scope Viewer, as many features are similar to the Scope module features. The Scope Viewer allows you to print and playback recorded trace signals captured on your diagnostic tool. -
Page 176: Image Viewer
Data Manager Operations Image Viewer 12.9 Image Viewer The Image Viewer allows you to open and view image files and screenshots. Figure 12-31 1— Exit - closes the Image Viewer 2— Print - prints the image 3— Captured Screen Image... -
Page 177: Chapter 13 Help Operations
Help Operations Chapter 13 Selecting Help from the Home screen opens this manual in a dedicated screen viewer. Navigate through the file either by gesture scrolling on the touch screen, or with the scroll bar along the right edge of the viewing screen. A left-to-right scroll bar appears at the bottom of the screen when magnification is increased. -
Page 178: Chapter 14 System Settings Operations
System Settings Operations Chapter 14 Selecting System Settings from the Home screen opens a menu with two options: Paired Devices - Paired Devices allows you to check the status and pair wireless devices to • the diagnostic tool. Shop Information - Shop Information allows you to create and edit a personalized header that •... -
Page 179: Paring The M2 Scope/Meter (Optional Equipment)
System Settings Operations Paired Devices 14.1.4 Paring the M2 Scope/Meter (Optional Equipment) NOTE: The M2 Scope/Meter is optional equipment for some diagnostic tools and may not be included with your diagnostic tool kit. For detailed operation instructions, see the M2 Scope/Meter instructions supplied with your M2 and/or diagnostic tool. - Page 180 System Settings Operations Paired Devices Figure 14-2 Bluetooth Discovery (shown enabled “on”) 6. With Bluetooth Discovery enabled, turn the M2 Scope/Meter Rotary Switch to the Remote Functions position (Figure 14-3). Figure 14-3 Rotary switch Remote Functions setting 7. Select the System Settings icon on the Home screen of the diagnostic tool. 8.
- Page 181 System Settings Operations Paired Devices Figure 14-4 Typical Device selection A “in progress” message displays during the pairing procedure, which takes several seconds. The Paired Devices screen displays once the procedure completes (Figure 14-5). Figure 14-5 Typical Paired Devices screen 12.
-
Page 182: M2 Scope/Meter Hardware Status Indicators
System Settings Operations Paired Devices Figure 14-6 Bluetooth Discovery (shown disabled “off”) 14.1.5 M2 Scope/Meter Hardware Status Indicators The Hardware Status indicators in the lower-right corner of the Home screen provide a quick reference to the M2 operation status. The background color of the status indicator icon represents the condition of the wireless connectivity. -
Page 183: Shop Information
System Settings Operations Shop Information 14.2 Shop Information This option allows you to add personalized shop information that can be included on printed data files. Selecting opens a form that can be filled in using the virtual keyboard. Select OK when the form is complete and the information is saved. - Page 184 System Settings Operations Shop Information Figure 14-8 Virtual keyboard Top and Bottom icons 5. Close the virtual keyboard and review the information once all the fields have been filled in. 6. Select OK from the toolbar to save the Shop Information, or Cancel to close the Shop Information dialog box without saving.
-
Page 185: Data Backup
System Settings Operations Data Backup 14.3 Data Backup Selecting Data Backup from the Systems Settings main menu provides two options, backup and restore. 14.3.1 Backup The Backup option allows you to back up your saved data to a file on the internal hard drive, or to an external drive (e.g. -
Page 186: Restore
System Settings Operations Data Backup 14.3.2 Restore The Restore option is used to restore your backed up data, in the event that the data is lost or if a system restore (recovery) has been performed. This function is only applicable when a backup file has been previously saved (file extension .sna). Backup on page 175 for additional information. -
Page 187: Chapter 15 Suretrack
SureTrack Chapter 15 Designed to help you improve diagnostic accuracy and reduce repair time, SureTrack is a comprehensive source of expert knowledge for professional technicians, combining diagnostic experience and detailed parts replacement records. Your access to SureTrack includes: A Common Replaced Parts (CRP) graph, showing which parts are most frequently replaced •... -
Page 188: Using Suretrack In The Scanner Function
SureTrack Using SureTrack in the Scanner Function 15.2 Using SureTrack in the Scanner Function To access SureTrack information from within the Scanner function you must: Have a Wi-Fi Internet connection • Have the current software version installed on the diagnostic tool •... -
Page 189: Dashboard Feature Information
SureTrack Using SureTrack in the Scanner Function 15.2.2 Dashboard Feature Information Dashboard Feature Information includes: Detailed DTC Information • Related Tips, Real Fixes and Repair Information • SureTrack will display detailed information about the current DTC describing code setting conditions, possible symptoms, system operation and possible solutions (Figure 15-2). -
Page 190: Suretrack Status Messages
- indicates your access to SureTrack will be expiring soon and you should contact your sales representative to purchase the current software upgrade. Your SureTrack access has expired. See your Snap-on representative to renew. - • indicates your access to SureTrack has expired and you should contact your sales representative to purchase the current software upgrade. -
Page 191: Using The Suretrack Community
Code on page 183 Have a Wi-Fi Internet connection • Have the current software version installed on the diagnostic tool. See your Snap-on • Representative for information. Creating a SureTrack Account If you are a new member (do not have an existing SureTrack account), you will need to complete the online registration before you can use the SureTrack Community. - Page 192 SureTrack Using the SureTrack Community (within ShopKey Pro) Enter all required information. Choose 3 security questions. See “Finding your SureTrack Authorization Code” on the next page. Find the SureTrack Authorization Code on your sales receipt. 12 digit alpha-numeric code (e.g. 123ABCAP4-US) Figure 15-6...
- Page 193 Figure 15-7 Finding your SureTrack Authorization Code When you purchase a software upgrade, or qualifying platform from your Snap-on Representative, you will receive a SureTrack authorization code. The authorization code is printed on your sales receipt. Authorization codes are 12 digit alpha-numeric codes (e.g.
-
Page 194: Logging In (Existing Active Account)
SureTrack Using the SureTrack Community (within ShopKey Pro) Each time you purchase an a diagnostics software upgrade you will be provided a new SureTrack authorization code. The authorization code will expire shortly after the release of the next concurrent software upgrade. To log in with a new authorization code, see Logging In (existing expired account) on page 185. -
Page 195: Logging In (Existing Expired Account)
(Figure 15-10). To purchase software upgrades, or join the software subscription program, see your Snap-on Representative. Selecting OK will close the message box until the beginning of the next month when it will appear to remind you again. Selecting Snooze 1 Week will close the message box for approximately one week and then it will re-appear. -
Page 196: Chapter 16 Shopstream Update Tool (Sst)
The following terms are used in this section and throughout this manual as described below: Software Upgrade - a new diagnostic software version. Software upgrades include new and • enhanced coverage and features for subscribed Snap-on diagnostic tools. Software Update - a service release “update” for a existing diagnostic software version •... - Page 197 ShopStream Update Tool (SST) Basic Operation Figure 16-1 SST Icon in system tray Selecting the SST icon from the system tray provides the following menu choices: Check for Updates - Allows you to manually check for software updates anytime. See •...
-
Page 198: Manual Software Download
ShopStream Update Tool (SST) Manual Software Download 16.2 Manual Software Download This section describes the basic procedures for manually downloading software updates and upgrades. Normally, the SST will automatically detect and download software. If necessary, use the following procedure to manually check for and download software. NOTE: Software Subscription Customers Only - It is recommend that you download software upgrades when not actively using the diagnostic tool. - Page 199 ShopStream Update Tool (SST) Manual Software Download 2. Select Check for Updates from the menu. A series of message boxes will display as the SST searches for updates (Figure 16-4). Figure 16-4 Typical - Checking for Updates message Once the search is complete, one of two results are expected: If no updates are found, the message box closes and a “No updates available”...
-
Page 200: Installing Software Updates
ShopStream Update Tool (SST) Installing Software Updates Cancel—stops and cancels the download and closes the message box. If you select – Cancel, and choose to re-start the download again, the download will start from the beginning. 4. Once the download completes, it must be installed. See the applicable instructions for Installing Software Updates on page 190 or Installing Software Upgrades... - Page 201 ShopStream Update Tool (SST) Installing Software Updates Figure 16-7 Typical update installation window 2. Select an installation option to continue: Install Now—starts the software update installation. Proceed to step 3. – Install Later—closes the message. The message will reappear at a later time as a –...
-
Page 202: Installing Software Upgrades
The installation will take approximately 30 minutes. If the installation is interrupted, Contact Snap-on Diagnostics Customer Care for assistance. See the Snap-on contact information at the front of this manual. NOTE: If applicable, before installing a software upgrade, have your Scan Module and USB cable available. - Page 203 ShopStream Update Tool (SST) Installing Software Upgrades 2. Select an installation option to continue: Upgrade Detail—opens a PDF file describing the details of the software upgrade, – including any accessories that may be required. Install Now—starts the software upgrade installation. Proceed to step 3. –...
-
Page 204: Chapter 17 Maintenance
Maintenance Chapter 17 This section describes typical maintenance and care procedures for your Diagnostic Tool and components. 17.1 Diagnostic Tool 17.1.1 Cleaning Periodically perform the following tasks to keep your Diagnostic Tool in proper working order: Check the housing, cables and connectors for dirt and damage before and after each use. •... - Page 205 Maintenance Diagnostic Tool Risk of explosion. • The Lithium battery is factory replaceable only, incorrect replacement or tampering with the battery pack may cause an explosion. Explosion can cause death or serious injury. Battery Safety Guidelines IMPORTANT: The battery pack contains no user serviceable components. Tampering with the battery pack terminals or housing will void the product warranty.
- Page 206 If the battery pack no longer holds a charge, contact your sales representative to order a new one. IMPORTANT: Replace the battery pack with a Snap-on replacement battery pack only. To replace the battery pack: 1. Loosen the two battery pack screws.
-
Page 207: Calibrating The Touch Screen
Maintenance Diagnostic Tool Disposing of the Battery Pack Always dispose of a lithium-ion battery pack according to local regulations, which vary for different countries and regions. The battery pack, while non-hazardous waste, does contain recyclable materials. If shipping is required, ship the battery pack to a recyling facility in accordance with local, national, and international regulations. - Page 208 Maintenance Diagnostic Tool 2. Select the diagnostic tool display from the dropdown list. The current default diagnostic tool display number “1.10257C” is shown in Figure 17-3 as an example. NOTE: NOTE: If you are using an optional touch screen (e.g. using an external touch screen with a Tech Cart and docking station), there will be an additional touch screen choice displayed.
-
Page 209: Screen Protector Installation
Maintenance Diagnostic Tool 17.1.5 Screen Protector Installation Touch screen protectors are available as optional equipment (contact your sales representative to order). The following procedure describes typical installation procedures. Items recommended for installation: Microfiber type cloth (lint-free) • Flexible straight edged tool (e.g. small squeegee, plastic card) •... - Page 210 Maintenance Diagnostic Tool Installation Tip(s): To remove air bubbles, slowly work from the inside towards the edges. If large air bubbles are trapped, it may be easier to carefully peel back the protector and re-apply. If air bubbles are persistent, it is an indication that the screen and/or protector are not clean. If visible dust is noticed trapped under the protector, peel back the protector and use the adhesive side of a small piece of cellophane tape to remove the dust.
-
Page 211: Stylus Tip Replacement
Maintenance Diagnostic Tool 17.1.6 Stylus Tip Replacement Periodically the capacitive stylus tip may need to be replaced. There are two styles of removable stylus tips. Style “A” (Figure 17-7) - To remove, unthread the tip counterclockwise. To install a new stylus tip, thread it on clockwise until seated. -
Page 212: Operating System Restore
To restore the operating system 1. Turn on the Diagnostic Tool. 2. Wait for the “Press the “S” button to run Snap-on System Restore.” message to display, then Press the Shortcut (S) button. A progress indicator displays while the program loads. -
Page 213: Scan Module
Maintenance Scan Module 17.2 Scan Module This section covers how to care for your Scan Module. 17.2.1 Cleaning and Inspecting the Scan Module When using the Scan Module, make sure to do the following: Check the housing, wiring, and connectors for dirt and damage before and after each use. •... -
Page 214: Index
Index Numerics Data Manager 141 operations 147 10-Minute Electronic Class 82 properties 147 15-Minute Ignition Class 82 screen layout 141 20-Minute current ramp classes 82 toolbar 142 data parameters displaying 46 AC/DC power supply 6 delete 137 actuator tests 46 demonstration programs 25 Alarms 29 Diagnostic 3... - Page 215 Index reset tests 54 identifying a test vehicle 39 Illustrated Terms and Definitions 82 Safety v Image Viewer 166 Scale 33 inductive RPM pickup adapter 98 Scan Module information tests 54 introduction 9 specifications 8 Troubleshooter 77 Main Body 101 wireless communication 10 Making Selections 104 Scanner...
- Page 216 Index secondary coil adapter 97 selecting a system to test 39 variable control tests 54 selecting tests 39 Vehicle History 135 ShopKeyPro 121 activate 136 Shortcut Button 13 delete 137 Shortcut button screen layout 135 Configuring 14 search 138 Sleep Mode 12 settings 139 toolbar 136 software...
Need help?
Do you have a question about the VERUS edge and is the answer not in the manual?
Questions and answers