Table of Contents
Advertisement
Advertisement
Table of Contents

Related Manuals for VMI VIBER X5 MKIII


Summary of Contents for VMI VIBER X5 MKIII
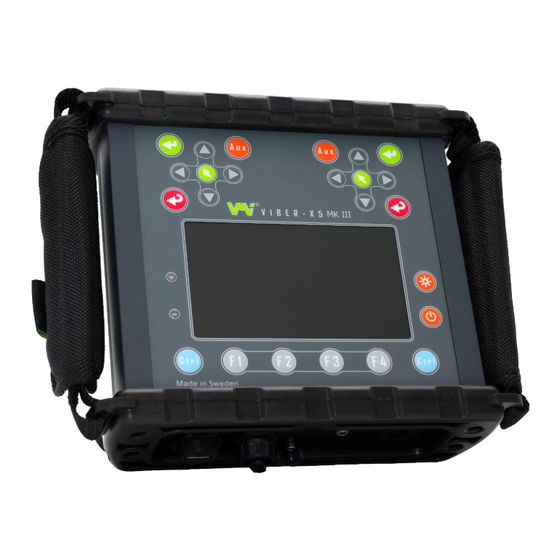
- Page 1 VIBER X5 MKIII™...
- Page 2 Instrument Manual...
- Page 3 Gottorpsgatan 5 SE-582 73 Linköping, Sweden E-mail: info@vmiab.com www.vmiab.com Copyright© 2012 by VMI International AB. No copying or reproduction of this information may be undertaken without written permission of VMI International AB. Due to continuous product development the information in this document...
-
Page 4: Important Information
VMI takes no responsibility for any accidents on people and machines. VMI and our authorized dealers will take no responsibility for damages on machines and plants as the result of the use of VIBER X5 MkII measurements. -
Page 5: Table Of Contents
Table of Contents IMPORTANT INFORMATION CHAPTERS 1. INSTRUMENT OVERVIEW 1.1. I NTRODUCTION 1.2. S COPE OF SUPPLY 1.3. I NSTRUMENT BASICS 2. DATA STORAGE AND TRANSFER 2.1. F ILES 2.2. C ONNECTION 2.4 FAQ REGARDING TORAGE AND RANSFER 3. HELP 4. - Page 6 7.7. S PEED 7.8. P HASE 7.9. C OAST 7.10. C OAST 7.11. O RBIT 7.12. D OGGER 7.13. V IBSHAPE 8. BALANCING 8.1. B ALANCING HEORY 8.2. B ALANCING PPLICATION MENU 8.3. B ALANCING ETTINGS 8.4. ISO 1940-1 S ETTINGS 8.5.
-
Page 7: Chapters
Chapters Page No. 1. Instrument Overview. This chapter provide a general introduction of the VIBER X5 MkIII™, it also describes the scope of supply, the basics on how to use and navigate in the instrument and also the general settings. -
Page 8: Instrument Overview
EASY TO USE VIBER X5 MkIII™ has a graphical user interface, a right and left hand operated keyboard and a user friendly context sensitive HELP. The measurements are grouped so that a novice user can easily handle them, but also the experienced users have access to the advanced measurement menus. -
Page 9: Scope Of Supply
RELIABLE VIBER X5 MkIII™ is an essential tool for the monitoring of machine health. It has a high performance VS cost value and offers reliable measurements to ISO standards in combination with a range of features. Portable vibration monitoring is important part of condition assessment. Regular vibration measurement offers a cost effective and advanced complement to online visual inspections and an outstanding analysis alternative. -
Page 10: Instrument Basics
1.2.1. Optional Accessories The VIBER X5 MkRII™ have a wide variety of accessories. Contact VMI or your local distributor for more information of what is available. Here are some examples: Additional applications Expand your VIBER X5 MkIRI™ with additional software with a onetime license fee. - Page 11 Keypad The VIBER X5™ has double sets of the most frequently used keys, that’s too allow operation by both left and right hand. UP Arrow key RIGHT Arrow key Aux key OK key MENU key LEFT Arrow key ESC key DOWN Arrow key Light Key...
-
Page 12: Front Panel
OK (Enter). Used to start a measurement(or resume the measurements from HOLD status), confirm an action or go forward in a menu. AUX. Used to stop a measurement. ESC (Escape). Used to Cancel an action or to return to the previous menu. Arrows (UP, DOWN, LEFT, RIGHT). - Page 13 Cable Connector (solder view)
- Page 14 Auto Detection Transducer Connections...
-
Page 15: Status Bar
Cable Connector (solder view) 1.3.3. Status Bar Date / Time Menu description Charger Battery 1-2: Status Bar Audio Amplifier Most of the screens have a header showing the system status. The window header displays: Current date and time Current menu description ... - Page 16 1.3.4. Shortcut bar On the bottom of the screen, the program will display the present available shortcuts that can be used by pressing the function keys. Example shortcuts in Route: Depending on the context, some shortcuts may be disabled (as (F2)-”View Spectrum”...
- Page 17 1.3.5. Application Selection The instrument has a graphical interface to access different application programs. In the application selection menus, each of the applications is Figure 1-3: Instrument Settings menu represented as a small picture/icon with a short description beneath. The applications are hierarchically organized. A selected task/icon will have a green color.
-
Page 18: Virtual Keyboard
The program filters the keys to be valid for parameter value. If a number is required, an alphanumeric character will be ignored. If a file name is required, the first character must be alphanumeric. To save the new value, press (OK). -
Page 19: Main Menu
1.3.9. Main menu In the main menu, besides being the first screen from which you navigate to the different application programs, you can also see: The battery status in V (Volt) and % (Percent) Figure 1-9: Main menu The serial number of the instrument ... - Page 20 Press (OK) to change the half of the screen which is currently tested. Press (ESC) to exit. Figure 1-15: Display instructions If the colors do not appear correctly, the display unit should be changed in a VMI Service Centre.
-
Page 21: General Settings
1.3.11.3. Bias With this tool you can check for transducer faults. Figure 1-16: Bias selection From Main Menu select Settings, System Tools and Bias. When using displacement transducers this tool can be used to adjust the proper position (usually when the bias reaches half of the supply voltage). The instrument will start measuring bias using the power settings of installed transducer. - Page 22 The default instrument language is English. Almost any language may be implemented. Please check the VMI Internet Download page for available languages. If you would like to use a language that is currently not available, contact your local distributor for files to translate.
- Page 23 1.3.13. Transducers In this menu, you can edit a list of sixteen transducers, which may be used for the measurements. From the Main menu, select Figure 1-20: Transducers Selection Settings and Transducers. Edit Transducer’s is an option in most Measurement Settings accessible by pressing (F2) on the shortcut bar.
- Page 24 PROCESS AC User defined DISP #1 Displacement User defined DISP #2 Displacement User defined AC 135 Low frequency User defined VMI 192 Acceleration User defined AC 102 Acceleration User defined AC 905 Acceleration User defined HG 91 Velocity User defined...
- Page 25 Available settings are: Auto: In Auto mode, the Instrument will automatically detect any of the connected auto Figure 1-23: Select Sensor detectable transducers. If a non-auto detectable cable/transducer is connected this mode will display a message alerting the user. Tip! When using only standard transducers, assign Auto to all inputs.
- Page 26 (F1) = Update picture and icon file (F2) = Update font file (F3)=Update program (Firmware). If you have many program versions available (loaded in the instrument), select by file and date name the version to load. (F4)= Update language (Messages and Help). The first three letters of the file name determine the language of the files.
- Page 27 This situation may happen with significant firmware changes and will be specified by VMI on the download page of the new firmware release. Step 1: Stop the instrument and connect to a PC using USB cable. Copy the firmware program file and the associated resource files in to the designed folders.
-
Page 28: Data Storage And Transfer
Figure 2-1: Files Selection From the Main menu, select Files. VIBER X5 MkIII™ is able to use either a USB Drive or micro SD Card for storage (total available storage capacity is depending on hardware revision and formatting parameters, minimum storage is 1 GB the Viber X5 MkIII has 4GB). - Page 29 Table 2-1: File Types shows the different file types and their location on the SD card Table 2-1: File Types File type Folder Extension Balancing BALANCE Coast Up-Down COAST Envelope ENVELOPE Data logging LOGGING Route files ROUTE Screens as pictures SCREENS Spectra SPECTRA...
-
Page 30: Connection
Connection Connection to a PC to transfer files can be established in two ways: 1. With the VIBER X5 MkIII™ turned Off, insert the USB Figure 2-3: Connection Selection cable. 2. With the VIBER X5 MkIII™ turned On, From the MAIN menu, select Connection. -
Page 31: Faq Regarding Data Storage And Transfer
If the VIBER X5 MkIII™ is running, the best choice is to format the card inside the Instrument, for a better performance. If the software of VIBER X5 MkIII™ is asking me to edit a file name, what names are valid for the micro SD Card? Answer: The file system for the SD Card accepts file names up to 8 letters (or numbers), a dot and an extension of 3 letters (example: BAL00005.MV4). -
Page 32: Help
3. Help This menu is a direct access to the context sensitive help system. The Help menu is also available in any static menu by pressing the (MENU) key and select Help. From Main menu select Help. Or in any static, HOLD or stopped mode press (MENU) key and select Help. -
Page 33: Transfer A Route To Or From The Instrument
: in SpectraPro®, transfer the route to a file. Then, copy the file to the Routefolder in the VIBER X5 MkIII™ SD Card. If you copy the Route file to another folder or to the Card root, the instrument will not show the file in the existing Route List. - Page 34 This means that when you stop the measurements in a Figure 4-2: Route Menu route, you can shut down the VIBER X5 MkIII™ to save power, or make additional off route measurements. You can after that, anytime resume the route measuring where you left it, by simply selecting the Route application again.
-
Page 35: Instrument Route Settings
Table 4-1: Key action in Route Action in Route UP/DOWN. Change the hierarchy level in the route (Plant, machine, point, direction) LEFT/RIGHT Go forward/backward in the route. Depending where you are in the hierarchy level you will move either forward, to plant, machine, point or direction level. -
Page 36: Instrument Route Manager
To change the route setting, press (F4). The program will enter route settings menu In the Route settings menu you can change: Figure 4-3: Route Settings Auto Advance (Enabled or Disabled) - If auto advance is enabled, the instrument automatically jump to the next direction, when it completes data collected for the present direction. - Page 37 1. Copy the Route Viewer folder from the Instruments SD Card to your PC 2. Double click on the Setup.exe file. The Route files can be viewed directly from the VIBER X5 MkIII™ microSD Card, if the instrument is connected to the PC and the card is shown in Windows Explorer A convenient way to see the Route files is to “teach”...
- Page 38 Route files are located in the ROUTE folder on the SD Card. If a Route file is corrupted, a warning message will appear. A corrupted file should be deleted from the VIBER X5 MkIII™ microSD Card.
-
Page 39: Setting Up Measurements
5. Setting up Measurements This chapter describes the different general settings that can be made in the applications and when to use them. 5.1. Getting started with Measurements The general procedure for the measurements in VIBER X5™ can be divided into 4 steps: step settings: The measurements start with a settings menu, where you set the parameters for the measurement. - Page 40 5.1.1. Measurement type (Acceleration, Velocity, Displacement or mV) Depending on choice, the instrument will integer and display the units of measurement different. 5.1.2. Detection type (RMS, Peak or Peak-Peak) How the amplitude of the frequency is calculated. For pure sine waves, the detection types are related as followed: RMS = √ 2 times zero to Peak;...
- Page 41 5.1.6. No of lines (800, 1600, 3200, 6400, 12800 or 25600) In this setting number of lines is set and displayed in spectra. The resolution increases when the number of lines increases, but also the time necessary for data acquisition. Example: If you have a Max frequency of 400 Hz and your No of lines are 6400 Then total collection time is:...
- Page 42 Hanning Is useful for measurements where better frequency resolution than some of the other windows is desired but moderate side lobes do not present a problem (resolution is more important than amplitude accuracy). Hamming The window is optimized to minimize the maximum (nearest) side lobe, giving it a height of about one- fifth that of the Hanning window.
- Page 43 5.1.8. Averaging (Linear, Exponential, Smart, Peak Hold) Averaging means that the different parts are averaged together, and can be used for reducing random errors like background vibration due to a source other than the machine being measured. Linear means that each part spectra/value has the same weight in the final spectra/value. If we for example select 8 as the No of Averages, every line level in the spectra will be divided by 8.
- Page 44 If you collect more averages, you will have fewer random errors. However, collecting more averages requires more time. If we for example select 8 No of Averages the instrument will measure 8 different spectra and continuously calculate an average spectrum. Usually 6 to 8 measurements are enough. 5.1.10.
-
Page 45: Recommended Vibration Levels
6. Recommended Vibration Levels This chapter describes the ISO standard 10816-3 and which vibration levels that is recommendable. It also describes resonance and where to place the transducers for best result. The lists and tables in this chapter can be used, as a first consideration, when you approach a machine newly commissioned or after some time in operation. -
Page 46: Iso Standard 10816-3
6.1. ISO standard 10816-3 The ISO standard 10816-3 classifies machines differently whether the machines are considered as flexible or rigid mounted. This reflects the location of the machines stiff- body resonances related to the basic running speed of the machine. For instance, a machine supported by rubber or spring, have resonances at low running speeds. -
Page 47: Resonance
6.2. Resonance Existence of resonance at a frequency where the machine is running should be rectified as early as possible, since it will significantly affect the economic operation of the machine. All machines have similar built in "tunes" with corresponding properties consisting of stiffness and a mass in the form of mechanical strings such as shafts, beams, floors and other mechanical parts. -
Page 48: Recommended Transducer Locations
6.3. Recommended transducer locations: • Measure on or as close to the bearings as possible. • Measure vertically and horizontally in the same direction with the shaft centre. • Measure axially at the same height as the shaft centre. Mp 3 V Mp 3 V Mp 2 V Mp 2 V... -
Page 49: Measure (Off-Route)
7. Measure (Off-Route) This section describes the applications in the Measurements menu. In this menu are the programs used to make analysis on site or when you need to make additional measurements during Route. From Main menu select Measure. The following measurement applications are included in the instrument when delivered: (for detailed description see the specified application section) Figure 7-1: Measure Selection... - Page 50 Process With the Process application any process parameter with the physical range of 1 to 5 V DC or 4 to 20 mA may be measured(Page no691). Phase In Phase application you can measure the Amplitude and Phase of the vibration using 1 or 2 vibration sensors and a speed sensor.
-
Page 51: Upgrade Measurements
X5 MkII™ with additional programs. VMI continuously develop analyzing programs for your instrument, check VMI download page for information on available programs. Below are some examples of programs to upgrade your VIBER X5 MkIII™: Synchronous Averaging This application is useful to reduce background noise in spectra of complex signals. - Page 52 7.2.1. Total Value Settings When you select Total Value, the program displays the settings menu. The following parameters can be set: Measurement type (Acceleration, Velocity, Displacement or mV) Show Unit (depending on the measurement type, Figure 7-3: Total Value Settings selected above) ...
-
Page 53: Bearing
(F3) - Change the detection type (RMS, Peak or p-p); (F4) - Change the measurement settings. (UP)/ (DOWN) Arrow – Change audio volume (if enabled) The data collection may be temporary suspended by pressing the (AUX) key. To resume the measurement, just press again the (OK)key. -
Page 54: Bearing Condition (Bc)
7.3. Bearing Condition (BC) The bearing condition value is a sum average value, RMS value, of all high frequency vibrations in the set frequency interval. Figure 7-5: BC Selection This value is an acceleration average with the unit “g”. From Main menu select, Measure and Bearing Condition. 7.3.1. - Page 55 NOTE: High bearing condition values can appear at gear boxes, grinding machines, converting machines with cutters and similar machines without any bearing faults because these machines “naturally” produce high frequencies and the bearing condition value can be misinterpreted. Try to measure when the machine is unloaded. If the selected frequency band includes low frequencies, the bearing condition value would include vibrations from unbalance, misalignment etc, and not purely from bearing vibrations and would therefore be difficult to interpret.
- Page 56 7.3.3. Measuring Bearing Condition The BC screen, when using two transducers, is presented in Figure 7-8. To the right side of the value, a bar graph indicates the measurement stability. On the left side of the screen are shown details regarding: Figure 7-8: BC Measurement ...
-
Page 57: Spectra
7.4. Spectra This measurement displays a spectrum (chart) of the frequencies at which the machine component is vibrating, and the amplitude of the vibration at each of these frequencies. From the Main menu select, Measure and Spectra. Figure 7-9: Spectra Selection Or From Main menu select, Measure, Advanced and Spectra. - Page 58 Speed Measurement(Enabled, Disabled) Measure BC(Enabled, Disabled) NOTE: The menu has a scroll bar on the right side indicating that it may display many items. Use (UP)/ (DOWN) arrows to get all the items All settings in this menu are automatically saved and will appear as preset values the next time this window is opened.
- Page 59 Move the cursor using the (LEFT) and (RIGHT)Arrow keys. When pressing the key once the cursor will move one line at a time, when keeping the key pressed the cursor will move fast 10 lines at a time. Zoom in or out the X-Scale, using the (Ctrl)+ (LEFT) Arrow or (Ctrl)+ (RIGHT)Arrow key combination.
-
Page 60: Envelope
downloaded to the SpectraPro® database or it may be shown locally. Add notes to be saved in analysis file along with spectra. Enter Help menu Introduce manually a speed value (the value will be saved in the file) ... - Page 61 If the pitch diameter of the first gear wheel doesn’t have the same centre as the shaft centre, the distance between the teeth on both wheels will change with a corresponding change in the transfer force. Shaft speed fluctuations Shaft speed fluctuations Gear mesh The signal contains one stabile signal...
- Page 62 This is called the ENVELOPE spectrum. When we want to see the fluctuations of high frequencies, it’s better to use the unit “g” (acceleration), because the acceleration signal increases in signal level, when the frequency increases. Envelope signals have their own unit “gE” (Envelope acceleration). The level of an envelope signal depends more on how much fluctuations a certain fault can create on the original signal and not on the seriousness of the fault itself.
- Page 63 You can measure envelope for one or two channels. When the parameters in the settings menu are set to the Figure 7-17: Envelope Measurements desired values, attach the transducers on the measuring point. If speed is enabled, you must attach a tachometer. Press (OK) to continue.
- Page 64 Envelope value gE RMS Replace Failing Fair Acceptable 0.01 Good 0.001 1000 2000 3000 4000 5000 10000 Figure 0-1: Envelope Value...
-
Page 65: Temperature
7.6. Temperature In the Temperature menu, you can as an example measure the bearing house temperature (or any other surface temperature) with the built-in infrared temperature sensor. Figure 0-2: Temperature Selection From Main menu select Measure and Temperature. 7.6.1. Temperature Settings Table 0-1: Emissivity Factors Figure 0-3: Temperature Settings Material... -
Page 66: Speed
7.6.2. Measure Temperature Direct the IR temperature transducer towards the surface you want to measure, a red laser dot will guide you. Keep a distance of approximately 200-500 mm (8- 20 inches) between the instrument and the object. Reduce the distance between the object and the instrument in accordance with the surface size. - Page 67 7.7.1. Speed Measurement Settings When you select Speed from measurements menu the instrument will display the settings menu. In the setting menu, the following parameters can be set: Unit (Hz or RPM) Figure 0-6: Speed Settings Number of Revolutions/Pulses – Number of shaft revolutions for each pulse of the speed transducer.
-
Page 68: Phase
7.8. Phase In the Phase menu, you can measure Amplitude & Phase using 1 or 2 vibration sensors and a speed sensor. From the Main menu select Measure and Phase. Figure 0-8: Phase Selection The Phase application can help you diagnosing machine faults such as for example resonance, misalignment, looseness and soft foot. - Page 69 (F2) – Change vibration detection (RMS, Peak or Peak- Peak) (F3) – Change unit for vibration measurement (F4) - Access the Phase Settings menu. The data collection may be temporary suspended (Hold) by pressing the (AUX) key. To resume, press the (OK) key.
-
Page 70: Coast Up
7.8.4. Measure Process The physical range of the process measurement must be 1 to 5 V DC or 4 to 20 mA. The process cable should be connected to the VIB 2 input. If you intend to measure the current, you have to place a Figure 0-13: Process Measurement resistor of 250 Ohm (0.1%) in parallel with the signal input. - Page 71 7.9.1. Coast Up Measurement Settings When you select Coast Up from measurements menu the instrument will display the settings menu. In this menu, the following parameters can be set: Measurement type (Acceleration, Velocity, Figure 0-15: Coast Up Settings Displacement or mV) ...
-
Page 72: Coast Down
the phase in degrees, on Y-axis. Once the measurement is started, the Instrument will automatically stop when the maximum speed is reached. You can manually stop (HOLD) the measurement by pressing (F3). In HOLD mode, you may: Change the displayed channel, by pressing (F1). - Page 73 By pressing (F4), all the parameters will be set to a default value. The function keys have the following shortcuts: (F1) – enters Select Sensor menu (F2) – enters Transducer Settings menu In addition to the above settings the instrument will automatically disable the energy saving function automatic shutdown if this is enabled.
-
Page 74: Orbit
7.11. Orbit The Orbit (XY Shape) Measurement will display a diagram of X value versus Y value, using two measurement channels. From Main menu select Measure, Advanced and Orbit. The measurement requires 2 transducers of same type Figure 0-20: Orbit Selection connected to the VIB 1 and VIB 2 inputs. - Page 75 (F1) - Assign channels menu (F2) – Sensor choice menu By pressing (F4), all the parameters will be set to a default value. When the parameters were set to desired values check that the transducers are connected and press (OK) to continue.
- Page 76 The XY Shape file is in binary format and has the extension .mv7. If you have saved an XY measurement in your instrument the file is located under the XY Shape folder in the VIBER X5 MkIII™ SD card. Send graph to MS Word This action will send the graph plots to a MS Word document file.
-
Page 77: Data Logger
7.12. Data Logger In the Data logger menu group, the Instrument continuously measures the vibration total value for 1 or 2 channels and stores the results in a file at a specified time interval. Figure 0-25: Data Logger Selection From Main menu select Measure and Data Logger. The resulting file may be analyzed in a computer using the X5 Logging application delivered together with VIBER X5 MkII™, see X5 Logging Application section below. - Page 78 Time to stop (mins) Max. record count - Maximum number of data samples. Frequency Unit (Only for Phase) – Set your phase frequency unit Store on speed change (Only for Phase) – Enable to save data if a change of speed occurs (F1) –...
- Page 79 The window has on the bottom a series of buttons, which allow the following actions: OPEN Open a VIBER X5 MkIII™ logging file. The logging file is in binary format and can’t be viewed directly. Any logging file has the extension .mv5.
- Page 80 EXIT Close the application and all opened files. PRINT PREVIEW Display the data in print preview mode. EXIT Exits to main page When View option is selected, the program will display all the values and the events recorded into the file in a window, from which you can print or preview the content. Figure 0-31: Print Preview...
-
Page 81: Vibshape
7.13. Vibshape The Vibshape™ function is mainly used to collect data for computer animation of machinery vibrations. Figure 0-32: Vibshape Selection From Main menu select Measure and Vibshape. The Vibshape™ function can also be used to measure coast-up on RPM controlled machines like steam turbines and frequency controlled motors. - Page 82 Note! If you are entering a multiple value, for example 1/3 = 0.33, this is not an exact multiple or division of the speed and the phase reading will slowly change (rotate). This will occur because the internal instrument speed is not exactly the same as the rotation speed.
- Page 83 Add notes Re- measure a point: Select the point you would like to re-measure with the (UP) (DOWN) arrow key. You may put the cursor on either multiple 1 or 2, the program will select both multiplies, there after enter (MENU) key menu and select Re- measure.
- Page 84 7.14. Advanced Measurements This menu contains applications with extended setting possibilities or special measurements and is intended for advanced users. It is found in the Measurement Menu. The following Advanced Functions and settings are designed to allow in-depth analysis of a machines vibration spectrum: Spectra –...
- Page 85 respect to the forward rotating rotor. As a result, the backward field induces an electromagnetic field and current in the stator winding. This can be seen as the lower sideband of slip frequency. The Upper side band is created by torque pulsation at twice slip frequency due to current variations in the stator windings caused by the lower sideband.
- Page 86 As you can see in the example the upper and lower sidebands present in the bottom picture at 23hz from the motors frequency are have an amplitude of 53.9dB. They are caused by shorten turns in the stator which produce magnetic variations in the rotating field similar to the effect on the rotor when it has broken bars.
- Page 87 The 2 pictures demonstrate how Full Range can be useful when analyzing a wide range of motor faults. It is always beneficial to observe the entire spectrum of a motors current signature when considering possible causes of malfunction. The bottom display is showing a fault condition at a frequency far from the operating frequency.
- Page 88 Sync Spectra This function synchronize spectra readings, to the machine speed, so these vibrations will be prominent. Refer to 7.4 for more information on setting up the Viber X5 MkII for Spectra readings. A synchronous spectrum means that the digital sampling of the measured signal starts each time the tachometer sends a signal to the device.
- Page 89 The pressure section in a paper machine involves the suction roll, the pressure roll and the felt. By measuring three separate synchronous spectrum with the tachometer placed on the three parts, the two rollers and the felt, you can find the source of the vibration and also measure when patterns occur in the felt, because each of the three spectra will only show vibrations synchronous with their own speed.
- Page 90 Loop Power The Loop Power function gives the VIBER X5 MkIII™ compatibility with installed 4-20mA Loop Power Monitoring systems. In this menu you can adjust the settings to meet your requirements by changing the Shown Units, Range Hi, Averaging, No of Averages, 24V Power and the Load Resistance Ω...
- Page 91 Bump Test In this menu you can change the Measurement Type, Shown Units and the Detection Type, how the “Bump” is detected. When conducting a Bump Test we strike the machine to cause an amplification of the resonant vibrations, by measuring these oscillations we can gain an understanding of the machines resonance.
- Page 92 The time between the cursors is inverted to the frequency resolution according to the formula: �� =1/�� ���� ������ In our example above the time is 2000ms or 2 s. According to the formula it will give a frequency resolution of ½=0,5Hz. Zoom cursor (F2) will show the time signal zoomed around the cursors and will give you a possibility to fine adjust the time area.
- Page 93 Press Ctrl+left or Ctrl+right to change the displayed frequency range. Use left or right buttons to move the cursor. Use up or down buttons to change the amplitude scale Use the waveform button to go back and change resolution and time area.
-
Page 94: Balancing
From Main menu select Balancing. With the Balancing application in VIBER X5 MkIII™ you can perform 1 or 2 plane balancing. This application is optional. -
Page 95: Balancing Theory
12 ����/�� This is called the unbalance sensitivity of the machine and depends on the stiffness of the machine and on the shaft speed. The VIBER X5 MkIII™ stores this unbalance sensitivity with the name Response matrix. To balance a vibration of 7 mm/s we only have to multiply the vibration with the unbalance sensitivity: 7 mm/s x 3.58 grams / mm/s = 25 grams... -
Page 96: Balancing Settings
8.3. Balancing Settings Balancing settings are the same for both 1 plane and 2 plane balancing. The settings made in this menu will apply to any balancing session (New or Ongoing) there after regardless if it is 1 or 2 plane until you change the settings. In Balancing Settings you can set the following: Figure 8-3: Balancing Settings ... -
Page 97: Iso 1940-1 Settings
8.4. ISO 1940-1 Settings In this menu you enter: The applicable ISO Quality Grade. See Grades for information about the different grades. Note! The Operating speed is the maximum speed the rotor will ever reach in normal operation and not the balancing speed you have selected for the moment. ... -
Page 98: Iso 1940 Balance Quality Grades
When you enable ISO 1940, VIBER X5™ will also suggest a suitable trial weight depending on the rotor weight and radius you enter. You must however still write the weight and position of the “real” trial weight you have mounted in the machine. The calculated trial weight can have large errors and gives only a hint of the size of the weight. -
Page 99: Balancing Window Description
(gasoline or diesel) for cars, trucks and locomotives. G 250 Crankshaft/drives of rigidly mounted fast four-cylinder diesel engines. Parts of a machine are normally balanced to one quality class lower than the whole machine. Example: A complete fan is normally balanced to Q6.3 but if we balance only the fan wheel we have to balance down to Q2.5. - Page 100 Press the (MENU) key when you want to: Add notes to the balancing file Save the session View the balancing report Access Help for balancing Save the screen in a picture file If you enabled Auto save measurement in the settings menu, the instrument will save the measurement automatically if the Speed is in tolerance or if maximum number of averaging samples is reached, otherwise you press (AUX) key to save the measurement in each...
- Page 101 Warning! Forcing the instrument to save means that you are accepting very unstable measurements. This can later cause errors in the calculated balancing weights. The purpose of mounting a trial weight in plane 1 is to measure how much this weight is changing the vibration vector in measuring point 1 but also to measure how much the vibration is changing in measuring point 2.
-
Page 102: Edit Trial Weight
place the weight and the radius (for both 1 and 2 plane) by selecting the value to be edited with (UP) or (DOWN) Arrow key pressing (F3), the weight (and position) will be recalculated for the new values. If you edit the balancing weight radius for either 1 or 2 plane the weight for the angle position displayed in the Vib 1 and Vib 2 info window be recalculated for the new values. -
Page 103: Balancing Report
Number of positions (Weight distribution): With this function the instrument distributes the balancing weight to evenly distributed positions. This eliminates the need of angle measurements in the rotor. For example if a fan has 12 blades then number the blades from 1 to 12, and write the number 12 in the setting for Number of positions. -
Page 104: Residual Unbalance
8.9. Residual unbalance What is a residual unbalance? If we place a large weight in the shaft centre we do not get an unbalance. The radius from the shaft centre is also important. The residual unbalance in VIBER X5 MkII™ is always the product of the unbalance weight times the radius and has often the unit gram/mm = gram millimeter. - Page 105 vibration angle is 38 degrees then the value b11= 38 in the response matrix. The values a11= and b11= goes together as all previous readings with vibration and angle. The response matrix is saved together with all other information when the balancing session is saved.
-
Page 106: Balancing Files Viewer
MkIII™ Analyzer, used to visualize VIBER X5 MkIII™ Balancing files on a computer. The program is located under the PC Application folder in the VIBER X5 MkIII™ SD card when the instrument is delivered. When the instrument is connected to the PC through the USB cable select PC Application folder, copy the setup file to your preferred location on your computer and install the software, you are now ready to use it. - Page 107 Figure 8-18: Edit Header Window When you select Edit Header, a dialog window will appear allowing you to edit it. The following items may be edited: Company name Company details-Line 1,2 and 3 Company logo - You can add any picture file in the dedicated area. The following part of the Balancing Report can be added or excluded: ...
-
Page 108: Instrument Maintenance
The connectors and cables for the VIBER X5 MkIII™ have been selected to be as robust and reliable as possible, even so it is good practice not to bend the cables or pull them when loosening the transducer magnet. -
Page 109: Power Saving Good Practice
Red - The battery temperature is too high and the charger has stopped the charging process. The charger still supplies the Instrument. Normally when the battery temperature decreases, the charging process continues. There is no need to remove the charger. The charging process should be allowed to continue until the battery is fully charged (100%). -
Page 110: Trouble Shooting
If the LED sequence is normal but still the display is empty it may be a display fault. Please contact a VMI serivce center. The instrument Attach the charger. The instrument has a power management system... - Page 111 If the device is not published or appears as an unknown device, there is an SD card controller error.Pleace contact a VMI service center. If the device is published (appears in Control panel) but cannot be handled as a disk, it is a problem with the SD card, which is either not formatted or defective.
- Page 112 Battery charger Symptom Action Cause The charging is stopped Disconnect battery Look at the charger symbol on the status bar. If it before the battery is charger. Wait 5 is red one of the following problems caused the fully charged. seconds.
- Page 113 The instrument display at You should contact your Factory data is a set of parameters which every start the message VMI distributor to solve describe the hardware revision of the "Invalid factory data! The this problem. instrument, serial number, battery pack system will load defaults.
- Page 114 Thereafter enter again into the If you still have the same problem, you may put the application instrument OFF and try to use PC operation system utilities to fix the file or contact a VMI service center.
-
Page 115: Technical Specification
Size & Resolution 480x272 pixels Display Colours 65536 All standard ICP accelerometers (4mA/24V), velocimeters or general VMI default transducers AC Inputs purpose AC transducers in range 0-8V are automatically detected RMS. Auxiliary inputs with range 0-30V RMS. Signals In/Out DC Inputs... - Page 116 11.1 Accelerometers Cable connector Vibration transducer, with built in amplifier Internally shielded and case isolated. Measuring direction Technical specifications for VMI192 Sensitivity (+/-10%) 100mV/g Frequency response (±3dB) 0.4–13000Hz (±10%) 1.0-9000Hz Dynamic Range ±80 g, peak M6 pin Sensing Structure Shear Mode bolt Internal resonance 26000Hz...
-
Page 117: Index 1167
12.0 Index Date and time ............12 Delete a file ..............25 Detection type ............36 Display ............... 17 Application ..............22 Application Selection ..........14 Arrows ................ 10 Audio amplifier icon ........... 12 Audio amplifier status ..........12 Edit a numeric value ..........14 Auto ................ - Page 118 ISO standard ............... 42 Power Saving .............. 97 Power supply .............. 20 Process ............... 64 Program version ............16 Kaiser-Bessel............... 38 Keep trial weight after run ......... 91 Key ................10 Keypad ..............9, 17 Rectangular ..............38 Keypad LED’s............... 10 Red LED ..............
- Page 119 View a file ..............25 Window ..............37 Windows Explorer ............28 Unbalance sensitivity ..........83 Virtual Keyboard ............15 Unit system ..............18 VMI192 ................ 8 Update ............... 22 XY Shape PC Application ..........70 Vibshape ..............75...
-
Page 120: Declaration Of Conformity
Vibration Measurement Instrument International AB(VMI) Warranty disclaimer VMI warrants the products to be free from defects in material and workmanship under normal use and service within two years from the date of purchase and which from our examination shall disclose to our reasonable satisfaction to be defective. - Page 121 VMI International AB E-mail: info@vmiab.com www.vmiab.com...
Need help?
Do you have a question about the VIBER X5 MKIII and is the answer not in the manual?
Questions and answers