Tektronix RSA306 Self Help Manual
Usb spectrum analyzer
Hide thumbs
Also See for RSA306:
- Technical reference (69 pages) ,
- Installation and safety instructions (24 pages) ,
- Quick start manual (8 pages)
Table of Contents
Advertisement
Advertisement
Table of Contents

Related Manuals for Tektronix RSA306


Summary of Contents for Tektronix RSA306
- Page 1 Tektronix RSA306 USB Spectrum Analyzer Self-Guided Demo *P071333000* 071-3330-00...
- Page 3 Tektronix RSA306 USB Spectrum Analyzer Self-Guided Demo Revision A www.tektronix.com 071-3330-00...
- Page 4 Tektronix. All rights reserved. Licensed software products are owned by Tektronix or its subsidiaries or suppliers, and are protected by national copyright laws and international treaty provisions. Tektronix products are covered by U.S. and foreign patents, issued and pending. Information in this publication supersedes that in all previously published material.
-
Page 5: Table Of Contents
Fundamental operations of spectrum analyzers ..................Real-time DPX ............................Modulation ..............................EMI spurious search ..........................Over-the-air demo ............................ Setup ................................Demo instructions Demo 1: Basic spectrum measurements with markers ................Demo 2: Power measurements with markers ....................RSA306 Self-Guided Demo... - Page 6 ................ Demo 7: Analog modulation analysis ......................Demo 8: Digital modulation analysis ......................Demo 9: EMI spurious ..........................Demo 10: FM listening (Demo board not needed) ..................Demo 11: ISM band DPX (Demo board not needed) ................... RSA306 Self-Guided Demo...
- Page 7 Introduction With this guide, you will explore what you can do with the RSA306 USB spectrum analyzer. Applications range from simple frequency / amplitude measurements of RF signals to real-time and modulation analysis that provide you with a complete system view of your device under test.
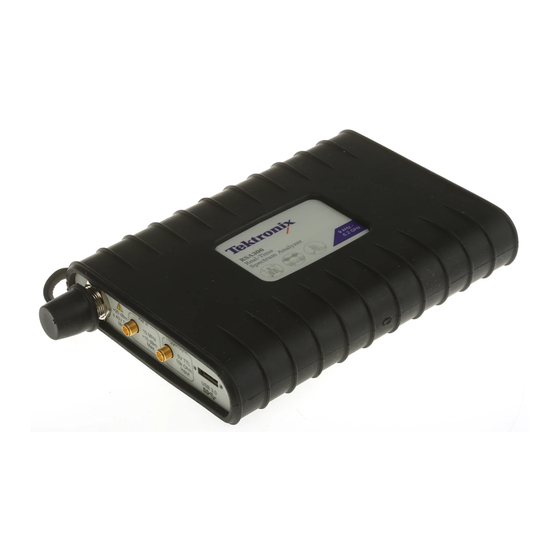
- Page 8 Introduction Check list for the demo Before beginning the demo, please be sure you have the following items: Item Illustration RSA306 USB spectrum analyzer RTSA demo board RSA306 Self-Guided Demo...
- Page 9 Introduction Item Illustration USB Y-cable (to power the board) N-BNC adapter Whip antenna RSA306 Self-Guided Demo...
- Page 10 Introduction Item Illustration BNC cable USB 3.0 cable RSA306 Self-Guided Demo...
-
Page 11: Introduction
Fundamental operations of spectrum analyzers The Tektronix RSA306 USB Signal Analyzers have the ability to perform basic spectrum measurements that most Spectrum Analyzer users are already accustomed to. The goal of this part is to demonstrate that the instrument has these basic spectrum analyzer capabilities. -
Page 12: Real-Time Dpx
Analog modulation is the most fundamental modulation method, and is frequently used to demonstrate principles in education labs. ■ Demo 7: Analog modulation analysis Demo 8: Digital modulation analysis ■ RSA306 Self-Guided Demo... -
Page 13: Emi Spurious Search
This part shows how to use the RSA306 in off-air applications. Using the whip antenna provided with the RSA306 demonstration kit, you can demodulate and listen to the signals from the local FM broadcasting station, see the realtime spectrum of the signals in the ISM band created by your smart phone, and use the RSA306 in interference- hunting. -
Page 14: Setup
After you’ve completed the demo and have gained an understanding of how the RSA306 operates, connect to your own system and see how the RSA306 can help in your day-to-day work. - Page 15 Introduction 4. Connect the RSA306 to the demo board ■ Connect one end of the BNC cable to the RF port of the RSA306. ■ Connect the other end of the BNC cable to the RF port of the board.
- Page 16 Introduction SetUpDiagram RSA306 Self-Guided Demo...
-
Page 17: Demo Instructions
When using a spectrum analyzer, one of the first settings is that of the frequency. In this demonstration, we will use markers to locate the CW signal generated from the demo board, and set the appropriate frequency for the measurement. RSA306 Self-Guided Demo... - Page 18 1. Press the On button to turn on the demo board. 2. Set the reference to INT (internal reference). 3. Set the run mode to FREE RUN. 4. Click the ROW and COLUMN buttons to select CW as the signal to generate. demoboard1 RSA306 Self-Guided Demo...
- Page 19 Demo instructions Instructions for the RSA306 1. Double click the SignalVu-PC icon on the PC desktop to start the application. screenicon 2. Click Live Link on the menu bar to view the drop down menu. Click Search for Instrument. A notification will briefly appear stating that the instrument was found.
- Page 20 It is green ( ) when an instrument is connected. It is red ( ) when it is not. You can also view the name of the instrument that is connected by hovering the mouse indicator over the RSA306 Self-Guided Demo...
-
Page 21: Rsa306 Self-Guided Demo
Demo instructions 5. Click the Preset button. preset 6. Click the settings button to display the settings control panel. topleft 7. Click Max Span to set the Span to the maximum value. maxspan RSA306 Self-Guided Demo... - Page 22 Marker to peak. TIP. Right Click on Tablet Touch the screen where you want to right-click, hold until a complete square appears, and then lift your finger. The shortcut menu appears after you lift your finger. markertopeak RSA306 Self-Guided Demo...
- Page 23 Activate the on-screen numeric entry of values and Up/Down controls by selecting View: Numeric Keypad. When the Numeric Keypad view is activated, up/down arrows and a numeric keypad icon will pop up whenever a field requiring input is selected. RSA306 Self-Guided Demo...
- Page 24 Selecting the 'calculator' numeric keypad icon will pop up a numeric entry box. 9. Click To Center in the bottom marker setting area. This sets the center frequency of the analyzer to the center of the signal. tocenter1 RSA306 Self-Guided Demo...
- Page 25 Demo instructions 10. Set the Span to 40 MHz. setspan 11. Click Peak. 12. Click To Center again. tocenter2 RSA306 Self-Guided Demo...
- Page 26 The amplitude and the frequency of the reference marker (MR). ■ The amplitude and the frequency of the selected marker (M1). ■ The difference (ΔM1) between the selected marker position and the position of the reference marker. RSA306 Self-Guided Demo...
- Page 27 Demo instructions 14 14 14 Demo1-Step13 RSA306 Self-Guided Demo...
- Page 28 . This will give you the correct amplitude, frequency, span and marker settings Files/Example Files automatically. This file also contains data collected from a previous test and creates a trace on screen of the result. Press Run to clear this data and take results from your instrument. RSA306 Self-Guided Demo...
- Page 29 TIP. RBW The resolution bandwidth (RBW) determines the fast Fourier transform (FFT) bin size, or the smallest frequency that can be resolved. Smaller RBW improves the selectivity, but degrades the sweep speed and the trace update rate. RSA306 Self-Guided Demo...
- Page 30 Demo instructions 16. Select Options from the Tools menu. 17. Under the Prefs tab, set the Color Scheme to Blizzard. blizzard RSA306 Self-Guided Demo...
- Page 31 Demo instructions TIP. Ink Saver Mode You can print screen images with a white background. Selecting the scheme color to Blizzard makes the background color changes from black to white in the graphs. Demo1Step16Note RSA306 Self-Guided Demo...
-
Page 32: Demo 2: Power Measurements With Markers
Instructions for the demo board 1. Keep the same setting as the last demo. Use the ROW and COLUMN buttons to change the signal type from CW to OFDM. odfm RSA306 Self-Guided Demo... - Page 33 Demo instructions Instructions for the RSA306 1. Keep the same setting as the last demo, or recall the setting . Click the Stop button to pause Demo1_CW.tiq the measurement. 2. Drag the marker reference (MR) on left side, and marker 1 (M1) on right side of the OFDM spectrum.
- Page 34 Demo instructions 3330Demo2Trace RSA306 Self-Guided Demo...
-
Page 35: Demo 3: Traces And Detectors
This demo familiarizes you with the trace detection and function controls available in SignalVu-PC used with the RSA306. Instructions for the demo board 1. Keep the same setting (OFDM signal) as the last demo. Demo3OFDM Instructions for the RSA306 1. Keep the same setting, or recall the setting Demo2_OFDM_marker.tiq. Click Run. Demo3Step1 RSA306 Self-Guided Demo... - Page 36 Demo instructions 2. Right click the screen, and select All markers off. Demo3Step2 3. Click the settings button to display the Settings control panel. Demo3Step3 RSA306 Self-Guided Demo...
- Page 37 4. In the Traces tab, select Trace 1, and then set Detection to Avg (VRMS) and Function to Avg (VRMS). Demo3Step4 5. Select Trace 2, and then set Detection to +Peak, Function to Max Hold, and enable Show. Demo3Step5 RSA306 Self-Guided Demo...
- Page 38 Demo instructions 6. Select the trace to Trace 3, select Detection to -Peak, Function to Min Hold, and enable Show. Demo3Steps RSA306 Self-Guided Demo...
- Page 39 Trace functions are applied to multiple traces as they are displayed. Available settings are Normal, Average, Max Hold, and Min Hold. The Number of Traces setting specifies how many traces are averaged. The same selections are available in the upper left display selection and mouse-over dropdowns. RSA306 Self-Guided Demo...
- Page 40 Min Hold trace displays the minimum value in the trace record for each display point. Each new trace display point is compared to the previous minimum value and the lesser value is retained for display and subsequent comparisons. RSA306 Self-Guided Demo...
- Page 41 Demo instructions RSA306 Self-Guided Demo...
- Page 42 Marker to peak Moves the selected marker to the highest peak. If no marker is turned on, this control automatically adds a marker. Add marker Defines a new marker located at the horizontal center of the graph. RSA306 Self-Guided Demo...
-
Page 43: Demo 4: Save And Recall
Instructions for the demo board 1. Keep the same setting (OFDM signal) as the last demo. Demo3OFDM Instructions for the RSA306 1. Keep the same setting, or recall the setting Demo3_OFDM_trace.tiq. Select Save As from the File menu to open the Save As dialog box. - Page 44 2. Navigate to the folder where you want to save the setups, or use the default location. Enter a file name. Select the type of file to Acq data with setup (TIQ)(*.tiq). Demo4-2 3. Click save. Demo4-3 RSA306 Self-Guided Demo...
- Page 45 5. Select Recall from the File menu to open the Open dialog box. Navigate to the folder containing the file you want to recall. Select the .tiq file you just saved to recall, and click the Open icon RSA306 Self-Guided Demo...
- Page 46 Saves a trace for later recall into the display from which it was saved. Data (TIQ/CSV/MAT) Saves data and measurement setup for analysis later (TIQ format) or as data to use with external software in either CSV (comma-separated value) or MAT (MATLAB) formats. RSA306 Self-Guided Demo...
-
Page 47: Demo 5: Dpx And Transient Capture
The DPX display reveals transient signal behavior that helps you discover instability, glitches, and interference. Instructions for the demo board 1. Keep the same setting as the last demo. Use the ROW and COLUMN Demo5InfHop buttons to change the signal from OFDM to Inf Hop (Infrequent hopping signals). RSA306 Self-Guided Demo... - Page 48 Demo instructions Instructions for the RSA306 1. Keep the same setting, or recall the setting Demo3_OFDM_trace.tiq. Click the Display icon. Demo5-Step01 RSA306 Self-Guided Demo...
- Page 49 2. In General Signal Viewing, select DPX from the Available displays box. 3. Click the Add button (or double-click the DPX icon). This will add the DPX icon to the Selected Displays box. 4. Click the OK button. Demo5-Steps2-4 RSA306 Self-Guided Demo...
- Page 50 6. Select the Split view. You can see the hopping signals displayed in the DPX spectrum, and compare it in the standard spectrum display on the right side. Note that the standard spectrum display nearly or always misses the transient signal. RSA306 Self-Guided Demo...
- Page 51 Demo instructions Demo5-Step6 RSA306 Self-Guided Demo...
- Page 52 TIP. Changing the color scheme In the “temperature” palette, the highest color (Maximum) is deep red and the lowest (Minimum) is dark blue. Values between Maximum and Minimum are represented by the other colors of the palette. RSA306 Self-Guided Demo...
- Page 53 8. Under the Bitmap Scale tab, set the Max scale to 3% for the DPX Spectrum display. Demo5-Step8 9. Under the Ampl Scale tab, set the Min color scale to -80 dBm for the DPXogram display. Demo5-Step9 RSA306 Self-Guided Demo...
- Page 54 1.25 s, or the hop occurs every 1.25 second. 12. You can set the size of the DPX spectrogram by selecting the divider bar between the displays and moving it up or down to add area to the display of interest. RSA306 Self-Guided Demo...
- Page 55 Demo instructions Demo5-Step11-12 RSA306 Self-Guided Demo...
- Page 56 RBW, and FFT length. You can use the POI time value to determine if you are at risk of either missing a narrow transient or of its captured amplitude being less than the actual signal. The minimum 100% POI for RSA306 is 100 μs. RSA306 Self-Guided Demo...
-
Page 57: Demo 6: Transient Capture - Mask Test And Act On Violation
Instructions for the demo board 1. Keep the same setting (Infrequent Demo6-InfHop hopping signals) as the last demo. Instructions for the RSA306 1. Keep the same setting, or recall the Demo6-1 setting Demo5_DPX.tiq. Click Run. RSA306 Self-Guided Demo... - Page 58 Demo instructions 2. Under the Tools menu, click Mask Test…. Demo6-step02 3. Select DPX: Trace1 from Search in:. 4. Select is outside mask from Test for:. 5. Click Edit limits… to open the Mask Test Editor. Demo6-3-4-5 RSA306 Self-Guided Demo...
- Page 59 The margins between the mask and the reference trace can be specified by X Margin and Y Margin. ■ The points can be added, edited, or deleted. ■ You can also create a Frequency Mask by using the manual method. RSA306 Self-Guided Demo...
- Page 60 Demo instructions Demo6-6-7-8 RSA306 Self-Guided Demo...
- Page 61 Demo instructions 9. In the DPX display, and click the settings button. Demo6-9 10. Select Trace1 as the Trace under the Traces tab. Demo6-10 RSA306 Self-Guided Demo...
- Page 62 12. Under the Actions tab, select Beep, Save acquisition data, Save trace, and Save picture. 13. Click Enable Test. When a mask violation is detected, the system will sound a beep, and save all your selected format of files into the selected folder automatically. RSA306 Self-Guided Demo...
- Page 63 Replay mode, it can sound a beep and stop analyzing. ■ Files can be saved in the native format of SignalVu-PC (.tiq), or in comma separated variable (.CSV) or Matlab level 5 (.MAT) formats. ■ The folder for saving files can be selected from Save as…. RSA306 Self-Guided Demo...
- Page 64 Demo instructions Demo6-12-13 RSA306 Self-Guided Demo...
-
Page 65: Demo 7: Analog Modulation Analysis
Analog modulation is the most fundamental modulation method. The analog modulation analysis feature in the RSA306 series provides measurements to demodulate and analyze amplitude modulation (AM), frequency modulation (FM), and phase modulation (PM). This example shows how to analyze an FM signal with the RSA306. Instructions for the demo board 1. - Page 66 Demo instructions 2. Click the Display button. Demo7-Step2 RSA306 Self-Guided Demo...
- Page 67 3. In General Signal Viewing, select DPX from the Available displays box. 4. Click the Add button. This will add the DPX icon to the Selected Displays box (and remove it from the Available displays box). Demo7_Steps3-4 RSA306 Self-Guided Demo...
- Page 68 Available displays box. 6. Click the Add button. 7. Click the OK button. TIP. Selecting displays You can also double-click the ■ desired display to add or remove ■ Five application presets are available for the display selection. Demo7_5-6-7 RSA306 Self-Guided Demo...
- Page 69 Demo instructions 8. Select the DPX display by clicking anywhere on it with the mouse, and set the CF to 2.445315 GHz and the Span to 500 kHz. Demo7-Steps3-8 9. Click the Analysis control button. Demo7-9 RSA306 Self-Guided Demo...
- Page 70 Demo instructions 10. Under the Analysis Time tab, set the Analysis Length to 10 ms. Demo7-10 11. Click the FM display, and then click the settings button. Demo7-11 RSA306 Self-Guided Demo...
- Page 71 Measurement BW to 200 kHz. Demo7-12 NOTE. FM measurements readout ■ +Pk: positive frequency deviation ■ –Pk: negative frequency deviation ■ RMS: RMS value of the deviation ■ Pk-Pk: peak-to-peak frequency deviation ■ Pk-Pk/2: peak-to-peak frequency deviation divided by two RSA306 Self-Guided Demo...
- Page 72 Demo instructions RSA306 Self-Guided Demo...
-
Page 73: Demo 8: Digital Modulation Analysis
I & Q signals, EVM, Phase Error, Magnitude Error, and more. This example shows how to demodulate a QPSK signal with RSA306. This demonstration also introduces the concept of application presets to quickly set up for complex analysis tasks. This demonstration relies on the optional modulation analysis capabilities of SignalVu-PC. - Page 74 Demo instructions Instructions for the RSA306 1. In the Presets menu, click application. Step1 RSA306 Self-Guided Demo...
- Page 75 Demo instructions 2. Select Modulation Analysis for the Preset. Step2 3. Click OK. Step3 RSA306 Self-Guided Demo...
- Page 76 To save setups so that they appear in the Application Presets window, save your setup in the folder C:\SignalVu- PC Files\User Presets. The saved setup will appear in the Application Presets window with the name you give the file. RSA306 Self-Guided Demo...
- Page 77 6. Under the Modulation Params tab, Select QPSK from the Modulation Type list, set the Symbol Rate to 3.072 MHz, set Measurement Filter to Root raised cosine, Reference Filter to Raised cosine, and Filter parameter to 0.35. Step6 RSA306 Self-Guided Demo...
- Page 78 The Reference Filter, while not used for demodulation, is important for making the proper error vector measurement calculations. This filter will normally be defined by the modulation/demodulation standard. 7. Click the Stop button. Step7 RSA306 Self-Guided Demo...
- Page 79 9. Drag the marker to any cell in the Symbol Table. This sets the marker (MR) time value to the starting time for the cell containing the marker. 10. Look for MR in the Constellation graph. Move the marker to different cells in the Symbol Table. RSA306 Self-Guided Demo...
- Page 80 Not only are all the displays correlated through the shared data set, but the markers, which are inherently correlated, make it very easy to see how a data point in one domain relates to a specific data point in any other. This can greatly reduce troubleshooting time. RSA306 Self-Guided Demo...
- Page 81 Demo instructions Demo8-QPSK RSA306 Self-Guided Demo...
-
Page 82: Demo 9: Emi Spurious
Demo 9: EMI spurious The spurious measurement in the RSA306 is set up to change limits vs. frequency, and antenna correction factors can be applied. Violations above the user-set limits are shown in red on the table. This example shows how to use the spurious display in SignalVu-PC and the RSA306 to perform EMI pre-compliance and diagnostics. - Page 83 Demo instructions 2. Click the Display button. Demo9-Step2 RSA306 Self-Guided Demo...
- Page 84 Available displays box. 4. Click Add to add the application to the Selected Displays list. 5. Select the Spectrum icon in the Selected Displays list. 6. Click Remove to clear the icon from the list. 7. Click OK. Demo9-Steps3-7 RSA306 Self-Guided Demo...
- Page 85 Demo instructions 8. Click the settings button. Demo9-Step8 9. In the Scale tab, select the Log scale to reset the display to show the frequency axis in a logarithmic scale. Demo9-Step9 RSA306 Self-Guided Demo...
- Page 86 Demo9-Steps10-12 gain/loss correction to the signal. 10. Under the Ranges and Limits tab, click Load to select the appropriate limit line and measurement condition. 11. Select FCC Part 15, Rad, Class A (10m).csv for this example. RSA306 Self-Guided Demo...
- Page 87 Demo instructions 12. A larger new resized window of range and limit table can be displayed by clicking Expand. You can edit the start and stop range, filter shape, RBW, VBW, detector, threshold and excursion, and limit line. RSA306 Self-Guided Demo...
- Page 88 Demo instructions After loading the spurious table, your display should look similar to the picture below. The green bar is the loaded limit line as standards suggest. RSA306 Self-Guided Demo...
-
Page 89: Demo 10: Fm Listening (Demo Board Not Needed)
You access the Audio Demod tab from the Settings control panel of the DPX Spectrum plot display. This Demo shows how to use the RSA306 to demodulate the local FM radio signals and listen to the programming. Instructions for the antenna 1. - Page 90 Demo instructions Instructions for the RSA306 1. Click the Preset button. 2. In the Spectrum display, set the CF to 97.75 MHz and the Span to 20.5 MHz. TIP. FM broadcasting Throughout the world, the FM broadcast band falls within the VHF part of the radio spectrum.
- Page 91 Demo instructions 4. Right click the screen, and click Marker to peak. 5. Click To Center in the bottom marker setting area. This sets the center frequency of the analyzer to the center of the signal. Demo10-Steps4-5 RSA306 Self-Guided Demo...
- Page 92 9. Adjust the Audio Gain setting so you can hear the demodulated signal. The sound level is also affected by the setting of the Windows volume control. 10. Click the Browse… button to select the location you want to save the steam file. RSA306 Self-Guided Demo...
- Page 93 The saved audio format is .wav, which can be played by Windows media player in your PC. The screenshot below shows the RSA306 is tuned to 91.5 MHz center frequency to listen the local FM broadcasting. Drag the marker to other spectrum peaks, center the peaks, and listen to the programming at other channels.
- Page 94 Demo instructions Demo10-Steps7-11 RSA306 Self-Guided Demo...
-
Page 95: Demo 11: Ism Band Dpx (Demo Board Not Needed)
Demo 11: ISM band DPX (Demo board not needed) The real time streaming of the RSA306 combined with the DPX processing of the SignalVu-PC software is designed to address the measurement challenges associated with dynamic RF signals such as the bursted packet transmissions of WLAN and Bluetooth. -
Page 96: Click The Preset Button
Demo instructions Instructions for the RSA306 1. Click the Preset button. 2. Click the Display button. Demo11-Steps1-2 RSA306 Self-Guided Demo... - Page 97 3. In General Signal Viewing, select DPX from the Available displays box. 4. Click the Add button. This will add the DPX icon to the Selected Displays box (and remove it from the Available displays box). 5. Click the OK button. Demo11-Steps3-6 RSA306 Self-Guided Demo...
- Page 98 2.4 GHz range (2400– 2483.5 MHz) spaced 5 MHz apart. Channels 1 (2412 MHz), 6 (2437 MHz), and 11 (2462 MHz) are the most common channels to choose, and most routers will use one of them as the default channel. RSA306 Self-Guided Demo...
- Page 99 Demo instructions 7. Select the Split view. Demo11-Step7 8. Set the RefLev to -40 dBm. Demo11-Step8 9. In the DPX display, and click the settings button. Demo11-Step9 RSA306 Self-Guided Demo...
- Page 100 Demo instructions 10. Under the Bitmap Scale tab, set the Max scale to 3% for the DPX Spectrum Display. Demo11-Step10 RSA306 Self-Guided Demo...
- Page 101 Demo instructions 11. Under the Ampl Scale tab, set the Max color scale to -40 dBm for the DPXogram Display. Demo11-Step11 RSA306 Self-Guided Demo...
- Page 102 Demo instructions 12. In the Traces tab, set the Dot Persistence to Infinite. Demo11-Step12 RSA306 Self-Guided Demo...
- Page 103 Check the DPX display to see if you can see the spectrum of the WLAN signals. If no signal, you can change the center frequency of the RSA306 to other channels. Demo11-Step13 RSA306 Self-Guided Demo...
- Page 104 In variable persistence mode, you specify a decay period that limits how long a point will be displayed. ■ In infinite persistence mode, once a point in the display has been written to, it will remain visible indefinitely. We start with infinite persistence because it ensures that all transients are kept on screen. RSA306 Self-Guided Demo...
- Page 105 DPX display, you can cause both uplink and downlink activity on your device by navigating to an “internet speed testing” webpage to test both the uploading and downloading speed, and monitor the DPX display of the RSA306 at the same time. RSA306 Self-Guided Demo...
- Page 106 Demo instructions 14. Turn the Bluetooth function Off, then On in your smart phone/tablet/PC while monitoring with the setup above. Demo11-Step14 RSA306 Self-Guided Demo...
- Page 107 Demo11-Step15 examine. 16. Right click the display, and click Add markers twice to add two markers. Then you can measure the distance between hops in frequency and time using the markers on the spectrogram. Demo11-Step16 RSA306 Self-Guided Demo...
- Page 108 Demo instructions The following screen shot shows the real time display in the RSA306. You can see a typical WLAN interchange between a nearby smart phone/tablet/PC and a more-distant network access point (AP). The smart phone/tablet/PC signal is nearly 30 dB stronger than the AP's signal because it is closer to the measurement antenna. At the same screen, you can also see the Bluetooth signals, and even the measurements of the time and frequency intervals between those hop signals.
- Page 109 Demo instructions RSA306 Self-Guided Demo...
- Page 110 Demo instructions RSA306 Self-Guided Demo...
Need help?
Do you have a question about the RSA306 and is the answer not in the manual?
Questions and answers