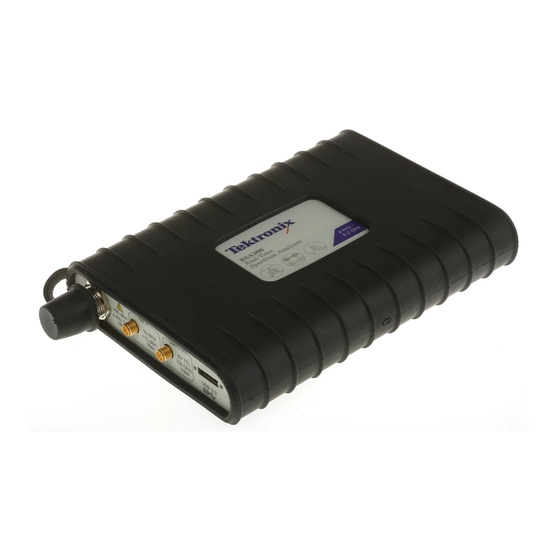
Tektronix RSA306 Quick Start Manual
Usb spectrum analyzer
Hide thumbs
Also See for RSA306:
- Self help manual (110 pages) ,
- Technical reference (69 pages) ,
- Installation and safety instructions (24 pages)
Advertisement
Tektronix RSA306 USB Spectrum
Analyzer
-
Simple Demos
The Demo of the RSA306 is easy. Even you do not have signal generators, devices under test, or demo
boards, using the whip antenna provided in box, you can demodulate and listen to the signals from the
local FM broadcasting station, or see the real-time spectrum of the signals in the ISM band created by
your smart phone, and show how the RSA306 can be used in interference-hunting. The pre-compliance
measurements of electromagnetic interference (EMI) are also easy to demo. This demo guide shows
how to use the RSA306 in off-air applications.
Over-the-air Demo:
The .tiq setup files are provided for each Demo. You can recall them if you have any problems with your
.
setup
1
Page 1
Page 2
Page 2
Page 2
Page 3
Page 4
Page 6
Advertisement
Table of Contents

Related Manuals for Tektronix RSA306


Summary of Contents for Tektronix RSA306
- Page 1 ‐ Simple Demos The Demo of the RSA306 is easy. Even you do not have signal generators, devices under test, or demo boards, using the whip antenna provided in box, you can demodulate and listen to the signals from the local FM broadcasting station, or see the real-time spectrum of the signals in the ISM band created by your smart phone, and show how the RSA306 can be used in interference-hunting.
- Page 2 For the initial exploration, a whip antenna has been provided to receive signals needed for the Demo. After you’ve completed the Demo and have gained an understanding of how the RSA306 operates, please feel free to connect to your own system and see how the RSA306 can help in your day-to-day work.
- Page 3 Demo Guide Installing SignalVu-PC SignalVu-PC can be downloaded from the Tektronix.com or included in the USB drive in the box. 1. Use Windows Explorer to navigate to the folder you extracted from the archive. 2. Double-click Setup.exe. Follow the on-screen instructions to install the software.
- Page 4 You access the Audio Demod tab from the Settings control panel of the DPX Spectrum plot display. This Demo shows how to use RSA306 to demodulate the local FM radio signals and listen to your programming.
- Page 5 Demo Guide Demo 2: ISM band DPX The real time engine of the RSA306 series is designed to address the measurement challenges associated with dynamic RF signals such as the bursted packet transmissions of WLAN and Bluetooth. Combo devices that use both Bluetooth and 802.11b/g/n WLAN networks have a unique set of RF interference problems because they share the same 2.4 GHz Industrial/Scientific/Medical (ISM) frequency...
- Page 6 Check the DPX display to see if you can see the spectrum of the WLAN signals. If no signal, you can change the center frequency of the RSA306 to other. Quick Tip: Wi-Fi Test mode To have a better observation of the WLAN activities in the DPX display.
- Page 7 RSA306 USB Real-Time Spectrum Analyzer Demo Guide Demo 3: EMI spurious The spurious measurement in the RSA306 is set up to change limits vs. frequency, and antenna correction factors have been applied, resulting in the sloped noise floor of the displayed signal.
- Page 8 RSA306 USB Real-Time Spectrum Analyzer Demo Guide You can edit the start and stop range, filter shape, RBW, VBW, detector, threshold and excursion, limit line. After loading the spurious table, your display should look similar to the picture below. The green bar is the loaded limit line as standards.
Need help?
Do you have a question about the RSA306 and is the answer not in the manual?
Questions and answers